International Journal of Emerging Technology and Advanced Engineering
Website: www.ijetae.com (ISSN 2250-2459, ISO 9001:2008 Certified Journal, Volume 9, Issue 9, September 2019)
Plant Layout Optimization using CRAFT Algorithm with
Implementation of Digital Manufacturing using DELMIA V6
Software
Amey Dhumal
1, Monit Nagrik
2, Prem Khilari
3, Mahesh Pandhare
4, Dr. Rajesh Buktar
51,2,3,4
BTech Mechanical Engineering, SPCE, Mumbai, India
5
Professor, Dept of Mechanical Engineering, SPCE, Mumbai, India
Abstract— Plant Layout optimization involves systematic arrangement of various resources of a plant especially machines in order to obtain effective co-ordination and efficiency of the 4 M’s (Men, Materials, Machines and Methods) of a plant. This paper aims of optimize the existing layout of an organization in order to obtains reduction in the cost associated with material handling. Also digitally produce the optimized layout in order to virtually visualize the factory and its production flow processes. In order to achieve this a sheet metal fabrication company is been selected. Layout optimization is carried out using CRAFT Algorithm and DELMIA V6 software is used for virtual creation of the factory.
Keywords— CRAFT, DELMIA, Digital Manufacturing,
I. INTRODUCTION
Over the past thirty decades companies are involved in the development and use of new technologies and methods to address new challenges and issues and to sustain in the competing market. Although a variety of technologies and methods to support manufacturing process design have been developed and utilized over the past several years, these efforts have typically been directed towards solutions that have only been used within the manufacturing engineering community; they typically have not been fully integrated into the broader product lifecycle management (PLM) environment that supports product development. Thus the need of reduced product development time along with customer oriented products has led to the integration of the manufacturing systems with computer systems.
In this paper an attempt is made to optimize the existing factory layout of a factory using CRAFT Algorithm in order to obtain minimum transportation cost and to virtually create the optimized layout in DELMIA V6 software along with the simulation of the production flow processes in order to test the feasibility of the layout, machines, products, manpower etc.
II. LITERATURE REVIEW A.Craft Algorithm
The concept of CRAFT Algorithm was developed through two papers published by Vollman Buffa and Armour. It is basically a improvement algorithm which requires initial layout as input & proceeds to improve the layout by interchanging the departments pair wise to reduce the total material transportation cost (TC) function given by below mentioned formula.
TC = distance matrix x load matrix x cost matrix
Distance matrix: It signifies the distance moved for the transportation of product from one department to another.
Load Matrix: It contains human or trolley loads i.e. total no of times the man or trolley moves between departments. It is given by dividing the daily production of products by the number of items the man or trolley handles once when it moves between departments.
Cost matrix: It includes material handling cost between departments.
1)CRAFT Procedure:
1. Divide the entire plant layout into departments on the basis of operations performed in the company. 2. Determine the department centroid.
3. Calculate rectilinear distance between centroids 4. Calculate cost matrix for the layout
5. Calculate load matrix
6. Calculate total transportation cost for initial layout. 7. Consider department exchanges.
8. Determine total transportation cost for each departmental exchange.
International Journal of Emerging Technology and Advanced Engineering
Website: www.ijetae.com (ISSN 2250-2459, ISO 9001:2008 Certified Journal, Volume 9, Issue 9, September 2019) 2)Assumptions:
1. Moving costs are independent of the equipment utilization.
2. Moving costs are linearly related to the length of the move.
3)Input requirements: 1. Initial layout 2. Flow data
3. Cost per unit distance 4. Total no of department
5. Fixed department and their locations 6. Area of department
B.Digital Manufacturing
Digital manufacturing is the use of integrated, computer-based system comprised of simulation, three-dimensional visualization, analytics and various collaboration tools to create products and manufacturing process definitions simultaneously. Simulation of the production process processes provides us a virtual tour of the factory, which helps us to optimize the processes before the products are manufactured.
In this paper, DELMIA Digital manufacturing solution has been used to virtually create and simulate the existing manufacturing environment of the sheet metal fabrication company. DELMIA (Digital Enterprise Lean Manufacturing Interactive Application), a product of the Dassaults Systemes, is a Global Industrial Operations software solution. It enables manufacturers in any industry to efficiently plan, manage, and optimize their global industrial operations. DELMIA provides entire digital solutions for on-demand and just-in-time manufacturing processes, allowing manufacturers to bring their products to market more quickly, while reducing production costs and encouraging innovation.
DELMIA’s digital manufacturing solutions allow manufacturing organizations to design and visualize the entire production process for a digitally specified product before deploying any physical materials and machines. In case of already existing plants, DELMIA proves to be very useful in increasing the capacity by reducing the idle time and by detecting quality related issues at initial stages. It also helps in getting a very clear visualization of the plant layout.
III. METHODOLOGY
A.CRAFT Algorithm 1)Selection of Industry:
A sheet metal fabrication company, Anand tools & Equipments, Thane was selected for layout optimization using CRAFT Algorithm. It mainly manufactures sheet metal components such as Switch-Board Panels, Computers components, paper copiers, high speed computer printers, Petrol Pumps, Note counting Machines, A.T.M. Machines, Cabinets & Chassis, Guards & Racks Electronic Enclosures , Brackets , Control Boxes , Custom Frames / Shelving , weldments etc.
2) Industry Layout Study and collection of data:
The process flow of the industry was studied and necessary details such as plant layout, arrangement of machinery, inventory and raw material, process flow chart were taken. The distance between the machines was taken in order to formulate the Distance matrix.
3)CRAFT Implementation:
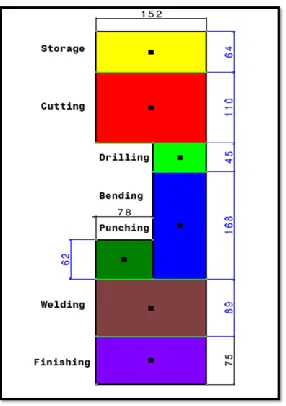
The entire layout of the plant was divided on the basis of operations performed in the industry. The departments were allotted rectangular sections for ease of calculations. Centroid of a rectangular section is the point were two diagonals meet. So if the rectangle has two opposite corners (x1, y1) and (x2, y2) then the centroid is given by ( , ). Using this formula the departmental
[image:2.612.373.516.493.696.2]centroids were calculated and plotted on the layout as shown in fig 1.
Fig. 1 - Present layout of the plant with departmental centroids All the dimensions in mm
International Journal of Emerging Technology and Advanced Engineering
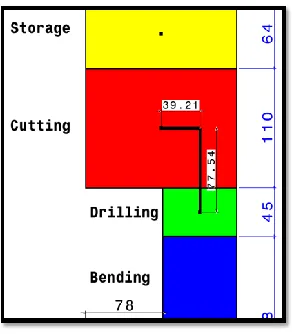
Website: www.ijetae.com (ISSN 2250-2459, ISO 9001:2008 Certified Journal, Volume 9, Issue 9, September 2019) In order to form the distance matrix of the initial layout
[image:3.612.95.241.219.386.2]the rectilinear distance between two departments is required. An estimate of average walking required is obtained from the distance between centroids of two departments. Thus the rectilinear distances between the departments were calculated and transportation matrix was formed as shown in table 1.
Fig. 2- Rectilinear distance between departments
In the selected Industry material handling is carried out with the help of stacker and by human by means of hand. Thus the Material Handling cost by above means was assumed to be in the ratio 2:1 as the handling cost by means of stacker includes stacker operating cost as well as operator cost. Thus the cost matrix was formulated as shown in table 2.
Now for the formulation of the loads matrix, the flow process in the industry was thoroughly studied and a single product for e.g. Kiosk machine daily production was considered. Thus the load matrix was formulated as shown in table 3. Thus from Storage to CNC Cutting machine transportation of metal sheet trough stacker takes place twice for production of 15 Kiosk machines.
Similarly from CNC Cutting to Drilling - 6 times, from CNC Cutting to Bending – 2 times etc.
Finally the Transportation Cost Objective function which consists of the total cost of transportation of raw material, work in process inventory, finished parts from one department to another was calculated as follows:
TC = distance matrix*cost matrix*load matrix
For initial layout (TC) = (87*2*2) + (116.5*6*1) + (223*2*2) + (274*2*2) + (106.5*6*1) + (235.5*6*1) + (274*6*1) + (167.5*5*2) + (129.4*2*2) + (112.5*3*2) + (82*15*2) = 12057
Now for layout optimization department exchanges are performed. For layout exchanges the rules to be followed are as follows:
Areas should be equal
The departments should be adjacent to each other and share a common boundary
Thus total 9 iterations were performed exchanging the department consisting of two department exchanges and three-department exchange.
Two department exchange – 7 No 1: StorageCNC Cutting 2: CNC CuttingDrilling 3: BendingDrilling 4: BendingPunching 5: PunchingWelding 6: BendingWelding 7: WeldingFinishing Three department exchange – 2 No
1: PunchingWeldingBending 2: WeldingPunchingBending
Table 1 –
Distance Matrix (From-To Matrix)
From Storage CNC Cutting Drilling Bending Punching Welding Finishing
To
Storage 0 87 - - - - -
CNC Cutting - 0 116.5 223 274 - -
Drilling - - 0 106.5 235.5 274 -
Bending - - - 0 - 167.5 -
Punching - - - 129 0 112.5 -
Welding - - - 0 82
International Journal of Emerging Technology and Advanced Engineering
Website: www.ijetae.com (ISSN 2250-2459, ISO 9001:2008 Certified Journal, Volume 9, Issue 9, September 2019) Table 2
Coat Matrix
From Storage CNC Cutting Drilling Bending Punching Welding Finishing
To
Storage 0 2 - - - - -
CNC Cutting - 0 1 2 2 - -
Drilling - - 0 1 1 1 -
Bending - - - 0 - 2 -
Punching - - - 2 0 2 -
Welding - - - 0 2
Finishing - - - 0
Table 3 Load Matrix
From Storage CNC Cutting Drilling Bending Punching Welding Finishing
To
Storage 0 2 - - - - -
CNC Cutting - 0 6 2 2 - -
Drilling - - 0 6 6 6 -
Bending - - - 0 - 5 -
Punching - - - 2 0 3 -
Welding - - - 0 15
International Journal of Emerging Technology and Advanced Engineering
Website: www.ijetae.com (ISSN 2250-2459, ISO 9001:2008 Certified Journal, Volume 9, Issue 9, September 2019)
a b c
Fig. 3 - Department exchanges
Two department exchange: a- StorageCNC Cutting, b- CNC CuttingDrilling
Three department exchange: c- WeldingPunchingBending
[image:5.612.75.542.95.414.2] [image:5.612.325.543.480.654.2]Thus total 9 department exchanges i.e.9 iterations were performed and the transportation cost for each iteration is as follows:
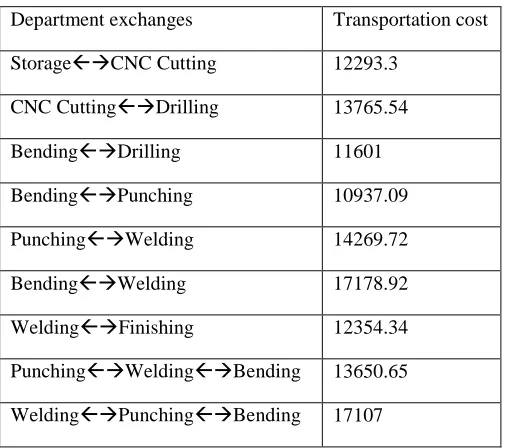
Table 4
Tranportation cost function for each department exchanges.
Department exchanges Transportation cost
StorageCNC Cutting 12293.3
CNC CuttingDrilling 13765.54
BendingDrilling 11601
BendingPunching 10937.09
PunchingWelding 14269.72
BendingWelding 17178.92
WeldingFinishing 12354.34
PunchingWeldingBending 13650.65
WeldingPunchingBending 17107
To obtain a clear shot idea of the optimum layout and to compare these layout a graph is been ploted as shown below.
1
2
2
9
3
.3
1
3
7
6
5
.5
4
11601
1
0
9
3
7
.0
9
1
4
2
6
9
.7
2
17178.92
1
2
3
5
4
.3
4
1
3
6
5
0
.6
5
17107
0 2000 4000 6000 8000 10000 12000 14000 16000 18000 20000
1 2 3 4 5 6 7 8 9
Iteration Transportation Cost
[image:5.612.43.298.500.724.2]International Journal of Emerging Technology and Advanced Engineering
Website: www.ijetae.com (ISSN 2250-2459, ISO 9001:2008 Certified Journal, Volume 9, Issue 9, September 2019) From the graph it is clear that that the transportation cost
function for the 4th exchange (BendingPunching) is minimum i.e. 10937.09 compared to that of the initial layout i.e. 12057resulting in a 10% cost reduction.
B.Virtual Factory creation using DELMIA V6 software From the CRAFT Algorithm results it is clear that that the department exchange (CNC CuttingDrilling) results in lowest transportation cost as compared to the initial layout. Thus the optimized layout is been virtually created using DELMIA V6 software. Also simulation of the existing layout is been performed.
For the creation of the virtual factory, Manufacturing Planning: Resource definition and Layout module was used. The virtual factory created is been shown in fig-2.
After creation of the virtual industry respective human tasks were assigned to the manikins who played the role of human operator in the virtual factory. The manikins were created as a replica of the human operators with the help of DELMIA V6 module, Ergonomics. It consisted of three sub-modules basically- Human Builder, Human Measurement Editor and Human Task Definition. Human Builder and Human Measurement Editor, sub-modules are used for the creation of the manikins i.e.to adjust the height of the manikins, for appropriate location allotment to the manikins, etc. Human Task Definition sub-module is used for assigning respective human tasks to the manikins. We had used here four tasks namely GET, GOTO, USETOOL and PUT. Thus the virtual factory was created and respective human operator tasks were assigned to the manikins. Then the simulation of the factory was created.
[image:6.612.49.553.316.724.2]a b Fig. 5 – Virtual Factory created using DELMIA V6
a - 3D View of the Industry b - 3D View of Manufacturing Shop Floor
a b c Fig. 5 – Virtual Factory created using DELMIA V6
International Journal of Emerging Technology and Advanced Engineering
Website: www.ijetae.com (ISSN 2250-2459, ISO 9001:2008 Certified Journal, Volume 6, Issue 8, August 2016)
60 IV. RESULTS AND DISCUSSION
From the graph presented above it is clear that the department exchanges performed in CRAFT Algorithm leads to variable transportation cost. Thus with proper shop floor resources placement like machines, operators etc. will lead to efficient utilization of the same and also add on to the company’s profits by increasing production and reducing material transportation cost.
Also with the help of DELMIA V6, the optimized layout was validated to check the feasibility of the machines, manpower, raw material, work in process inventory, finished product etc. Also it is been seen that this software would be essentially useful during the planning stage of a factory. Thus the factory can be visualized without investing in the machines and the processes can be optimized before the product is manufactured.
V. CONCLUSION
By comparing the optimized layout with the existing layout it is seen that, with proposed layout there is better utilization of the machines and manpower which has resulted in lower material transportation cost function, ultimately contributing to the profit of the company.Also DELMIA, Digital Manufacturing soutions can lead to decrese in the transformation time of a industry from paper to actual environment with proper validation of all material transformation processes without investing actually in factory installation and set-up. Thus during planning stage, this software also leads to elimination of the cost, that will occur due to error in design stage of the factory.
REFERENCES
[1] Dassaults Systemes Case Study, Tata Motors Adopts DELMIA Solutions for DigitaL Manufacturing , Tata Motors Ltd., 2008. [2] Siemens PLM Case Study, Designing better factories virtually,
Eicher Engineering Solutions, 2012.
[3] Dassaults Systemes, 3D Experience Manufacturing and Production Role, Plant Layout Designer Datasheet PLA, 2014.
[4] Dassaults Systemes, Robotics Simulation Engineer, Robotics-Simulation- Engineer-Datasheet-RTS, 2014.
[5] A Typical Manufacturing Plant Layout Design Using CRAFT Algorithm,
https://www.researchgate.net/publication/275540898_A_Typical_M anufacturing_Plant_Layout_Design_Using_CRAFT_Algorithm.
[6] Lecture 32- Computerised Layout Planning
https://www.youtube.com/watch?v=q8xxKVtRbws..
[7] G Chryssolouris, D Mavrikios, N Papakostas, and K Georgoulias, Digital manufacturing: History, perspectives, and outlook, Proceedings of the Institution of Mechanical Engineers, Part B: Journal of Engineering Manufacture 2009 223: 451, 20 June 2008 [8] Achilles Group Limited, Supply Chain Mapping, Understanding
your multi-tier supply chain, 06/2013[Online],
http://www.achilles.com/images/pdf/communitypdfs/Automotive/Ac hilles-Supply-Chain-Mapping.pdf[Accessed 10.09.2015
[9] Siemens PLM Case Study, Mahindra rises with digitally planned new vehicle manufacturing facility, Mahindra Vehicles, 2011 [10] Siemens PLM Case Study, HHI implemented the first PLM
infrastructure specialized for shipbuilding, resulting in significantly improved information sharing and efficiency, Hyundai Heavy Industries, 2012
[11] SIEMENS PLM Case Study, Leading automotive OEM in India validates plant designs digitally using FactoryCAD in the Tecnomatix portfolio, Maruti Suzuki India Limited (MSIL), 2008 [12] SIEMENS PLM Case Study, Digital manufacturing solution
optimizes plant management, SKODA AUTO, 2009
[13] K Balamurugan, V Selladurai, and B Ilamathi, Design and optimization of manufacturing facilities layouts, Department of Mechanical Engineering, Bannari Amman Institute of Technology, Sathyamangalam, India, 2 May 2006
[14] Vaughan Hetem, Integrating Capacity Simulation Into Process Planning, Manager, Technical Services Advanced Manufacturing Engineering – Powertrain, Winter Simulation Conference Proceedings of the 2001
[15] Mirosław Matusek, Layout Planning: A Case Study On Engineering-To-Order Company, Carpathian Logistics Conference(Clc), Jeseník, Czech Republic, Eu, 7-9. 11. 2012,