i
Service failure and recovery in UK airlines
By
Vasilis Gotsis
Supervisor: Dr. Agata Maccarrone – Eaglen
Salford Business School
University of Salford, Salford, UK
ii
Abstract
This research has focused on the service failure and recovery of the Airline industry and the impact that has on customer satisfaction along with the task to identify optimal recovery strategies.
It has identified 22 Failure types that occurred during service failure and has expanded the understanding of the impact that several factors such as Severity of Failure, Failure type, Emotion and Justice have on Post Failure Satisfaction (PFS), on Satisfaction with Recovery (SWR), on Post Recovery Satisfaction (PRS) and Loyalty through the use of a suggested model (conceptual framework).
More specific it has found that the factors of Severity of Failure (exclusively for the airline industry) and Failure type have a negative effect on Post Failure Satisfaction (PFS), on Satisfaction with Recovery (SWR), on Post Recovery Satisfaction (PRS) and Loyalty. In addition, the factor of Emotion did not have a significant effect on Post Recovery Satisfaction (PRS) and Loyalty while the factor of Justice has.
It has also identified some recovery strategies that work more effectively after the occurrence of service failure. More particularly the strategies of providing (on behalf of the airline company) : (1) Opportunity to voice my view/feelings, (2) Correction of the problem, (3) Staff empowered to solve the problem, (4) Apology for the service failure), (5) Follow-Up in writing from airline manager, (6) Facilitation for making complain process easier, (7) Appropriate place to explain/handle the complaint, (8) Understanding staff and some others to a smaller extent, work more effectively with regards to the recovery process for the customer.
The research had a quantitative approach and was carried out with multivariate statistics (IBM’s SPSS software package) such as Analysis of Variance (ANOVA) and (OLS) Regression analysis. It suggested a model (conceptual framework) where several factors were tested with the above-mentioned statistics.
Further this research has also revealed some service quality models for the airline industry (both industry specific and non) that work better and more specific suggested the use of the Hierarchical model along with industry-based models. In addition, the usage of the SERVPEX and SERVPERF models cannot be totally rejected as there are arguments from both sides.
iii
Table of contents
Title page Abstract
Table of contents
ii iii-v
List of table v-viii
List of figures ix
Acknowledgement x
Chapter One - Introduction 1.1 Introduction
1.2 Study background 1
1-3
1.3 Research rationale 3-6
1.4 Research questions 6
1.5 Research objectives 7-8
1.6 Results of the study 8
1.7 Definitions 8
1.7.1 Service Quality 8
1.7.2 Service Failure 9
1.7.3 Service Recovery 9-10
1.8 Thesis outline 10
Chapter Two – Literature Review
2.1 Introduction 11
2.2 Aims and objectives 11
2.3 Service Quality 11-13
2.3.1 Linkage of Service Quality with Satisfaction 13 2.3.2 Linkage of Service Failure (SF) and Service Recovery
(SR) 14
2.3.3 Service Quality models 14-15
2.3.4 Nordic model 15-17
2.3.5 SERVQUAL model 17-20
2.3.6 Critique of the SERVQUAL model 20-23
2.3.7 SERVPERF model 23-25
2.3.8 Multilevel model 2.3.9 SERVPEX model 2.3.10 Hierarchical model
2.3.11 Industry-specific service quality models
2.3.12 Suggested Service Quality model for the Airline industry 25 26-27 27-29 29-35 35-37
2.4 Service Failure 37
2.4.1 Service Failure Impact on Customer Satisfaction 38-39 2.4.2 Service Failure in the Airline Industry
2.4.3 Service Failure and Priorities for Service Attribute Improvement
2.4.4 The IPA Analysis model and its successors 2.5 Service Recovery
2.5.1 Service Recovery Compensation types
2.5.2 Service Recovery through the CRM process model
iv
2.5.3 Service Recovery Communication impact on Customer satisfaction
2.5.4 Service Recovery and Affective commitment on Complaint intention
2.6 Severity 2.7 Justice 2.8 Loyalty 2.9 Emotion
2.10 Gaps from the Literature 2.11 Research Objectives
2.11.1 The conceptual framework / proposed model for this study 59-60 60-61 62-68 68-74 74-81 82-92 92-95 95 95-99
Chapter Three - Methodology
3.1 Introduction 100
3.2 The Research Paradigm 101-108
3.2.1 The Researcher’s approach 108-110
3.3 The Research design 110-112
3.3.1 Research Method – Quantitative approach vs
Qualitative approach 112-114
3.3.2 Selected Research Method – The Quantitative
approach and why 114-116
3.4 Operationalisation of the research method 116
3.4.1 The Sample and Research Representatives 116-120 3.4.2 Sample through Internet
3.4.3 Sample size
3.4.4 Questionnaire design 3.4.5 Data Collection Strategy 3.4.6 The actual Questionnaire 3.4.7 Pre-testing of the questionnaire 3.4.8 Pilot Test
3.5 Ethical Issues
3.5.1 Ethical Approval
3.5.2 Data Collection of the questionnaire 3.6 Reliability and Validity
3.6.1 Reliability 3.6.2 Validity 3.6.3 Data Analysis 3.6.4 The Questionnaire
120-121 121-124 124-127 128 128-133 133-134 134-136 136-137 137 137-138 138 138-141 141-142 142-143 144-148
Chapter Four - Data Analysis and Discussion
4.1 Introduction 149
4.2 Part 1a – Service Failure Incidents analysis: 22 Failure Types occurrence and rationale for each one
4.2.1 Purpose of trip analysis
149-168 168
4.2.2 Regular vs Low-cost Airlines usage 169
4.2.3 Airline Travel class usage
4.2.4 Domestic or International Flight usage
v
4.2.5 Frequency of Flights (with the same Airline) 172 4.3 Part 1b – Service Recovery Application Analysis 173 4.4 Part 2 – Main Data analysis of the conceptual framework
(Through IBM’s SPSS Software Package) 174
4.4.1 H1 hypothesis testing 175-181
4.4.2 H2 hypothesis testing 4.4.3 H3 hypothesis testing
182-188 189-191 4.4.4 H4 hypothesis testing
4.4.5 H5 hypothesis testing 4.4.6 H6 hypothesis testing 4.5 Discussion of the Results
Chapter 5 – Conclusion
5.1 General discussion 5.2.Theoritical contribution 5.3 Managerial implication
5.4 Recommendations for future research
192-197 198-202 203-208 209-218
219-224 224-226 226-227 227-228
References
Appendice
Appendix 1 – Methodology philosophies
Appendix 2 – Ten components of service quality Appendix 3 – Ethical Approval
List of tables
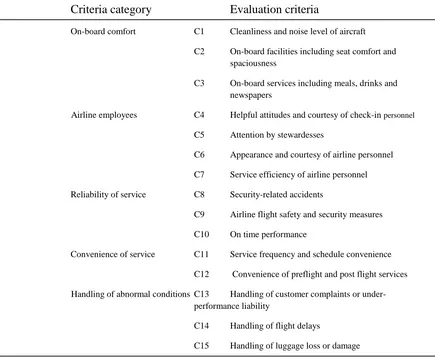
Table 2.1 Tsaur’s et al airline model–weight of the 15 criteria 31 Table 3.1 Basic Belief of Alternative Inquiry Paradigms 103
Table 3.2 Research approach comparison 112
Table 3.3 A Comparison between Quantitative and Qualitative
Research Methods 115
Table 3.4 Suggestions for Questionnaire wording 127 Table 3.5 Application of Reliability Improvement Methods to
Multiple Item Questions 140
Table 4.1 Service failure incidents from the airline industry 149-150
Table 4.2 Factors that caused Flight Delay 150
Table 4.3 Factors that caused Baggage Delay 152
Table 4.4 Factors that caused Poor service 152
Table 4.5 Factors that caused Flight cancellation 153
Table 4.6 Factors that caused Baggage lost 154
Table 4.7 Factors that caused Bad food 155
Table 4.8 Factors that caused Lost Flight 156
Table 4.9 Factors that caused Baggage damage 157
Table 4.10 Factors that caused Poor Food service 157 Table 4.11 Factors that caused Flight diversion 158
Table 4.12 Factors that caused Bad behaviour 159
vi
Table 4.15 Factors that caused Small size seat / Legroom 161 Table 4.16 Factors that caused Entertainment gadget broke 162 Table 4.17 Factors that caused Flight Re-Schedule 163 Table 4.18 Factors that caused Ticket issue failure 164 Table 4.19 Factors that caused Lost / Stolen Things 165 Table 4.20 Factors that caused Flight overbooking 165
Table 4.21 Factors that caused Crash Landing 166
Table 4.22 Factors that caused Booking System Error 167 Table 4.23 Factors that caused Web Booking not Flexible 167
Table 4.24 Purpose of Trip 168
Table 4.25 Regular airlines vs Low-cost airlines usage 169
Table 4.26 Travel class 170
Table 4.27 Domestic or International Flight 171
Table 4.28 Frequency of Flights (with the same Airline) 172
Table 4.29 Airline attempted recovery items 173
Table 4.30 (OLS) Regression of Post Failure Satisfaction on
Failure Severity 174
Table 4.31 (OLS) Regression of Satisfaction with Recovery
(SWR) on Failure Severity (FS) 175
Table 4.32 (OLS) Regression of Post Recovery Satisfaction
on Failure Severity 176
Table 4.33 (OLS) Regression of (d1) Loyalty (Word of
Mouth) on Failure Severity 177
Table 4.34 (OLS) Regression of (d2) Loyalty (Fly same
Airline – repurchase) on Failure Severity 178
Table 4.35 (OLS) Regression of (d3) Loyalty (Not switch
Airline) on Failure Severity 179
Table 4.36 (OLS) Regression of (d4) Loyalty (Consider this
Airline my primary choice) on Failure Severity 180 Table 4.37 One-way ANOVA for Failure Type Impact on
Post Failure Satisfaction (PFS) 181
Table 4.38 One-way ANOVA for Failure Type Impact on
Satisfaction with Recovery (SWR) 182
Table 4.39 One-way ANOVA for Failure Type will have a
significant impact on (b) Post Recovery Satisfaction (PRS) 183 Table 4.40 One-way ANOVA for Failure Type (will have a
significant impact on (d1) Loyalty (Word of Mouth) 184 Table 4.41 One-way ANOVA for Failure Type will have a
significant impact on (d2) Loyalty (Fly Same Airline) 185 Table 4.42 One-way ANOVA for Failure Type will have a
significant impact on (d3) Loyalty (Not Switch Airline) 186 Table 4.43 One-way ANOVA for Failure Type will have a
significant impact on (d4) Loyalty (Consider this Airline my
primary choice) 187
Table 4.44 OLS Regression of Post Recovery Satisfaction (PRS) on (a1) Loyalty (Word of Mouth)
Table 4.45 OLS Regression of Post Recovery Satisfaction (PRS) on (a2) Loyalty (Fly Same Airline)
188
189 Table 4.46 OLS Regression of Post Recovery Satisfaction
vii
Table 4.47 OLS Regression of Post Recovery Satisfaction (PRS) on (a1) Loyalty (Consider this Airline my primary
choice) 190
Table 4.48 OLS Regression of Recovery Action in Satisfaction with Recovery (SWR)
Table 4.49 OLS Regression of Recovery Action in Post Recovery Satisfaction (PRS)
191
192 Table 4.50 OLS Regression of Recovery Action in (c1)
Loyalty (Word of Mouth)
Table 4.51 OLS Regression of Recovery Action in (c2) Loyalty (Fly Same Airline)
193
194 Table 4.52. OLS Regression of Recovery Action in (c3)
Loyalty (Not Switch Airline)
Table 4.53. OLS Regression of Recovery Action in (c4) Loyalty (Consider this Airline my primary choice)
195
196 Table 4.54 Value Mediation Analysis
Table 4.55 Value Mediation Analysis
198 200 Table 4.56 Value Mediation Analysis
Table 4.57 Value Mediation Analysis Table 5.1 Sixteen Recovery Strategies
203 206 219 Table 5.2 Eight and Nine Recovery strategies with better
effect for SWR and PRS subsequently
Table 5.3 Nine, eight, ten and eleven Recovery strategies with better effect for Loyalty (WOM), Loyalty (Fly Same Airline), Loyalty (Not Switch Airline), Loyalty (Consider this Airline my primary choice) subsequently
220 185
221
Table 5.4 Most Effective Recovery Strategies 222
List of figures
Figure 2.1 The Nordic model 12
Figure 2.2 The Three-Component model 13
Figure 2.3 The 5 gaps of the SERVQUAL model 14
Figure 2.4 The 5 gaps of the SERVQUAL model (ii) 15
Figure 2.5 The RATER characteristics 16
Figure 2.6 The Multilevel model 22
Figure 2.7 The Hierarchical model 24
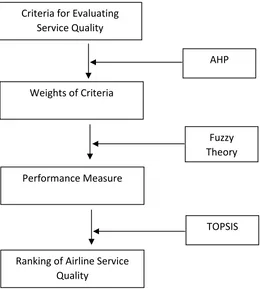
Figure 2.8 Evaluation framework of airline service quality 27 Figure 2.9 Criteria used for service quality evaluation of
viii
Figure 2.10 Huang’s conceptual model 31
Figure 2.11 Service, satisfaction and financial relationship 40 Figure 2.12 Structure of incidents – Customer satisfaction –
Market share linkage 42
Figure 2.13 The original IPA Framework 44
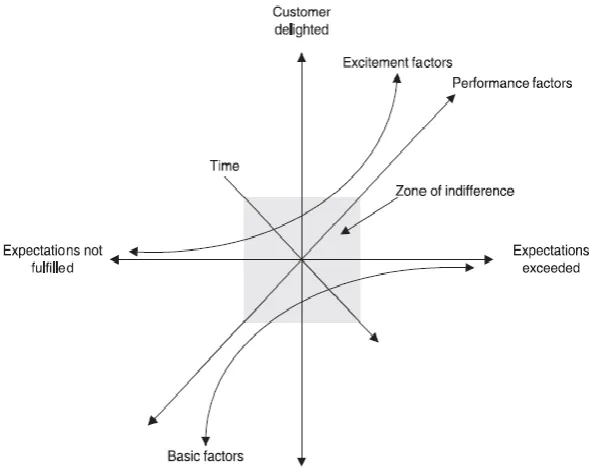
Figure 2.14 Three-factor theory 45
Figure 2.15 Slack’s IPA Matrix 46
Figure 2.16 Roschk’s and Gelbrich’s theoretical framework Figure 2.17 Customer relationship management process Figure 2.18 Hypothesized service recovery model
Figure 2.19 Evanschitzky et al., (2011) Conceptual model Figure 2.20 Wang et al., (2011) Research model diagram Figure 2.21 Nikbin’s et al., (2011) Research framework Figure 2.22 Komunda and Oarenkhoe’s Conceptual framework (2012)
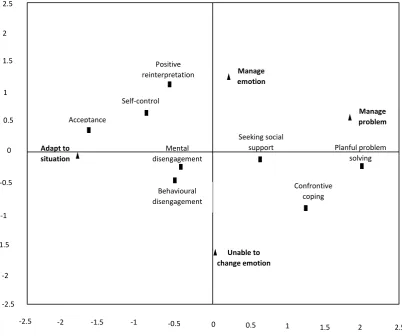
Figure 2.23 Cognitive Appraisal Model for Service Recovery Figure 2.24 Multidimensional scaling solution for eight coping strategies
Figure 2.25 Conceptual Framework for the Study Figure 3.1 Research Onion
Figure 3.2 Distribution of sample estimates
Figure 4.1 Perceived Value Mediation Model 1 after Baron and Kenny (1986)
Figure 4.2 Perceived Value Mediation Model 1 after Baron and Kenny (1986)
Figure 4.3 Perceived Value Mediation Model 1 after Baron and Kenny (1986)
Figure 4.4 Perceived Value Mediation Model 1 after Baron and Kenny (1986)
49 54 55 58 61 69
73 76
85 92 97 232
202
204
207
ix
Acknowledgement
Firstly, I would like to say thank you to my first supervisor Dr. Peter Schofield for the
support he provided me throughout the first years of this research project. His level of
knowledge assisted significantly in making this study feasible.
My gratitude also goes to my second supervisor Dr. Agata Maccarrone – Eaglen who
assisted me in the same level throughout the final years of this study. Her level of
punctuality, the support she offered me and also the patience she showed was truly
great and I’d like to personally thank her for that.
I would like also to say thank you to Dr. James Mulkeen for all the support and
understanding he showed throughout this study.
This study is dedicated to my father who I’ve lost recently and I’d like to thank all
people of Salford University for the support and understanding they showed me during
the years of this study, most particularly to Kerry Moores and Vicki Harvey for their
1
CHAPTER 1
INTRODUCTION
1.1Introduction
This study will focus on service failure in UK airlines. Its main objective is to create a theoretical model in order to develop further our understanding of the impact that airline service failure has on customer satisfaction and to identify optimal recovery strategies.
The research will be focused on the criticality and severity of failure by type and the comparative effectiveness of alternative recovery strategies from the consumer perspective.
The aim of this study is to contribute further to the literature through in-depth analysis of service failure, critical incidents and evaluation of alternative recovery strategies to build a clear understanding of the problem and contribute to the sustainable development of organisations.
A critical review of the service failure literature and in-depth interviews with airline passengers will underpin the design of a conceptual model for a large scale e-survey to examine perceptions of service quality and assess service failure and recovery strategies. The data analysis will employ structural equation modelling and multivariate statistics.
1.2 Study background
The airline industry has been characterized as a highly competitive industry with low profit margins and high fixed costs making it very difficult for some airlines to compete against others with greater financial resources or lower operating costs (Dempsey and Gessel, 2012).
A small reduction on passenger numbers from service failure could have an immediate effect on each airline company’s financial situation. Therefore the management of service failure is of vital importance playing a leading role on customer satisfaction.
2
much room for the airlines to transfer the increased costs of fuel to their customers, it is even more important for them to focus more on customer satisfaction. Despite last’s year’s reduction in oil prices that seem of a temporary situation without further guarantee that this will continue. That endorses further the initial focus that airlines must have on customer satisfaction.
Many airlines have invested in advanced technology and it is expected that they will invest more than $3.5 trillion on 27,800 new aircraft having a seating capacity of more than 100 over the next two decades (Zacks Investment Research, December 2012). That prediction is still accurate besides some aircraft delays due to internal production problems something which is not related with the airplane marketplace and lately Boeing’s chief executive Dennis Muilenburg stated on 27/1/2016 that: “We continue to see a generally
healthy commercial airplane marketplace driven by improving airline profitability, solid passenger traffic growth, and meaningful replacement,”
(BloomBergBusiness, 2016).
The near-future adoption of NextGen, a satellite-based navigation system which will make air travel more efficient as it “will improve further the accuracy, availability, and integrity needed to support continuous all-weather use” (Federal Aviation Administration- faa.com, 2015) and also the implementation of numerous technology upgrades such as airline reservation systems, flight operation systems, website maintenance and in-flight entertainment systems will enable companies to reduce their costs further (Zacks Investment Research, August 2012). However, this choice is expensive and many airlines continue to operate with less efficient aircraft showing that the industry is “hampered by slim margins, focusing carriers to focus on both cost reduction and revenue growth through better customer interactions” (PwC, 2015).
Within this context, a small reduction in passenger numbers from service failure could have an immediate effect on an airline company’s financial situation. Therefore, the management of service failure is of vital importance as superior customer service provides a competitive advantage (Gabbott, et al., 2011).
The latest trend shows that the airline industry has been neglected in terms of service failure in contrast with other industries that focused more in understanding customer’s preferences (PwC, 2015). The loyalty programs provided substantial customer data but didn’t revealed “real insights about travel behaviour and choices” (PwC, 2015).
3 Boarding” (KLM, 2013) but the general tendency is that the airline industry has been neglected in terms of service failure and recovery and more particularly on those minor incidents which proves to be the ones that are strongly related (in a negative way) to future market share even from the major ones (Keiningham et al., 2014).
There is literature review which is directly related with the airline industry but not extensively. That literature part has examined the relation that service failure plays on satisfaction (e.g., Anderson, Baggett, and Widener 2009; Bamford and Xystouri 2005; Lapre´ 2011; Lapre´ and Tsikriktsis 2006; McCollough, Berry, and Yadav 2000), the level of loyalty (e.g., Zins 2001), and market share (e.g., Rhoades and Waguespack 2005); the relation of service brand-trust in the brand-customer value/loyalty in relation to the severity of the service failure for air travellers (Sajtos, Brodie, and Whittome, 2010); the relationship between minor-major incidents and the impact they have to customers (Keiningham et al., 2014).
Air travel demand is linked with the economic level of a country. Very quick industrialization in a number of countries overseas led to fast growing of air travellers (Jou, Lam, Kuo, & Chen, 2008). Therefore the provision of superior quality became a priority for the airline industry in order to sustain being competitive (Mustafa et al., 2005).
It is critical apart from understanding the way of how passengers evaluate the service process to identify also the decisive primary and sub dimensions that is being used to measure service quality in the airline industry. Many airlines have faced problems in order to evaluate a proper scale of service quality which led them to further service failures as they could not appropriately assess and improve their service performance (Park, et al., 2004).
Undoubtedly the perception of the customers for service failure has a direct negative impact on their satisfaction. Besides that there are different service failures in terms of importance to passengers. For example some passengers will perceive a 1-hour flight delay as severe in case they miss an important event or business meeting while a lack of a particular desired food item will not be perceived as a severe failure but rather as an annoyance (Sajtos, Brodie, and Whittome 2010).
1.3 Research Rationale
As the literature on service failure and recovery that is directly related with the airline industry is relatively small that gave further motive to the researcher to examine these issues within that particular industry.
4
customer’s satisfaction. There is a substantial amount of literature examining these issues and beyond across the service sector in general but not in the airline industry except from very few cases. The researcher therefore identified a gap on that as there is lack of literature with regards to the recovery process in the airline industry specific that has to be followed after a service failure. The purpose consequently here is to seek for more clarity on this area of the airline industry.
As the research took place it managed to identify specific failure types that occur in the airline industry such as “Flight delay”, “Baggage lost” and “Bad lever of service” – the three more frequent – and also identified a certain number of recovery strategies such as “An opportunity provided to voice my view/feelings”, “Correction of the problem”, “Staff empowered to solve the travellers problem”, “An apology for the service failure”, “Follow-Up in writing from airline manager” and some other to a smaller extent which are met later in the study.
Customer satisfaction plays a vital role in every organisation’s strategic plan. As the competition becomes more challenging due to lower switching costs many service brands have difficulties in focusing on the quality of the customer experience (Gabbott, et al., 2011). Not surprisingly, research in this area (Matzler, 2004) has attempted to identify the key determinants of customer satisfaction because the implementation of a new strategy in line with the new research findings will bring sustainable growth to any organisation operating in today’s competitive market environment. Further from research the company’s complaint handling in relation with the customer responses showed that the relationship between justice perception and satisfaction construct depend on several moderators with one of them being the nature of the industry (Gelbrich and Roschk, 2011).
Given the fact that more than half of the entire airline industry is run by a small number of companies (less than twenty) it is crucial for the rest of the competition that further research must take place on customer satisfaction. By improving a poor performance attribute will bring a prominent improvement to the customer’s overall experience perception (Bacon, 2012). This will contribute more and even facilitate the entrance of new competitors as now we are in a crucial crossroad for the whole airline industry. The process of service failure recovery for the customer is critical regardless if there is complaint or not (Vaerenbergh et al., 2012).
5
One crucial part in the service failure is the condition that the customer will be just after the service failure. This is the Post Failure Satisfaction (PFS) condition which occurs right after the service failure where the customer has most of the times a certain negative amount of satisfaction. Then once the recovery process engages the condition for the customer is called Post Recovery satisfaction (PRS) which means that this recovery action can turn things better for the customer, can leave things remain the same or even can make things even worse. It will depend from the type of recovery strategy that is applied.
Therefore in these conditions with regards to customer level of satisfaction or not has to be shed a light in order to increase clarity and suggest the most appropriate recovery strategies. This can be done through the use of a conceptual framework that will specifically be designed and suggested for this study.
The airline industry is made up of different types of operations such as the full service airlines/or legacy/or premium airlines and the low-cost ones. The former is present since almost the beginning of aviation while the latter appeared firstly in the United States in 1978 and only in short-haul flights, through Southwest airlines. Based in Dallas, Southwest was a pioneer of the low-cost model that entailed the usage of the exact same type of aircraft for the entire fleet – in that case the Boeing 737 – to put maintenance costs level even lower and by having gained savings on that to push for further reduction on fares as much as possible banning at the same time the free offer of food during flight. This low-cost model was quite successful and was copied in the 90’s by Ryanair and EasyJet introducing the low-cost format in Europe.
The major differences among those two are the price differentiation of the fares (cheaper in the low-cost airlines providers), the service differentiation during flight (with the legacy airlines to offer free of charge on baggage and free in-flight catering) and also the airport usage with the low-cost airlines choosing to operate from airports that are in the far outskirts of cities in order to avoid paying high airport taxes that central airports have located in close perimeter of cities centres.
6
is it simply not a big deal for the majority of the passengers. (globalexplorer.co.uk)
However, in the past these differences between those two modes of operations were quite significant particularly in the amount of fares differentiation and service offered. The last years the gap on fares has been reduced by 30% on average and that is mainly because the legacy airlines have abandoned some policies of free charge on baggage and in-flight catering on short-haul flights (KPMG, 2013).
That situation makes things even more competitive with the legacy ones as the margin of differentiation is smaller. Therefore, the level of service quality (SQ) offered and the levels of service recovery (SR) also in the case of a service failure are vital.
The quality of the service offered is of vital importance particularly when the employee can solve a current problem of a passenger on the spot. Jan Carlzon the CEO of SAS is considered among the pioneers in management training as he introduced in the early 80’s as CEO of SAS an ongoing training program called Putting People First that was developed by Claus Moller. That particular program targeted on assigning responsibility directly on customer-facing staff, allowing them to take decisions on the spot and removing the whole process from management hands. Famous moto of Carlzon is the "Problems are solved on the spot, as soon as they arise. No front-line employee has to wait for a supervisor's permission." (thinkexist.com)
These changes were very successful when implemented by SAS and led to be copied by other airline carriers. This implementation created a decentralisation of the company and influenced largely the morale of the employees while at the same time created a training methodology called Scandinavian Service School that worked through a joint venture with another company named TMI. Through this approach, a flat organizational structure was created which together with the delegation processes and the employee empowerment adoption for the company led to huge success for SAS during the 80’s (Moments of Truth, Harper Perennial, 1987). This approach led the American Management Association 1n 1998 to declare it as among the most important developments for management in the 20th century.
1.4Research Questions
7
2. What are the different Failure types that appear before the actual recovery process begins and how they influence the recovery process? What is their impact on Satisfaction with Recovery (SWR), Post Recovery Satisfaction (PRS) and Loyalty?
3. Is the level of Loyalty different between the Post Failure Satisfaction and the Post Recovery Satisfaction for the customers?
4. What is the impact that the Recovery action has on Satisfaction with Recovery (SWR), Post Recovery Satisfaction (PRS) and Loyalty? Which of the recovery strategies that the airlines use after the occurrence of service failure work better and more efficiently? What’s the implication involved?
5. What is the role of Emotion during the service recovery process? Does it partially mediate the impact of Satisfaction with Recovery (SWR) on Post Recovery Satisfaction (PRS) and Loyalty?
6. What is the role of Justice during the service recovery process? Does it partially mediate the impact of Satisfaction with Recovery (SWR) on Post Recovery Satisfaction (PRS) and Loyalty?
1.5Research Objectives
1. To evaluate the implication that the Severity of Service Failure has on customer satisfaction with regards to their Post Failure Satisfaction (PFS). In other industries the severity of failure does influence more negative the consequences of the service failure, it magnifies them. Here through the research the objective is to find if a similar situation exist in the airline industry as with the other industries.
2. To evaluate customer perceptions of the airline passengers with regards to the different Failure types.
3. To evaluate the difference between the two different conditions of Post Failure Satisfaction (PFS) and Post Recovery Satisfaction (PRS) with regards to the customer.
8
5. To evaluate the factor of “Emotion” that has on customer perception about the service recovery and whether it partially mediates the impact that Satisfaction with Recovery (SWR) has on Post Recovery Satisfaction (PRS) and Loyalty.
6. To evaluate the factor of “Justice” that has on customer perception about the service recovery and whether it partially mediates the impact that Satisfaction with Recovery (SWR) has on Post Recovery Satisfaction (PRS) and Loyalty.
1.6 Results of study
The research on service failure that took place after the collection of primary data revealed that there were found twenty two (22) service Failure types. From those twenty two types the first three captivated a percentage of 68.27% in total and more specific they were the “Flight delay” with 46.35%, the “Baggage delay” with 13.10% and the “Poor service” with 8.82%. The remaining nineteen failure types captivated the rest 31.75% (with smaller percentages each ranging from 5.29% the highest to 0.25% the lowest) and all are discussed together with the first three in details in Chapter 4 (Data analysis).
Additionally the suggested conceptual framework research revealed that the Severity of the Failure has a negative impact on Post Failure Satisfaction (PFS), Post Recovery Satisfaction (PRS) and Loyalty. Further the research study revealed that the Failure type has a negative impact on Post Failure Satisfaction (PFS), Post Recovery Satisfaction (PRS) and Loyalty. Additionally some of the recovery strategies work more effectively on customers in the airline industry. Finally during the Recovery action the factor of Emotion didn’t had a great impact as was initially expected (based on the results found which are not statistically significant) whereas the factor of Justice had an impact on Satisfaction with Recovery (SWR), Post Recovery Satisfaction (PRS) and Loyalty.
1.7 Definitions
The section provides a brief introduction to the concepts which are fundamental to the research questions and more detailed discussion will be presented in chapter 2.
1.7.1 Service quality
9
1983; Hjorth-Anderson 1984), the service quality has been built on three points unique to services: intangibility, heterogeneity and inseparability of production and consumption (Panasuraman, Zeithaml, and Berry 1985). It is an attitude linked in a way with satisfaction, coming out through a comparison of expectations with performance.
1.7.2 Service failure
It is the situation where the service fails to line up with the customer expectations (Michel, 2001). It can take place in both the process and the outcome of the service delivery (Lewis and McCann, 2004).
According to Bitner et al., (1990) service failure can be categorised with employee’s behaviour and is being related to: the core service; requests for customised service; and unexpected employee actions. In a subsequent study Bitner et al., (1994) included a classification of problematic customers with Kelley et al., (1993) and Hoffman et al., (1995) to add product and policy failures.
Furthermore Johnston (1994) classified sources of failure as attributable to the organisation or the customers; Armistead et al., (1995) suggested three types of failure – service provide error, customer error, or associated organisational error (e.g. air-traffic controllers on strike).
The consequences of service failure include: • Dissatisfaction (Kelley et al., 1993)
• A decline in customer confidence (Boshoff, 1997; Boshoff and Leong, 1998);
• Negative word-of-mouth behaviour (Bailey, 1994; Mattila, 2001);
• Customer defection (Keaveney, 1995; Millet et al., 2000);
• Loss of revenue and increased costs (Armistead et al., 1995); and • A decrease in employee morale and performance (Bitner et al., 1994)
1.7.3. Service recovery
It is those actions implemented to solve the occurring problems, to adjust negative attitudes of dissatisfied customers with the scope however to maintain these customers. (Miller et al., 2000, p.38). According to Smith et al., 1999 it involves situations whereas service failures take place but no complaint is being reported by the customers (p.359).
10
same time that the term “seeking out” differentiates recovery from complaint handling as many dissatisfied customers have the tendency not to complain directly.
A successful service recovery has important benefits such as the improvement of customer’s perceptions regarding the quality of the service offered which eventually can be lead to a positive word-of-mouth (Lewis and McCann, 2004).
It can also enhance customer’s satisfaction and create stronger bonds on customer relationships, loyalty and have an impact on profits (Bitner et al., 1990; Hart et al., 1990; Spreng et al., 1995; Michel, 2001). Although the extent of success may well be depend on the type of service (Mattila, 2001) or the type of failure (McDougall and Levesque, 1999) and the speed of response (Boshoff, 1997)
1.8 Thesis Outline
11
CHAPTER 2
LITERATURE REVIEW
2.1 Introduction
In the previous Chapter 1 there was a summary of the underlying principles and aims of this research. This chapter will present a literature review related to the topic area together with an initial statement of the proposed hypotheses study.
2.2 Aims and objectives
The aim of this chapter is to provide a wide review of three fundamentals concepts related with the research and that are the service quality, service failure and service recovery. Additionally through this in-depth analysis the aim is to reveal the existing situation of service failure and recovery rates in the airline industry and how this can be alleviated.
The objective is to reveal the existing situation in those three concepts and to reveal any gap that will emphasize more the need for research justification of this current study.
At the beginning the literature review starts with service quality and its existing concepts, definitions and related aspects. It follows a wide review of which particular service quality models exist and which ones are more capable for the airline industry. Further the review proceeds to servicefailure, where the main focus is on the connection of service failure with customer satisfaction and what conceptual models evolved, which ones prevailed, which the discredited ones are and how the existing situation in research is linked with the suggested research thesis. It then proceeds to the literature review of the service recovery. Finally the chapter closes with the proposed hypotheses study.
2.3 Service Quality
12
regarding an entity’s excellence (Bitner and Hubbert 1994; Boulding et al. 1993; Cronin and Taylor 1992; Parasuraman, Zeithaml, and Berry 1985, 1988). If the expectation is higher than perception then the service will be regarded as bad, if it is equal the service will be labelled as good and if it is lower than perception the service will be considered as an excellent one.
Additionally service quality can be defined as the consumer’s judgment about the supremacy of a service (Zeithaml 1987). Unlike to quality of goods which can be measured objectively by certain pointers such as number of defects, durability (Crosby 1979; Garvin 1983; Hjorth-Anderson 1984;), the service quality has been built on three points unique to services: intangibility, heterogeneity and inseparability of production and consumption (Panasuraman, Zeithaml, and Berry 1985).
Furthermore customer satisfaction is a judgement of a particular product or service and those satisfied customers tend to be loyal customers and willing to spread positive word of mouth (Gibson, 2005). Having customer loyalty increases the profit for the company as keeping the existing customers is cheaper than finding new ones (Kotler and Armstrong, 2007). In order to retain that loyalty and repurchase intention an overall customer satisfaction is needed. Therefore it is crucial to identify which factors contribute to customer satisfaction in order to create and deliver service that entails them.
A substantial amount of research exist on service quality perceptions (Zeithaml, 2009, Ramsaran and Fowdar, 2007), with most of it to be concentrated on developing generic quality models (Parasuraman et al., 1985; Brady and Cronin 2001). Fairly few studies have concentrated on the development of context – specific service quality models (Dagger et al., 2007) regardless of the fact that service quality evaluations tend to be context dependent (Babakus and Boller 1992; Carman 1990; Dabholkar, Thorpe, and Rentz 1996).
13
final service but the whole production and delivery process before which entail employee involvement and commitment particularly in tourism services.
Grönroos (2007) emphasizes on the comparison between customer experience of the service and their initial expectation for it through a model called “Total perceived service quality”. Through this process he comes up with two service quality dimensions, the first one that mentions the outcome is the technical quality, and has to do with what is being delivered, and the second dimension is the functional quality which mentions the manner through which the service is being delivered and how. Both dimensions shape the overall quality perception of a service.
While the service quality concept was specified as a second-order factor (Grönroos 1984; Parasuraman, et al., 1988; Rust and Oliver 1994) later is being described as a third-order factor (Brady and Cronin 2001; Dabholkar, Thorpe, and Rentz 1996) which means that service quality consists of many primary dimensions (with sub dimensions also) that are segments of a common theme represented by the higher order global perceived service quality construct. Therefore the effort to modeling service quality identifies that evaluating service quality could be more complex than previous attempts (Dagger et al., 2007).
2.3.1 Linkage of service quality with satisfaction
Service quality and satisfaction have a relationship which is based upon two different perspectives. In the first one it is the transaction perspective in which satisfaction is reflected as an antecedent of a worldwide appraisal of perceived service quality. Here the perceived quality is being built on a gathering of transaction-specific satisfaction judgements to create a wider worldwide evaluation of service quality (Mohr and Bitner 1995)
In the second one service quality leads towards a more sensitive, a more emotional satisfaction concept (Brady and Robertson 2001; Cronin and Taylor 1992; Gotlieb, Grewal, and Brown 1994).
Conclusions that relate to those two different perspectives vary. Research on the one hand for instance has shown an indirect link among service quality and intentions through satisfaction (Cronin and Taylor 1992; Dabholkar, Shepherd, and Thorpe 2000; Gotlieb, Grewal, and Brown 1994). On the other hand it has shown a direct link among these concepts (Cronin, Brady, and Hult 2000).
14
2.3.2 Linkage of Service Failure (SF) and Service Recovery (SR)
Service quality has been linked with service failure (SF) and service recovery (SR). It has been argued from service quality researchers that because of the distinguished nature of services it cannot be in most cases an error-free service (Fisk, Brown, & Bitner, 1993; Sparks & Bradley, 1997). Therefore increased focus has been given to the recovery part of the service (Chung & Hoffman, 1998; Smith & Bolton, 1998; Sparks & Bradley, 1997; Sundaram, Jurowski, & Webster, 1997; Tax, Brown, & Chandrashekaran, 1998).
The linkage of customer satisfaction (CS) with service quality (SQ) has to be pointed out. The question is if customer satisfaction (CS) is an antecedent or consequence of service quality (SQ).
According to Oh (1999) there are no universally agreed definitions for SQ and CS as there is a situation for constant debate between researchers.
For CS it can be referred as the transaction-specific assessment of a consumption experience. Here the disconfirmation model (Oh & Parks, 1997) can be fit in which says that the CS judgements are the evaluations result of expectation against performance (Oliver, 1980, 1993).
For SQ it can be referred as an expectation-performance gap of the consumer – provider encounter (Parasuraman, Zeithaml, & Berry, 1994).
Cronin and Taylor (1992) stated a correlation among CS and SQ of .8175 and McCollough (1995) stated another one ranging from .8208 to .7501.
The suggestion of CS being an antecedent or a result of SQ is also unclear. According to Cronin and Taylor (1992) even though they argued that CS would point out towards SQ at the end they found the opposite.
Parasuraman Zeithaml and Berry (1994) pointed out SQ can actually be an antecedent and not a consequence of CS. On the other hand Oh (1999) argued that SQ was an antecedent of CS. Therefore the difference and causal relationship among CS and SQ still remains unclear.
2.3.3 Service quality models
15
others not so (Ling, Lin and Lu, 2005). Below are listed and described those six models.
2.3.4 Nordic Model
Grönroos (1984) defined service quality through the outcome that customers will obtain and the process related with it (figure 1). It includes 3 dimensions: Image, Technical quality and Functional quality. The third dimension, the Image of the service provider, moderates both the Technical and the Functional quality which accompanied also with additional factors such as word of mouth, marketing communication, tradition, customer needs and pricing. This moderation takes place in order to reach a perceived level of service (Grönroos 1988).
For Grönroos Technical quality is referred to the “mere technical outcome of the production process that corresponds to the instrumental performance of the service” (Grönroos, 1984 p.38). If it is a hotel guest will need a room and a bed, if it is a restaurant it will be a meal, an air traveller will be the process of transportation from one place to another. This technical outcome i.e., what the consumer receives as a result through the interaction he/she has with a service firm can be called the technical quality dimension. It is very important to the consumer’s evaluation for the quality of the service as he/she can often be measured it objectively as any technical dimension of a product (Grönroos, 1984).
Technical Quality
Functional Quality
Perceived Service Quality Perceived Service Quality
Expected Service
Image
Word-of-mouth
Marketing Communication
Customer needs
Tradition / Pricing
[image:24.595.67.498.325.542.2]How? What?
16
The other dimension that Grönroos introduced was the Functional quality and that is due to the fact that through the service interaction that the customer has the technical quality dimension will not be determine the total quality that the consumer receives but rather it will be influenced by the way that is being transferred to the customer functionally (e.g. waiter behaviour in a restaurant, or business consultant on a meeting, or bus driver in a bus etc). Therefore “the consumer is not only being interested in what he receives as an outcome of the production process, but in the process itself”. (Grönroos, 1984, p.39) This quality dimension can be called Functional quality as it “corresponds to the expressive performance of a service” (Grönroos, 1984, p.39).
Overall the Technical quality dimension answers the question of what the customer gets and Functional quality dimension answers the question of how the customer gets it. Clearly the Functional quality dimension cannot be evaluated as objectively as the Technical dimension. As a matter of fact the functional dimension is perceived in a very subjective way (The customer makes its final judgement regarding the service quality on a bundle of service dimensions (Grönroos, 1984, p.39).
Grönroos showed that both Technical and Functional quality are interrelated, however he argued that the quality of the service was more significant to the Functional quality and that the staff performance in direct contact with customers can compensate for a lower Technical quality (Grönroos, 1990). This Nordic model was the first one that tried to measure service quality through comparativeness of the “expected” and the “perceived” service offered (Ghotbabadi et al., 2012).
Update of this model could have been considered the “Three-Component model” from Rust and Oliver (1994) when they conceptualized the measurement of service quality as customers’ perception regarding an organisation’s service product (technical quality), service delivery (functional quality) and service environment. Those were the three items that were suggested (Figure 2.2).
Service Product
Service Delivery
Service Environment Service
Quality
17
This model has been supported and has been employed to measure retail banking service quality without however test their model hence lacks of further support as it was giving only generalized picture of service quality without including details of it (Ghotbabadi et al., 2012; Chaipoopirutana, S., 2008). Additionally it was not including the service encounter and service tangibles that could create more specific details about the service quality perception of the customer (Chaipoopirutana, S., 2008).
2.3.5 SERVQUAL model
[image:26.595.153.489.358.706.2]The Nordic model introduced two dimensions (Technical and Functional) quality which was not sufficient enough to identify customer’s perception of service quality. Parasuraman, Berry and Zeithaml (1985) expanded further the Nordic model by concentrating on the discrepancy between customer expectation and perception through the creation of the Gaps Model of Service Quality or otherwise called SERVQUAL model. This model has 5 dimensions (Figures 2.3 and 2.4).
18
The core basis of this model is the gaps1-4 while the gap 5 reveals the discrepancy among consumer expectation and perception (Figure 1). This model was designed to measure the gap between expected and delivered service (Zeithaml, Panasuraman and Berry, 1990).
Efficient planning procedures/Better management commitment/ Clear service design/Systematic new development process
Better Marketing Research/better information for audience’s expectation/Focus on demand quality/Reduce layers between front line personnel and top management
Between service quality specification..
...To the delivery of service
Gap 3 Reduce it by:
Reduce it by:
Gap 2
Management perception (of the customer experience)
Actual specification of the customer
experience
Auditing customer experience has to take place by the managers to ensure that their organisation is up to the specifications.
Making less over-promising to customers in external communication campaigns / Improve management of customer expectations / Improve performance specifications Between service
delivery…
…and external communication
(to customers)
Between expected
service… …and experienced service
Gap 4
Gap 5 Reduce it by:
Reduce it by:
Reduce it by:
Better service quality / Make frequent surveys to measure the customer perception of service.
Gap 1
What customers expect
What managers think they expect
PERCEPTION 5 GAPS EXPECTATION
19
According to Panasuraman et al., (1985) that gap included a double administration of 22 dimensions instrument and a scale of initially ten characteristics of service quality which by the early nineties was reduced to five (RATER).
Those five consist of:
These five characteristics are being described as follows:
Reliability: The capability of performing the required service dependably, accurately and consistently;
Assurance: The knowledge background of employees, their courtesy and skill to express trust and confidence;
Tangibles: The existing equipment, facilities and the personnel appearance;
Empathy: The consideration of the customers individually under caring and helpful conditions;
Responsiveness: The enthusiasm to offer service on time and assist customers;
Figure 2.5 - The RATER characteristics (Zeithaml, Panasuraman and Berry, 1988) Perceived
Service
Expected
Service
Reliability Communication
Responsiveness Credibility
Competence Security
Access Tangibles
Courtesy Understanding
the customer
Reliability Assurance Tangibles Empathy Responsiveness
Or called RATER
(Abbreviation)
1985 1988
Reliability Assurance Tangibles Empathy Responsiveness
Perceived
Service
20
Parasuraman et al., (1985) classified the differences among Expected Service (ES) and Perceived Service (PS) through a “PS-ES framework measurement”. According to him if the expectation of service quality is lower than the perceive service (PS>ES) it means that there is customer satisfaction. If both are equal (PS = ES) it means customer’s mere satisfaction. If expectation of service quality is higher that perceived service (PS<ES) it means that there is customer dissatisfaction.
The complication of evaluating service quality can be reflected through the various failed efforts to reproduce the dimensional structure of service quality perception (Ghotbabadi et al., 2012). The application of the SERVQUAL model shows an integrated view among the customer – company relationship. The major point of this model emphasize on the point that service quality depends on the size and direction of the five gaps that were identified in the service delivery procedure. The SERVQUAL model is still being considered by many as a capable measuring tool applicable to a numerous of service industries (Nyeck, Morales, Ladhari & Pons, 2002;Ghotbabadi et al., 2012). Even though this approach has been criticized heavily (e.g. Matzler’s (2002) view that the SERVQUAL model needs to be revised), still this view was regarded and to some extent still is for many the traditionally concept of service excellence based on customer perceptions (Nyeck, Morales, Ladhari & Pons, 2002; Ghotbabadi et al., 2012).
However, Babakus and Boller (1992) argued that the expectations measurement does not provided enough information from what is gained if the service perceptions measured alone, something which is similar with the findings of Dabholkar et al., (2000). Additionally Cronin and Taylor (1992) and later Brady and Cronin (2001) when studied the service quality model they focused only on perceptions rather than expectations. This model can assist in identifying the gaps that exist among variables that influence the quality of service (Seth, Deshmukh and Vrat, 2005). Through years there are inconsistencies in the SERVQUAL factors as it is not comprehensive for different applications (Dabholkar, et al., 1996; Shahin and Samea, 2010).
2.3.6 Critique of the SERVQUAL model
21
to its ill-judged implementation of the disconfirmation model which stems its force from the disconfirmation paradigm (Cronin & Taylor, 1992, 1994). Cronin and Taylor (1992) argued that the concept and operationalization of service quality (SERVQUAL) are inadequate measures among the relationship of customer satisfaction – service quality – purchase intentions. They made an analysis and tested a performance based model based on the SERVQUAL measurements and what they found is that there is significance in service quality (SERVQUAL) effects in two industries (banking and fast food) out of four (banking, pest control, dry cleaning and fast food).
Through this paradigm the customers assess an offered service by comparing their expectations with their perceptions (Robledo, 2001). The SERVQUAL’s five dimensions together with the 22 item scales have a problematic application in the airline industry due to the fact that this scale has not included additional and quite significant characteristics of the airline service quality such as food during the flight, seat space, comfort and leg room (Park et al., 2006).
There are other researchers who put the SERVQUAL model under direct doubt among which is Francis Buttle (1996) who enlisted a number of critics of the model that had been made in both theoretical and operational terms.
In theoretical terms Buttle (1996) came with the argument that the model’s five dimensions are not universal and that the model is unsuccessful in terms of economic, statistical and psychological theory. There is small amount of evidence that customers assess the service quality in terms of the five mentioned gaps of ‘Perception’ and ‘Expectation’. The SERVQUAL model focuses on the process of service rather than the results of the service encounter and there is a difficulty of its mentioned five dimensions to be replicated in varied service circumstances (Buttle, 1996). In addition to that Brown, Churchill, and Peter (1993) found the appliance of SERVQUAL’s five dimensions appliance on service quality to be one-dimensional.
22
In operational terms Buttle found that the SERVQUAL model fails to measure the absolute service quality expectation whereas customer’s feedback of service quality may be different from one moment of truth to another (Buttle, 1996). Each service quality dimensions are multilayered and cannot capture the whole variability even if there are five different quality dimensions in total in this model.
There is also difference in each customer’s feedback as at one moment of truth the feedback differs when compared with another moment of truth from the same person. It also showed that the seven-point Likert’s scale is flawed while the double administration of the instrument creates confusion to the customer. Therefore, the SERVQUAL model has both conceptual and empirical flaws. Conceptually, there is a gap of the perceived service quality during operations, an uncertainty of the expectations concept and the inappropriateness of using only one measure of service quality for a diverse range of businesses. Empirically, the use of different scores when calculating SERVQUAL creates unreliable results (Van Dyke, Kappelman and Prybutok 1997).
These results indicate that the SERVQUAL model should be used with caution and further research is necessary to achieve more accurate service quality measurement. Many other researchers have serious doubts about the 22 variables that are used in the instrument concept and the psychometric properties that are being accompanied in the SERVQUAL scale (Carman, 1990, Babakus and Boller, 1992; Brown et al., 1993; Peter, Churchill and Brown, 1993; Teas, 1993; 1994; Lam and Woo, 1997). It appears that the instrument has a generic base which might not be suitable for measuring several service sectors according to Finn and Lamb (1991), suggesting further adaptation of the 22 instrument items. Another group of researchers suggested that the customisation of the instrument has to take place by including additional related questions (Carman, 1990; Babakus and Boller, 1992; Brown et al., 1993).
In the literature a series of problems that arise from the SERVQUAL model have been discussed (Babakus and Boller 1992; Carman 1990; Cronin and Taylor 1992, 1994; Teas 1993). The findings of measuring service quality indicate that SERVQUAL undergoes both conceptual and empirical complications.
On the conceptual part there is a gap of the perceived service quality during operations, an uncertainty of the expectations concept and the inappropriateness of using only one measure of service quality to all the diverse businesses(Van Dyke, Kappelman and Prybutok 1997).
23
Kappelman and Prybutok 1997). These results indicate that further caution has to take place with the SERVQUAL model usage, and additional work is necessary for more accurate quality of information of service measurement.
The critique continues as Chan et al. (2003) states that in SERVQUAL’s dual nature (“instrument’’ and “five dimensions”), the “instrument” does not have established psychometric properties (Chan et al. 2003). Babakus and Mangold (1992), Carman (1990) and Orwing et al., (1997) came to the conclusion that the SERVQUAL’s five dimensions (RATER) are actually only one dimension instead of five. That means that it cannot depict the whole picture of service quality perception of the customer.
Cronin and Taylor (1992) have indicated that the usage of different score in the SERVQUAL measure (expectation of service quality minus perception of service quality) can result in customer’s exaggerated expectations due to possible previous bad incident(s) with the organisation. They further doubted whether the SERVQUAL model is valid and they suggested different models. Alternatively they indicated usage of either the perception scale or the expected scale but not the difference between them (Cronin and Taylor, 1994).
The approach that the SERVQUAL model used at first was based on four different scores. These were the importance score (on customer’s service priorities), the expectation score (on customer’s service expectation), the perception score (on customer’s acceptance that something was provided) and the gap score (difference between customer expectation score and customer perception score). Kaldenberg et al., (1997) argued that this form was problematic. The questionnaire was excessively long, there were unreliable results on gap scores and neither the expectation nor importance score added considerably in explaining the differences in service quality (Cronin and Taylor, 1992). To a certain extent it was the critique of Buttle (1996) and later of Matzler (2004) that suggested a major revision of the SERVQUAL model.
2.3.7 SERVPERF model
While SERVQUAL remains a respectable measurement for a number of industries, Dabholkar et al., (1996) argued that this model is not appropriate for the retail industry. Several other debates of researchers stated that there are different applications in which SERVQUAL model is not comprehensive (Brady& Cronin, 2001a; Dabholkar et al.,1996; Shahin & Samea, 2010).
24
and the performance of the service was the only measurement for service quality (Ghotbabadi et al., 2015). By researching service quality relationship with customers’ satisfaction and purchase intention, they argued that service quality is an antecedent of customer satisfaction. Therefore they suggested a new model where they replaced the Expectation factor with Performance as they considered that Performance is the only measurement for service quality, called this model SERVPERF.
This model measures service quality on the basis of customer perception in relation to the performance offered by the service provider (Cronin and Taylor, 1994). As explained above (2nd paragraph of SERVQUAL Critique) Cronin and Taylor (1992) found inconsistent measures between Perception and Expectation that the SERVQUAL model entails particularly for the retail industry.
They continued (Cronin and Taylor) in 1992, like Parasuraman’s SERVQUAL model to measure performance with the same dimensions as SERVQUAL model did (Reliability – Assurance – Tangibles – Empathy – Responsiveness) except of the Expectation – Perception difference.
PERCEPTION EXPECTATION
PERFORMANCE
Therefore based on the SERVQUAL model they replace the Expectation with Performance and the tests they did in all four industries (banking, pest control, dry cleaning and fast food) proved valid as there is adequate measurement of consumer’s perception through this model (Chaipoopirutana, 2008). Additionally there was found that SERVPERF had more accurate measurement in relation to SERVQUAL (Cronin & Taylor, 1994; Seth et al., 2005).
25
underlying passengers’ perception of quality in the airline industry. Therefore as mentioned above this model is not considered valid for the airline industry.
2.3.8 Multilevel model
Apart from the redesigned version of the SERVQUAL that Cronin and Taylor did in 1992 ending up with the SERVPERF model, further inconsistencies that the SERVQUAL model entailed led in 1996 Dabholkar, Thorpe and Rentz to suggest the multilevel model for service quality.
Even though the SERVQUAL model had validity in testing several service sectors (e.g., banking, telephone service, credit card service) there were no adaptation for the retail store environment (Dabholkar et al., 1996). This proposal based on the SERVQUAL and SERVPERF models involved changes in the structure of service quality in order to become a three-stage model: “overall perception” of service quality, “primary dimensions” and “sub dimensions” (Figure 1). Although this proposal involved a new structure still the model had to generalize for dissimilar areas and had to take under consideration some additional factors such as environment and price. (Ghotbabadi et al., 2012). Further there was no attributes found that defined sub dimensions. For the construct validity of the model there was only measurement of the customer perception to avoid psychometric problems with different scores (Ghotbabadi et al., 2015).
The model construction and factors involved have as a basis the disconfirmation way to define the gaps in service quality. As far as concerning validity this model has an improved structure with more detailed factors. Nevertheless it needs further evidence to make it applicable to other industries of the service sector (Ghotbabadi et al., 2015). Some researchers in later years tested and suggested some development for this model in other industries apart the retail one. No evidence was found about the usage of this model in the airline industry.
Figure 2.6 – The Multilevel model (Dabholkar, Thorpe and Rentz, 1996) Retail Service
Quality
Primary Dimensions
Sub Dimensions
Physical
Aspects Reliability
Personal
Interaction Policy
Problem Solving
Courteous Helpful Inspiring
Confidence
Doing it Right Promises
Convenien ce Appearan
26
2.3.9 SERVPEX model
This model has been identified as the measurement scale to describe the airline service quality (Ling, Lin and Lu, 2005). This proposal measurement includes perceptions and expectations into a single scale with the range to be varied from much worse than expected to much better than expected.
PERCEPTION
+
PERFORMANCEEXPECTATION
Robledo (2001) argues that SERVPEX measure disconfirmation in a single questionnaire and includes three dimensions: tangibles, reliability and customer care. Lu and Ling (2008) argue that through this measurement it is better understandable for the passengers when they evaluate airline service quality based on their expectations and experiences.
The SERVPEX model in general is more advanced than the SERVQUAL and SERVPERF models particularly in its validity and reliability (Robledo, 2001). Through this measurement a better explanation is being provided regarding service quality in terms of its predictive validity (Wu, H.C., and Cheng,
C.C., 2013). It clarifies in a more advanced level the variation of the service quality variable in comparison to SERVQUAL and SERVPERF models according to Robledo’s study (Robledo, 2001). The reason is that in that study the predictive validity of it correlates each measurement scale separately with the three contrasted questions that are being used there (questions 27, 28 and 29) and also the study is using a fourth variable which is the mean of the three questions (Robledo, 2001). In this way the SERVPEX clearly performs better than the others because it explains in a higher proportion the variation of the service quality variable (Robledo, 2001).