e v al u a ti o n of s t r u c t u r e-b o r n e
s o u n d s o u r c e fo r c e-p o w e r t e s t
m e t h o d s
L ai, HK, M o o r h o u s e , AT a n d Gi b b s , B M
h t t p :// dx. d oi.o r g / 1 0 . 3 3 9 7 / 1/ 3 7 6 3 6 9
T i t l e Ex p e r i m e n t al r o u n d-r o b i n e v al u a tio n of s t r u c t u r e-b o r n e s o u n d s o u r c e fo r c e-p o w e r t e s t m e t h o d s
A u t h o r s L ai, H K, M o o r h o u s e , AT a n d Gi b b s , B M
Typ e Ar ticl e
U RL T hi s v e r si o n is a v ail a bl e a t :
h t t p :// u sir. s alfo r d . a c . u k /i d/ e p ri n t/ 3 9 2 5 5 /
P u b l i s h e d D a t e 2 0 1 6
U S IR is a d i gi t al c oll e c ti o n of t h e r e s e a r c h o u t p u t of t h e U n iv e r si ty of S alfo r d . W h e r e c o p y ri g h t p e r m i t s , f ull t e x t m a t e r i al h el d i n t h e r e p o si t o r y is m a d e f r e ely a v ail a bl e o nli n e a n d c a n b e r e a d , d o w nl o a d e d a n d c o pi e d fo r n o
n-c o m m e r n-ci al p r iv a t e s t u d y o r r e s e a r n-c h p u r p o s e s . Pl e a s e n-c h e n-c k t h e m a n u s n-c ri p t fo r a n y f u r t h e r c o p y ri g h t r e s t r i c ti o n s .
source force-power test methods
H. Kevin Laia)
Noise, Vibration and Emissions Engineering, Boeing Commercial Airplanes, Seattle, USA
Andy Moorhouseb)
Acoustics Research Centre, University of Salford, UK
Barry Gibbsc)
Acoustics Research Unit, School of Architecture, University of Liverpool, UK
ABSTRACT
The determination of the structure-borne noise from operational equipment in airplanes is a
complex process that requires much source and receiver component information in the analysis.
Different test setups and instrumentation usually are required to obtain these quantities separately;
for example, free velocity, blocked force, source and receiver mobilities, isolator properties and
transmitted power. A previously proposed approach, combining the inverse force method (IFM)
and the reception plate method (RPM), and enabling dual force-power measurement from a single
test platform, was demonstrated in laboratory tests. This paper reports on the measurement
variations of blocked force and transmitted power from the integrated test setup. To gauge the
practicality and readiness of the test methods, an experimental round-robin evaluation was
arranged and coordinated with four industrial participants. The same source was used in the round
robin evaluation with controlled mounting details, in order to investigate the source installation
sensitivity. In general, good agreements were observed between powers obtained by the two
methods from data acquired at each test site; larger variations were observed in measurement
across test sites. Work continues to determine the test method uncertainty; however, both test
methods are considered acceptable and ready for wider industry applications.
1 INTRODUCTION
In modern airplane development, more lightweight structures and high performance systems
(mechanical/hydraulic/electrical equipment) are utilized to achieve higher fuel efficiency, better
flight characteristics, and better passenger and crew comfort. The structure-borne noise (SBN)
from onboard system operations has been identified as a major source of airplane interior noise,
impacting flight deck pilot communication, noise exposure to crew members, and general
passenger comfort.
Equipment noise characterisation is an important part of specifying the airplane interior noise
level requirement. In addition, it is an essential component for modelling and testing at various
development stages, in order to minimize weight of required noise and vibration treatments.
The airplane SBN analysis process comprises two main steps: (1) characterizing the input
from a vibration source to the airplane structure and (2) determining the vibration propagation and
structural acoustic radiation in the airplane. The second step usually requires some form of transfer
path analysis, either by in situ measurement or by modelling, using, as examples, the Finite
Element Method (FEM) and/or Statistical Energy Analysis (SEA). Both approaches require SBN
inputs from Step (1) in terms of vibration force, velocity, or power. The focus of this paper is to
evaluate an integrated test approach for measuring both blocked force and transmitted power.
When removed from the installed situation, the equipment under test can be characterised by
the blocked force (which is interchangeable with free vibration velocity if the source mobility is
can be used with available transfer functions measured from airplane ground tests, to obtain sound
pressure in the far field. When the equipment is installed in an airplane, its transmitted power will
vary with the supporting structural element at various locations. In the absence of information of
the support structure’s impedance, the transmitted power, combined with force and velocity
information at the contacts of the installed equipment gives the most complete input information
for noise analysis. Moreover, most equipment systems are developed by suppliers in parallel
with airplane development, and the availability of equipment SBN inputs from suppliers becomes
more important before final airplane integration. A force-power SBN measurement test approach,
combining the Reception Plate Method (RPM) 1 and the Inverse Force Method (IFM) 2 has been demonstrated to provide both SBN data previously 3-5. This paper describes a development of this work, which involved the participation of industrial parties in a round robin, to evaluate the test
method experimentally and collect feedback from an industrial perspective.
2 SBN FORCE-POWER TEST METHOD OVERVIEW
2.1 Inverse Force Method (IFM)
For an ideal point vibration source, its blocked force can be directly measured with a rigid
boundary condition or obtained from its free source velocity
v
fs and source mobilityY
S indirectly.Consider a source mounted on a non-rigid receiver through one contact and through one degree of
freedom, giving a force perpendicular to the receiving structure of mobility
Y
R. The source blockedforce can be inversely obtained from the contact point velocity
v
c
v
fsY
R
Y
S
Y
R
and thesource-receiver coupled mobility
Y
C expressed in terms ofY
S and YR (i.e.1 1
1
R S C
Y
Y
blocked force thus can be obtained for any receiver mobility, rather than for the normally required
very low receiver mobility (the ‘inert’ receiver structure). This is given in Eq. (1).
C c R S S R R S fs R S fs bl Y v Y Y Y Y Y Y v Y Y v f . (.)
By extending the single point expression to the multi-point and multi-DOF (degree of freedom)
situation, e.g., a pump mounted at 4 points with three translational and three rotational components,
the source blocked force can be obtained in terms of vectors and matrices given in Eq. (2):
Y
v
Y
Y Y
Y
vc
Y
vcfbl A,cc 1 fs B,cc A,cc B,cc 1 A,cc 1 C,cc 1 , (.)
where A is the source, B the receiver, and C the coupled structure; c is the index of DOFs at the
A-B contact interface, and the subscript -1 denotes the matrix inversion.
If perpendicular forces only are considered, Eq. (2) offers an indirect two-step approach to
measurement of the associated source blocked force in situ, by measuring (1) the source-receiver
coupled mobility
Y
C,cc without the source in operation, and (2) the source operational vibrationvelocities
v
c at all mount points. However, the practical implementation of the approach may belimited by the
Y
C,ccmeasurement, when the contact points are inaccessible.Reciprocity is utilized to overcome the implementation / instrumentation challenge. The
velocities at the contacts
v
c can be obtained by measuring velocities away from the contact points,b
v
, with the transfer mobility matrix of the receiver between the contact points and the remotepoints, as:
1v Y Y
By substituting Eq. (3) into Eq. (2), the cluster of source and receiver mobility terms can be greatly
simplified into the single transfer mobility term of the coupled system 1:
bT cb C, bl Y v
f 1 . (.)
The superscript T is the matrix transpose, and the subscript cb in the coupled transfer mobility
cb C,
Y
indicates excitations applied at b (m accessible points on the receiver structure) andresponses measured at c(n DOFs at equipment mount points,nm).
The revised Equation (4) offers an improved test method for situations when the equipment
mounting points are not accessible to an instrumented impact hammer, required for the couple
mobility
Y
C,cb. With a sufficient number of excitations on the receiver (nm), not only canover-determination reduce the matrix inversion error, but it also enables integration with the Reception
Plate Method (RPM) for measuring the transmitted power and other additional structure-borne
quantities.
2.2 Reception Plate Method (RPM)
The concept of the reception plate method is based on the power balance principle. On a
reception plate, the transmitted power from a vibration source into the plate is equal to the power
dissipated by the plate, which can be estimated from the plate’s total energy and loss factor η. For
resiliently mounted equipment, the vibration energy output from the source is mostly transmitted
into reception plate flexural vibrations with the total plate energy being twice its kinetic energy.
Therefore, the transmitted power from the vibration source can be approximated by:
2
b dissipated
input m v
m is the plate total mass, ω the angular frequency, and vb2 the reception plate
spatially-averaged vibration velocity power spectrum, which can be measured with p points within the plate
reverberant region,
p
i bi
b v
p v
1 2
2 1
. (.)
When the measured structure-borne noise power is expressed in octave or in 1/3-octave frequency
band, vb2 is integrated over the frequency band and ω is the center frequency of the band. The
measurement uncertainty of the reception plate method depends on the accuracy of vb2 and it
can be improved either by averaging over a larger numbers of measurement points or by optimizing
measuring point selection. However, this measurement variation is difficult to validate, and thus
provides the motivation to integrate the RPM with the inverse force method.
It should be noted that because the transmitted power from a vibration source varies with
location, i.e. with supporting structure, care should be taken when applying the measured power
by the reception plate method for intended purposes. For applications like an equipment
structure-borne noise source ranking or benchmarking, the reception plate method can greatly reduce the
testing effort with only plate vibration measurements required.
2.3 Force-Power Integration Test Setup
The development of a test setup, integrating the inverse force method on a reception plate,
was driven by the need for both structure-borne force and power measurements, and by the reduced
can be used as a general test platform for equipment designed to be installed on plate-like
structures.
The measurement effort and instrumentation, in the integrated test setup, is reduced
significantly. For example, the response velocity
v
b , measured by the same set of accelerometers,can be used for both force and power calculations, described in Equations (4) and (6). The
frequency response functions, from IFM mobility measurements, also can be used for the loss
factor calculation with the impulse response decay method.
In addition to the blocked force by IFM and power by RPM, other SBN quantities can also
be obtained with a simple pre-test step on the reception plate. Similar to Eq. (3), the forces at the
contacts
f
c can be obtained with the transfer mobilityY
B,bc of the reception plate measuredduring the loss factor impact testing as shown in the following,
B,bc bc Y v
f 1 . (.)
By combining
f
c with the contact velocitiesv
c, the transmitted power is obtained,c
c
v
f
. (.)The two independent measurements by the two test methods, Eq. (5) and Eq. (8), of the same
vibration source power also provide a useful self-check of quality.
3 ROUND ROBIN EVALUATION
In order to evaluate the practicality and measurement variation of the test setup and test
methods under typical industrial conditions, an experimental round robin evaluation was designed
facility with the same tested source, to minimize measurement variations due to hardware
differences.
3.1 TEST HARDWARE AND INSTRUMENTATION
The selected SBN source was an off-the-shelf commercial constant-speed air pump which
was shipped from one test site to the next during the round robin evaluation. Each test site (labeled
Test Site #1, #2, #3 and #4) procured or fabricated a stainless steel reception plate with dimensions
38.0 in by 54.0 inches by 3/16 inches (965.2 mm by 1371.6 mm by 4.8 mm). The plates, of
approximate weight of 48.5 kg, were supported by visco-elastic damping strips along four edges
on a support stand. Accelerometers were mounted under the plate but marked on the plate upper
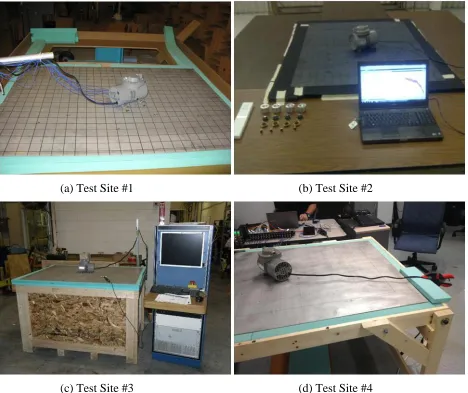
surface to improve the excitation-response alignment for the impact hammer test. The test setups
at the four test facilities are shown in Figure 1.
While each test site followed the same guidelines on setting up the test rig and
instrumentation, the pump source was allowed to be installed at different positions and orientations
with respect to the plate geometry and measured with different numbers of accelerometers at
different locations. The purpose was to evaluate the measurement variations due to these
installation differences and the sensitivity of the two test methods, with respect to the
source-receiver coupled structures.
3.2 TEST PROCEDURES
All test participants were instructed to follow test standards as much as possible: ISO 5348 7 on vibration accelerometer mounting, ISO 16063-21 8 on accelerometer calibration and ISO
Pre-Test
Prior to mounting the test source onto the test stand, a pre-test was conducted to finalize
measurement locations and check the data acquisition system for measurement of the loss factor
of the reception plate using an impact hammer. The measured loss factor was little affected by the
source contact condition, including with no source attached (see Figure 2), and need only be
measured once, prior to test. During the loss factor measurement, the plate mobility
Y
B,bc,required to calculate the contact force
f
c in Eq. (7), was also obtained from the subset of acquiredfrequency response functions.
Step-One
After the pre-test, with the reception plate loss factor and plate mobility recorded, the source
was then attached the reception plate, and the impact hammer measurement of the source-receiver
coupled mobility
Y
C,cbperformed with the source turned off (i.e., the power off condition). Thistest step is similar to the pre-test step, except with the source installed on the plate and actually
requires fewer impacting points.
Step-Two
The pump was operated at controlled specified conditions, and the response velocities
recorded at the accelerometer locations remote from the source,
v
b and at the source mount pointsc
v
. With the loss factor available, only the measured plate velocityv
bis required for theAlthough the test procedure comprises three steps, the procedure is quite straight forward.
However, the importance of measurement location, selection and data channel indexing, before
test, is emphasized. A well thought-out plan can significantly increase the test efficiency, reduce
required instrumentation, and improve measurement accuracy3.
4 TEST RESULTS AND MEASUREMENT VARIATIONS
There were four source mounting configurations for the round robin evaluation: the air pump
rigidly mounted on the plate, and resiliently mounted with three different sets of vibration isolators.
The measurement variation analysis reported in this paper is based on the mounting configuration
without isolator at all test sites, with one data set (Test Site #1) selected to show the comparison
on the transmitted power with and without isolators, obtained by the two methods. The selected
quantities for variation analysis are: loss factor, source contact vibration velocity, blocked force,
and transmitted powers by both IFM and RPM. Data at all sites were acquired from 0 to 10,000
Hz with 3 Hz resolution and were processed into 50 Hz to 8000 Hz in 1/3 octave bands. The
measurement standard deviations (STD) are calculated for each 1/3 octave band with data from all
test sites listed in Table 1. All measured quantities are plotted, including the mean values with +/-
STD.
4.1 VARIATIONS DUE TO TEST SETUP AND SOURCE OPERATION
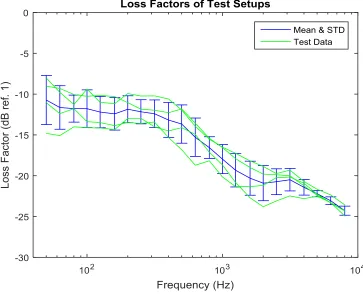
4.1.1 LOSS FACTOR
Various loss factor calculation methods were tried. The impulse response decay method was
the four test sites are presented on the dB scale (10log10) and plotted as the mean value and +/-
STD in Figure 3.
The differences in reception plate dimensions and plate material properties appear not to be
significant, compared to other factors in this round robin evaluation. Major variations in measured
loss factors were attributed to (1) types and amount of damping materials used to support the plate,
(2) test stands to support the reception plate, (3) differences in numbers of accelerometers, and (4)
excitation-response alignment consistency of the impact hammer testing.
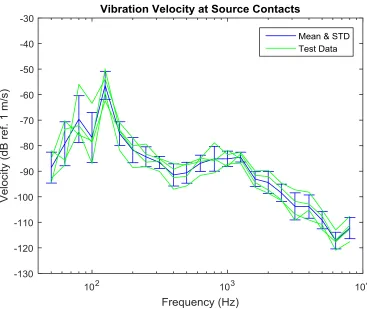
4.1.2 SOURCE OPERATION
Next measurement variation investigated was due to the air pump operation at all test sites,
which could be caused by hardware changes during transportation, handling and installation, or by
test environment differences in electrical power quality, temperature, humidity, etc. The source
contact velocity
v
c was selected as an indication of the pump performance, to indicate any damageor other change during the round-robin. Unfortunately, the contact velocity
v
c also includes thevariations due to the pump installation differences. The measured pump vibration velocity
(averaged from four mount points) is expressed in dB level (20log10 re 1 m/s), and plotted with
mean values in Figure 4.
4.2 BLOCKED FORCE AND TRANSMITTED POWERS
The target SBN quantities are the source blocked force and transmitted power. The blocked
force calculations were performed according to Eq. (4) with the same processing procedures and
parameters applied to data acquired from all test sites. The blocked forces at four mounting points
bands for each contact force, and then averaging the four site values. The blocked force is
expressed in dB level (20log10 re 1 Newton), and plotted with mean values in Figure 5.
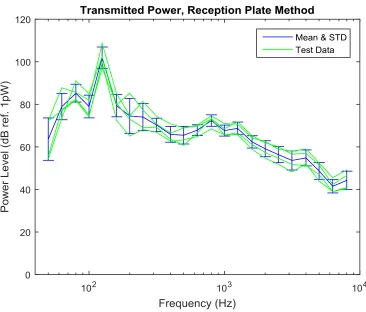
Two transmitted powers, measured by RPM and IFM, were calculated independently
according to Eq. (5) and (8), respectively, based on data acquired by different sets of
accelerometers in the same test. In RPM, the plate average velocity measured in narrow bands
was first integrated into 1/3 octave bands before combining with loss factor. The RPM transmitted
powers are expressed in dB level (10log10 re 1 picowatt) and plotted with mean values in Figure
6.
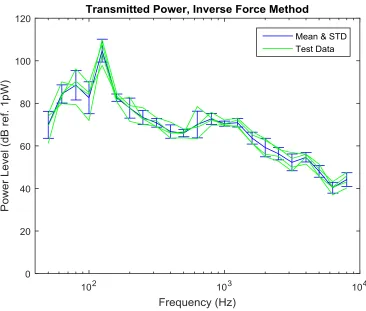
The calculation of IFM transmitted power requires more data processing: calculate the
transmitted force at each contact, multiply the force and velocity at each contact and sum them,
then integrate the narrow band data into 1/3 octave bands. Again, the IFM powers are expressed
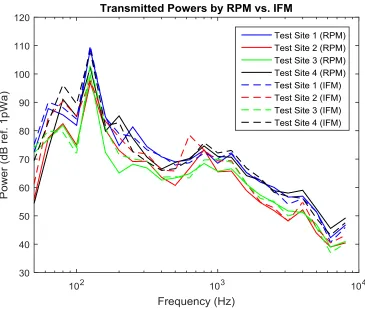
in dB level (10log10 re 1 picowatt) and plotted with mean values in Figure 7. To better illustrate
the overall variation in transmitted power measurements across the four test sites and the
consistency of the power measurements obtained by the two methods, all measured powers are
compared in Figure 8.
4.3 DISCUSSION
All STDs, listed in Table 1, are to compare variations of select measured quantities in each
1/3 octave frequency band, and provide an indication on the repeatability and reproducibility.
However, it is not immediately obvious which one quantity has a smaller variation than another
from Table 1. An overall estimate of measurement variation of selected quantities was to average
all 1/3 octave band STDs to simplify the comparison. Two averages over two frequency ranges,
The variation in the loss factor measurement is noticeably smaller than of the other quantities.
It is expected that the same reception plate, when mounted on two test stands and producing
different loss factors, will have different response velocity levels, i.e., higher velocities on the
lower loss factor stand and lower velocities on the higher loss factor stand. As a result, the
variation in the measured RPM power, contributed by the loss factor, should be smaller than the
STDs shown in both Table 1 and 2. The loss factor STD measured here is to provide a quantitative
indication on the variation to be expected from a reception plate test setup in typical industrial
facilities.
Although the sample size (four data sets) are not statistically sufficient to quantify the
difference of the two test methods, the averaged STDs in the blocked force and transmitted power
measured by IFM are slightly smaller than those by the RPM. Smaller STDs in IFM measurements
can be found in 1/3 octave bands. The blocked force measurements show a 8 dB range across the
four test sites, where power measurements show a range of 13 dB above 100 Hz, with most bands
within 10 dB. An early published study in structure borne sound source characterizing test
technique also reported a similar accuracy in their round robin test (+/- 5 dB in predicted
transmitted power) 6.
Based on data acquired from the same test setup, the agreement between transmitted powers
by RPM and IFM is about 3 dB in most 1/3-octave bands from all four test sites. One example
from Test Site #1 is shown in Figure 9.
5 CONCLUSIONS
For structure-borne noise, both source blocked force and transmitted power are needed in
models to predict equipment noise in the airplane crew and passenger spaces. The same processes
are also required to specify noise and vibration limits for equipment suppliers. Being able to
integrate the Inverse Force Method and the Reception Plate Methods on the same test setup has
the advantage of obtaining more SBN quantities more effectively than if the two tests were perform
separately.
In this round robin evaluation, with the same test source and similar test rigs, the variations
show that the SBN measurement is sensitive to structural changes of the test setup. When
applicable, the relatively simple structure of a reception plate can be an ideal test platform.
Tonal noise, at the fundamental frequency and higher harmonics of operating equipment,
often dominate the sound quality metrics and impacts the crew and passenger comfort. The
measurement variation in these frequency bands needs to be more carefully controlled. It is
necessary and possible to design a test setup with proper instrumentation and layout to improve
the measurement accuracy over the target frequency range accordingly.
Although combining the two methods on a single setup adds to the complexity to the test, with
a well thought-out plan the integrated rig can take the full advantage of the two methods and
provide more measurement quantities for less effort.
This round robin highlighted the practicality of integrating the two test methods and the
collaboration with the industrial participants provided feedback, helpful in identifying practical
issues, for the development of the test methods for wider industrial applications.
6 ACKNOWLEDGEMENTS
The round robin test was part of a collaboration project between Boeing Commercial
University of Liverpool and University of Salford. The authors would like to thank all participants
for their support and valuable feedback on this project.
7 REFERENCES
1. M.M. Späh, B.M. Gibbs, “Reception plate method for characterization of structure-borne sound sources in buildings: Installed power and sound pressure from laboratory data,” Applied Acoustics, 70, pp. 1431–1439, 2009.
2. A.T. Moorhouse, A.S. Elliot, T.A. Evans, “In Situ measurement of the blocked force of structure-borne sound sources,” Journal of Sound and Vibration, 325, pp. 679–685, 2009.
3. H.K. Lai, “Integrated reception-plate inverse-force test method for commercial airplane equipment structure-borne noise specification and qualification,” Inter-Noise 2012, New York City, NY, August 2012.
4. H.K. Lai, “An integrated reception-plate inverse-force structure-borne noise source characterization test method,” Acoustics Society of America 161st Meeting, Seattle WA, May 2011.
5. H.K. Lai, “Experimental comparison of test methods for structure-borne sound power measurement,” SAE International Noise and Vibration 2007 Conference, 2007-01-2169.
6. M. Ohlrich, L. Friis, S. Aatola, A. Lehtovaara, M. Martikainen, and O. Nuutila, “Round robin test of technique for characterizing the structure borne sound source strength of vibrating machines,” Proceedings of Euronoise 2006 Conference, Finland.
7. ISO 5348, 1998, Mechanical vibration and shock – Mechanical mounting of accelerometers.
8. ISO 16063-21, 2003, Methods for the calibration of vibration and shock transducers – Part 21: Vibration calibration by comparison to a reference transducer.
Table 1 - Standard deviations of measured SBN quantities in one-third octave bands.
1/3 Oct. Band Cntr. Freq. (Hz)
Loss Factor (dB re 1)
Source Velocity (dB re 1 m/s)
Blocked Force (dB re 1 N)
Power IFM (dB re 1 pW)
Power RPM (dB re 1 pW)
50 3.0 6.1 2.3 6.3 10.0
63 2.7 8.6 4.7 4.3 6.2
80 1.7 9.2 8.2 7.0 4.2
100 2.3 9.8 7.3 7.5 5.3
125 1.9 5.5 1.7 5.4 5.0
160 2.0 4.6 9.3 1.7 5.2
200 1.6 4.9 6.4 4.7 8.3
250 1.5 3.9 3.5 3.3 6.4
315 1.7 2.4 1.9 2.0 3.2
400 2.1 4.3 3.4 3.1 3.7
500 2.3 4.1 2.7 1.7 4.1
630 2.4 3.2 6.1 6.3 2.6
800 1.3 4.8 0.8 2.6 2.7
1000 1.8 3.0 2.3 1.2 2.6
1250 2.0 1.9 2.5 2.0 3.0
1600 2.1 2.9 3.1 2.8 2.9
2000 2.2 4.3 5.0 4.4 3.8
2500 1.6 3.4 2.9 2.9 3.8
3150 1.4 5.3 3.5 3.9 4.5
4000 1.0 4.6 1.9 2.2 3.8
5000 0.4 3.4 2.2 2.8 4.0
6300 0.5 3.3 0.9 2.5 3.1
8000 0.6 4.1 1.8 3.2 4.3
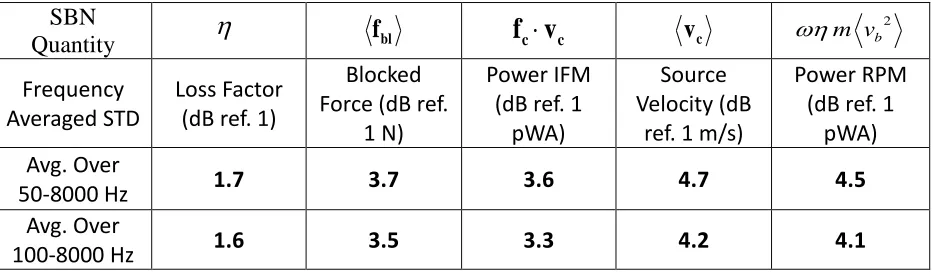
Table 2 – Frequency averaged standard deviations of measured SBN quantities.
SBN
Quantity
fblf
c
v
c vc2 b v m Frequency Averaged STD Loss Factor (dB ref. 1)
Blocked Force (dB ref.
1 N)
Power IFM (dB ref. 1
pWA)
Source Velocity (dB
ref. 1 m/s)
Power RPM (dB ref. 1
pWA) Avg. Over
50-8000 Hz 1.7 3.7 3.6 4.7 4.5
Avg. Over
[image:17.612.75.542.519.655.2](a) Test Site #1 (b) Test Site #2
(c) Test Site #3 (d) Test Site #4
[image:18.612.74.542.86.479.2]Fig. 2 - Loss factors of the reception plate, with and without the source installed, Test Site #1.
Fig. 3 - Loss factors of test setups at the four participant test sites, with means and standard deviations.
0.001 0.01 0.1 1
50 63 80
100 125 160 200 250 315 400 500 630 800 1000 1250 1600 2000 2500 3150 4000 5000 6300 8000
L
o
s
s
F
a
c
to
r
Frequency (Hz)
[image:19.612.90.511.73.335.2] [image:19.612.118.481.379.673.2]Fig. 9 - Transmitted powers measured at Test Site #1, by IFM and RPM, for the pump with and without vibration isolators..
102 103 104
0 20 40 60 80 100 120 Frequency (Hz) P o w e r L e v e l (d B r e f. 1 p W )
Test Site 1 Transmitted Power Measurements
[image:25.612.134.470.81.360.2]