R E S E A R C H
Open Access
Genome-wide promoter methylation analysis in
neuroblastoma identifies prognostic methylation
biomarkers
Anneleen Decock
1†, Maté Ongenaert
1†, Jasmien Hoebeeck
1,2, Katleen De Preter
1, Gert Van Peer
1,
Wim Van Criekinge
3,4,5, Ruth Ladenstein
6, Johannes H Schulte
7, Rosa Noguera
8, Raymond L Stallings
9,10,
An Van Damme
11, Geneviève Laureys
12, Joëlle Vermeulen
13, Tom Van Maerken
1,14, Frank Speleman
1and
Jo Vandesompele
1*Abstract
Background:Accurate outcome prediction in neuroblastoma, which is necessary to enable the optimal choice of risk-related therapy, remains a challenge. To improve neuroblastoma patient stratification, this study aimed to identify prognostic tumor DNA methylation biomarkers.
Results:To identify genes silenced by promoter methylation, we first applied two independent genome-wide methylation screening methodologies to eight neuroblastoma cell lines. Specifically, we used re-expression profiling upon 5-aza-2’-deoxycytidine (DAC) treatment and massively parallel sequencing after capturing with a methyl-CpG-binding domain (MBD-seq). Putative methylation markers were selected from DAC-upregulated genes through a literature search and an upfront methylation-specific PCR on 20 primary neuroblastoma tumors, as well as through MBD- seq in combination with publicly available neuroblastoma tumor gene expression data. This yielded 43 candidate biomarkers that were subsequently tested by high-throughput methylation-specific PCR on an independent cohort of 89 primary neuroblastoma tumors that had been selected for risk classification and survival. Based on this analysis, methylation ofKRT19,FAS, PRPH,CNR1, QPCT,HIST1H3C,ACSS3andGRB10was found to be associated with at least one of the classical risk factors, namely age, stage orMYCN status. Importantly,
HIST1H3CandGNASmethylation was associated with overall and/or event-free survival.
Conclusions:This study combines two genome-wide methylation discovery methodologies and is the most extensive validation study in neuroblastoma performed thus far. We identified several novel prognostic DNA methylation markers and provide a basis for the development of a DNA methylation-based prognostic classifier in neuroblastoma.
Background
Neuroblastoma (NB) is a neuroectodermal tumor that ori-ginates from precursor cells of the sympathetic nervous system and represents the most common extra-cranial solid tumor of early childhood. NB displays a highly vari-able clinical course, ranging from spontaneous regression to life-threatening disease [1].
Despite advances in multimodal anti-cancer therapies, survival rates for children with aggressive NB remain dis-appointingly low. Survival rates vary widely, depending on clinical features, such as age at diagnosis and tumor stage, as well as biological characteristics of the tumor. Amongst the latter,MYCNamplification has been used for many years as a genetic marker for therapy stratifica-tion [1]. More recently, a subset of high-risk tumors with non-amplifiedMYCNand 11q deletions was identified, while absence of segmental aberrations upon genome-wide DNA copy number analysis was found to be asso-ciated with excellent survival [2,3]. In order to facilitate * Correspondence: joke.vandesompele@ugent.be
†Contributed equally 1
Center for Medical Genetics, Department of Pediatrics and Genetics, Ghent University, De Pintelaan 185, 9000 Ghent, Belgium
Full list of author information is available at the end of the article Decocket al.Genome Biology2012,13:R95
http://genomebiology.com/2012/13/10/R95
the comparison of risk-based clinical trials, a new con-sensus approach for pretreatment risk classification has been designed including genetic parameters [1,4]. Despite this progress, additional markers for therapeutic stratifi-cation are warranted in order to avoid under- or over-treatment and to improve selection of ultra-high-risk patients for new experimental therapies. Recently, prog-nostic mRNA and microRNA (miRNA) signatures were developed to accommodate this need [5-7]. Here, we pro-pose that the use of DNA methylation markers is a new and promising method for prognostic classification.
DNA methylation is the addition of a methyl group to carbon 5 of the cytosine within the dinucleotide CpG. Dense clusters of CpG dinucleotides, termed CpG islands, are often present in gene promoters and methylation of those regions typically results in transcriptional silencing of the gene. As such, abnormal DNA methylation in cancer cells leads to aberrant expression patterns [8]. In NB, the most described epigenetic alterations are DNA methyla-tion ofCASP8[9] andRASSF1A[10], both associated with risk factors, such asMYCNamplification (MNA), age at diagnosis and tumor stage [11-15]. Recently, a few gen-ome-wide methylation screening methodologies have been applied in NB, including re-expression analysis after treat-ment with 5-aza-2’-deoxycytidine (DAC), DNA methyla-tion promoter arrays after capturing with methylated DNA immunoprecipitation (MeDIP) and methylation microar-rays. These studies indicate that aberrant DNA methyla-tion makes an important contribumethyla-tion toward NB tumor biology by downregulating specific genes and show the potential of using DNA methylation in future patient ther-apy stratification protocols [16-18]. Furthermore, the power of DNA methylation as a non-invasive, sensitive and specific biomarker has been demonstrated by measuring
DNA methylation ofRASSF1Ain serum of primary NB
patients [15] (for a detailed review see [19]). In order to improve the outcome prediction of NB patients, this study aims at establishing robust DNA methylation biomarkers that can identify patients with unfavorable prognosis.
Results
Discovery and integrated analysis: genome-wide methylation screening for selection of
candidate biomarkers
The experimental setup of the study is summarized in Figure 1. In order to identify DNA methylation biomarkers in NB, we first applied two genome-wide methylation screening methodologies on eight NB cell lines: microarray after re-expression analysis and massively parallel sequen-cing after capturing with a methyl-CpG-binding domain (MBD- seq). The genome-wide assessment of gene expres-sion reactivation upon DAC treatment is an indirect method to detect DNA methylation as the influence of the demethylating effect is measured at the transcriptional
The second genome-wide DNA methylation screening methodology we applied, to the same eight NB cell lines, was MBD-seq: massively parallel sequencing of methyla-tion-enriched DNA fragments, whereby the enrichment is based on the capture of methylated sheared DNA using the high affinity of the methyl-CpG-binding domain () of the protein MBD2 towards methylated cyto-sines. Sequencing yielded 4.4 to 8.6 million paired-end reads, depending on the cell line, and after peak calling 70,816 to 112,412 peaks were detected, representing genomic regions methylated in the corresponding cell
[image:3.595.59.538.89.489.2]line. Between 7,612 and 11,178 of these peaks (around 10% of all identified peaks) are located in promoter regions of annotated genes (-1,500 bp to +1,000 bp around the transcriptional start site (TSS)). These ‘methylation peaks’were visualized in the Integrative Genomic Viewer [22], showing that promoter regions that are well known to be heavily methylated in NB were confirmed - for example, the protocadherinb(PCDHB) family cluster (Additional file 2) [23,24]. In some regions (for example, in the promoter regions ofHIST1H3Cand ACSS3) it was also possible to distinguish different DNA
Figure 1Combining genome-wide methylation discovery and validation, several novel prognostic DNA methylation markers were identified in neuroblastoma (NB). Starting points are a microarray based re-expression study after treatment with 5-aza-2’-deoxycytidine (DAC) and a next-generation sequencing experiment using an enrichment strategy towards methylated DNA (methyl-CpG-binding domain (MBD) capture). Both were performed on the same panel of eight NB cell lines. Applying a bioinformatics and text-mining-based approach on the re-expression data, 120 candidate genes were selected and tested using an initial high-throughput methylation-specific PCR (MSP) screen. The MBD-seq data were combined with public mRNA expression studies to enrich for potential prognostic biomarkers. Using a rank-based scoring system, a final selection of 43 candidates was made, which were then tested using MSP on 89 primary NB samples (in the following subgroups: LR-SURV, low-risk patients with long follow-up; HR-DOD, high-risk patients that die of disease; HR-SURV, high-risk patients with long follow-up). Finally, mRNA expression levels of seven DNA methylation biomarkers were determined. qPCR, quantitative PCR.
Decocket al.Genome Biology2012,13:R95 http://genomebiology.com/2012/13/10/R95
methylation profiles between MNA (IMR-32, LAN-2 and
N206) and MYCNsingle copy (SH-SY5Y, SK-N-AS,
CLB-GA and SJNB-1) NB cell lines (Additional file 2). Using the R/BioC package DESeq [25], 510 regions were identified as differentially methylated betweenMYCN amplified and single copy cell lines, of which 95 are in close proximity to an annotated TSS (-1,500 bp to +1,000 bp). Also, some miRNAs appeared to be methylated in their promoter region.
After peak calling, we also performed gene set enrich-ment analysis [26], using a custom, ranked list of genes with at least one MBD peak present in a region -1,500 bp to +500 bp around its TSS, in order to explore whether promoter regions that are enriched after MBD capture are often re-expressed as well upon DAC treatment. This ana-lysis clearly showed a high enrichment score for each cell line (enrichment scores from 0.32 to 0.36; FDR q-value <0.01), demonstrating that a large portion of methylated regions (captured by MBD) are indeed reactivated upon DAC treatment. The overlap between the two genome-wide datasets can be further explored by intersecting them. In total, 183 genes are both re-activated upon DAC treatment (at least 1 log2 difference after and before treat-ment) and have an MBD peak in their promoter regions (-1,500 bp to +1,000 bp around the TSS) in at least 2 of the 8 investigated NB cell lines. Of these 183 genes, 46 are both re-expressed and methylated in 3 cell lines, 9 in 4 cell lines and 5 in at least 5 cell lines.
As we feared that only using cell lines in the selection phase of potential prognostic DNA methylation biokers would lead to the identification of methylated mar-kers not necessarily related with prognosis, six publicly available mRNA expression studies [27-34] were included in the analysis. In these studies, which comprise mRNA expression data of 380 primary NB tumors, identifying dif-ferentially expressed probes (genes) between prognostic groups would allow us to pinpoint potential prognostic methylated promoter regions in our methylome maps. Finally, a rank-based scoring system was used to prioritize genes that show methylation, re-expression after DAC treatment and differential expression (related with risk) across the prognostic groups. This score scheme uses the individual ranks of each analysis. In brief, DAC reactiva-tion is ranked according to FDR rate (as determined by RankProd analysis), MDB-seq data are ranked according to peakP-values and expression data are ranked according to FDR (determined by RankProd analysis). Each data source is given the same weight and a combined rank is calculated (for details, see Materials and methods). This scoring system combined all generated data and allowed us to select 43 top-ranking and thus strong prognostic methylation candidate genes without the need to use rather artificial threshold values for the different datasets.
Validation: determining the prognostic power of DNA-methylation biomarkers
For these 43 genes, 48 MSP assays were designed and tested on 3 NB cell lines (IMR-32, SK-N-AS and SH-SY5Y) and the HCT-116 DKO cell lines, along with an independent cohort of 89 primary NB samples. Within the 89 primary NB sample set all three prognostic groups (LR-SURV, HR-DOD and high-risk survivors (HR-SURV); for details see Material and methods) were approximately equally represented. The complete matrix with all MSP results of all samples and a global overview of the MSP results per assay can be found in Additional file 3. Over 60% of the designed assays indeed detected methylation for the respective marker in at least 10% of the selected NB tumors. Ten MSP assays (COL6A3,
miR-1225, miR-3177,PCDHA6,PLXNC1,ANKRD43,ADRB2,
APOE, miR-671 andQPCT) revealed methylation in at least 75% of the patient samples, and the MSP assays for
KCND2,PRPH,KRT19(assay 83159) andTNFRSF10D
were methylated in 50% to 75% of the patient samples. We could also detect DNA methylation in the promoter region of miR-1225, miR-3177, miR-671 and miR-663, methylated in 99%, 99%, 79% and 4% of the patient sam-ples, respectively.
Unique in this study is the use of three discrete prognos-tic patient groups, which allowed us to assess differential methylation across all these prognostic groups. Therefore, we performed hierarchical cluster analysis on the methyla-tion data of all 48 MSP assays on the entire NB tumor cohort, revealing two clusters with a separation between high-risk (HR) and low-risk (LR) patients (heatmap in Additional file 3). Furthermore, the overall methylation pattern in the primary NB tumor samples was compared by calculating the number of methylation events for each sample. This indicates that HR patients show, on average, more methylation events compared to LR patients (P< 0.001; HR-DOD, 17.21 methylation events (95% confi-dence interval (CI) 15.62 to 18.81); HR-SURV, 17.13 methylation events (95% CI 15.81 to 18.46); LR-SURV, 13.00 methylation events (95% CI 11.86 to 14.14)). Also on the individual marker level, some MSP assays are dif-ferentially methylated across the prognostic patient
groups:KRT19and ACSS3. These genes are more
fre-quently methylated in HR patients compared to LR
patients (Table 1). Within the HR group, HIST1H3C
shows a tendency to be more frequently methylated in DOD compared to SURV samples (21% in
HR-DOD versus 7% in HR-SURV), whileKRT19(32% versus
48%) and ACSS3 (25% versus 47%) show the inverse
pattern.
Table 1 Several individual markers are differentially methylated between the prognostic groups and neuroblastoma risk factors
Type Subtype KRT19 FAS PRPH CNR1 QPCT HIST1H3C ACSS3 GRB10
Prognostic group LR-SURV 0/31 (0%) 1/31 (3%) 14/31 (45%) 2/31 (6%) 18/31 (58%) 0/31 (0%) 0/31 (0%) 6/31 (19%) HR-SURV 14/30 (48%) 8/30 (27%) 24/30 (80%) 10/30 (33%) 25/30 (83%) 2/30 (7%) 14/30 (47%) 13/30 (43%) HR-DOD 9/28 (32%) 6/28 (21%) 19/28 (68%) 10/28 (36%) 24/28 (86%) 6/28 (21%) 7/28 (25%) 11/28 (39%) Stage Stage 1 0/21 (0%) 0/21 (0%) 8/21 (38%) 1/21 (5%) 13/21 (62%) 0/21 (0%) 0/21 (0%) 4/21 (19%) Stage 2 1/12 (8%) 2/12 (17%) 8/12 (67%) 2/12 (17%) 8/12 (67%) 0/12 (0%) 1/12 (8%) 3/12 (25%) Stage 3 9/17 (53%) 4/17 (24%) 13/17 (77%) 9/17 (53%) 15/17 (88%) 3/17 (18%) 9/17 (58%) 8/17 (47%) Stage 4 13/39 (33%) 9/39 (15%) 28/39 (72%) 10/39 (26%) 31/39 (80%) 5/39 (18%) 11/39 (28%) 15/39 (39%)
MYCN MYCNsingle copy 7/50 (14%) 2/50 (4%) 24/50 (48%) 5/50 (10%) 31/50 (62%) 0/50 (0%) 2/50 (4%) 14/50 (28%)
MYCNamplified 16/39 (41%) 13/39 (33%) 33/39 (85%) 17/39 (44%) 36/39 (92%) 8/39 (21%) 19/39 (49%) 16/39 (41%) Age Age at diagnosis > 12 months 21/53 (40%) 14/53 (26%) 37/53 (69%) 18/53 (34%) 46/53 (87%) 8/53 (15%) 21/53 (40%) 24/53 (45%) Age at diagnosis < 12 months 2/36 (6%) 1/36 (3%) 20/396(56%) 4/36 (11%) 21/36 (58%) 0/36 (0%) 0/36 (0%) 6/36 (17%) Age at diagnosis > 18 months 20/45 (44%) 13/45 (29%) 33/45 (73%) 17/45 (38%) 40/45 (89%) 8/45 (18%) 19/45 (49%) 23/45 (51%) Age at diagnosis < 18 months 3/44 (7%) 2/44 (5%) 24/44 (55%) 5/44 (11%) 27/44 (61%) 0/44 (0%) 2/44 (5%) 7/44 (16%) Overall total 23/89 (26%) 15/89 (17%) 57/89 (64%) 22/89 (25%) 67/89 (75%) 8/89 (9%) 21/89 (24%) 30/89 (34%) Statistics (Fisher’s exactP-value)
Prognostic group <0.001 0.151 0.112 0.068 0.165 0.0624 <0.001 0.405
MYCN 0.0594 0.008 0.008 0.008 0.017 0.0146 <0.001 0.708
Stage 0.007 0.287 0.221 0.059 0.683 0.448 0.008 0.700
Age cutoff 12 months 0.008 0.045 0.579 0.138 0.059 0.123 <0.001 0.059
Age cutoff 18 months 0.002 0.045 0.326 0.059 0.045 0.0594 0.0015 0.012
The number (percentage) of methylated samples in each stratum is given.P-values according to the Fisher’s exact test, corrected for multiple testing (Benjamini-Hochberg). DOD, high-risk deceased patients; HR-SURV, high-risk patients alive for at least 1,000 days follow-up; LR-HR-SURV, low-risk patients alive for at least 1,000 days follow-up.P-values in bold indicate significant associations.
Decock
et
al
.
Genome
Biology
2012,
13
:R95
http://genome
biology.
com/2012/13/
10/R95
Page
5
of
in NB (Table 1). In this analysis, the age at diagnosis was tested using two different age cutoffs. The 12 months cut-off was chosen as it was used for therapy stratification and as a criterion in the sample selection. The more recently established cutoff of 18 months [1,35,36] was also taken into account. Newly discovered methylated markers are FAS,PRPH,CNR1,QPCT,HIST1H3C,ACSS3andGRB10, methylation of which is associated with at least one of the NB risk factors. Table 1 further indicates that the differ-ence in the methylation status ofHIST1H3CandACSS3
betweenMYCNsingle copy and MNA NB cell lines as
detected by MBD-seq is reflected in the MSP results of the primary tumors as well, asHIST1H3CandACSS3are almost exclusively methylated in MNA samples.
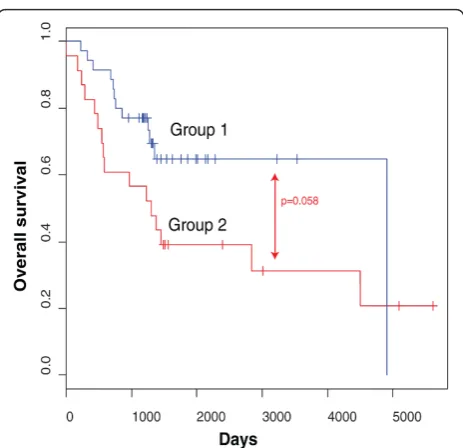
Survival analysis using the complete MSP data set indi-cates that patients with less methylation events showed better survival rates than patients with a high number of methylation events (P= 0.01; Additional file 3), as this analysis principally discriminates HR and LR patients. In order to assess to what extent our MSP data set is able to predict overall survival (OS) in SURV versus HR-DOD patients, leave-one-out decision tree analysis was performed and repeated 58 times (the number of HR patients). For this analysis, we only included the data from MSP assays (un)methylated in at least three samples. Comparison of the 58 generated decision trees showed
that 4 DNA methylation biomarkers (CNR1, ACSS3,
HIST1H3CandPRPH) are included in at least 50% of the resulting classifiers. Then, leave-one-out decision tree ana-lysis was redone, but this time using only the methylation
data ofCNR1,ACSS3,HIST1H3CandPRPH. Afterwards,
the predictions for all 58 HR samples were visualized in a Kaplan-Meier plot (Figure 2). This analysis indicates that
the combined methylation status of CNR1, ACSS3,
HIST1H3CandPRPHhas the potential to discriminate
between HR-SURV and HR-DOD patients (P= 0.058). Survival analysis was also performed on the individual marker level. We first tested differences between the HR-DOD and LR-SURV groups using the univariate log-rank test (with multiple testing correction). This first analysis indicates that six genes (KRT19,FAS,CNR1,HIST1H3C,
ACSS3and GNAS) are significantly related to survival
when comparing these patient groups. As we also want to discriminate the HR patient groups (DOD and HR-SURV), we then used the entire dataset (all samples) to assess which of these six genes were associated with survi-val (in a specific stratum only, such as only inMYCN sin-gle copy samples). These results are shown in Table 2. According to log-rank tests,HIST1H3Cmethylation is associated with both OS and event-free survival (EFS), whileGNASmethylation is associated with EFS. As NB is a heterogeneous disease, these biomarkers may be suited to a specific subgroup of patients for predicting survival. For example,HIST1H3Cmethylation only occurs in
high-stage tumors with MNA (6/17 (35%) in HR-DOD patients versus 2/22 (9%) in HR-SURV patients). Figure 3 shows
the Kaplan-Meier plots forHIST1H3CandGNAS
methy-lation (OS or EFS and OS in specific strata related to one of the risk factors).
mRNA expression profiling: determining transcriptional silencing of DNA methylation biomarkers
As it is known that promoter methylation may cause transcriptional silencing of the gene, we further measured the mRNA expression levels of five promising DNA methylation biomarkers that were methylated in a sub-stantial fraction of HR patients (CNR1,GRB10,KRT19,
PRPHand QPCT). Quantitative RT-PCR assays were
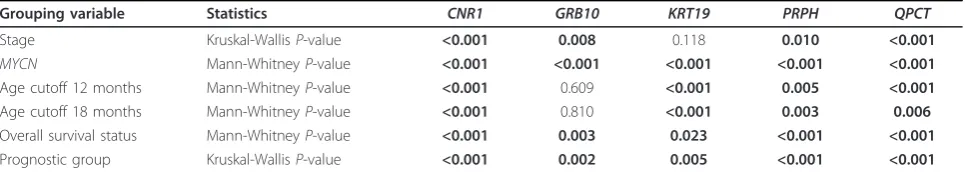
developed and tested on 366 primary NB tumor samples. Table 3 displays the results of the comparisons of the expression levels of each DNA methylation biomarker
between the different NB tumor stages,MYCNsingle
[image:6.595.306.538.85.309.2]copy and MNA tumors, the two age groups (using both the 12 and 18 months cutoff), and surviving and deceased patients. As an example, the mRNA expression levels of these genes across the NB tumor stages are depicted in Additional file 4. Out of the 366 primary NB tumors, 245 could be assigned to one of the prognostic groups defined in this study (Additional file 5), which allowed us to asses differential mRNA expression between these
Figure 2The combined methylation status ofCNR1,ACSS3,
HIST1H3CandPRPHcan potentially discriminate HR patients. The Kaplan-Meier plot shows overall survival in the high-risk samples of the high-throughput MSP screening according to their predicted overall survival status based on leave-one-out decision tree analysis using the methylation data ofCNR1,ACSS3,HIST1H3C
Table 2 Several individual DNA methylation markers are associated with survival
Statistics KRT19 FAS CNR1 HIST1H3C ACSS3 GNAS
HR-DOD versus LR-SURV (P-value OS) 0.037 0.028 0.043 0.002 0.002 0.012
HR-DOD versus LR-SURV (P-value EFS) 0.039 0.049 0.039 0.039 0.079 0.039
HR-DOD versus LR-SURV and HR-SURV (P-value OS) 0.687 0.639 0.423 0.039 0.691 0.221
HR-DOD versus LR-SURV and HR-SURV (P-value EFS) 0.665 0.467 0.414 0.041 0.939 0.041
HR-DOD versus LR-SURV and HR-SURV (P-value OS (stratum))
Age < 12 months 0.035
Stage 4 0.033
MYCN= 0 0.033 HR-DOD versus LR-SURV and HR-SURV (P-value EFS
(stratum))
Age < 12 months 0.014
MYCN= 0 0.001
Log-rank test statistics (Mantel-Cox) are given (multiple testing correction by Benjamini-Hochberg) for comparison between the ultra-high risk group (HR-DOD)
versus the low risk group (LR-SURV), and between the ultra-high risk group (HR-DOD) and all survivors (LR-SURV and HR-SURV). If a significant association (P<
0.05) was found in a particular stratum (associated with risk factors), this stratum is shown (multiple testing correction for the different comparisons by
Benjamini-Hochberg).MYCN= 0:MYCNsingle copy ; EFS, event-free survival; OS, overall survival.P-values in bold indicate significant associations.
Figure 3Methylation ofHIST1H3CandGNASis associated with worse survival outcome. Kaplan-Meier plots on the left show overall survival or event-free survival for all 89 primary neuroblastoma samples, those on the right overall survival in a specific stratum based on one of the risk factors only. Survival curves indicated with‘M’are the methylated samples, survival curves associated with the unmethylated assay are indicated with‘U’. The numbers of patients are indicated (n) andP-values are determined using a log-rank test (Mantel-Cox; multiple testing correction by Benjamini-Hochberg). Time is indicated in days, starting from diagnosis and censored to 2,000 days (censored samples are indicated with vertical lines crossing the overall survival curves).MYCN= 0:MYCNsingle copy.
Decocket al.Genome Biology2012,13:R95 http://genomebiology.com/2012/13/10/R95
[image:7.595.59.539.287.653.2]groups as well. For all genes mRNA expression levels were significantly higher in the LR group compared to the HR groups. As methylation of these genes was mainly detected in the HR groups, this suggests that methylation may contribute to the transcriptional silencing of these genes.
Survival analysis using Cox proportional hazards further shows that low mRNA expression levels ofCNR1(hazard ratio (HR) 0.768; 95% CI 0.619 to 0.953; P = 0.028), GRB10(HR 0.613; 95% CI 0.433 to 0.866;P= 0.015) and PRPH(HR 0.714; 95% CI 0.566 to 0.922;P= 0.015) were significantly associated with poor survival. After dichoto-mization of the mRNA expression data, using the median relative mRNA expression value as a cutoff, Kaplan-Meier survival curves were plotted (log-rank test; Additional file 5).
An interesting observation in our MBD-seq and MSP data is the fact thatHIST1H3CandACSS3are
differen-tially methylated betweenMYCNsingle copy and MNA
NB cell lines and primary tumors (Table 1; Additional file 2). To further explore this finding, theHIST1H3Cand
ACSS3MSP assays were tested on 31 NB cell lines, of
which 10 wereMYCNsingle copy and 21 MNA
(Addi-tional file 4). In addition, we also profiledHIST1H3Cand ACSS3mRNA expression levels in these cell lines, in order to assess the direct relationship between promoter methy-lation and mRNA expression and to compare this remethy-lation- relation-ship betweenMYCNsingle copy and MNA cell lines. The significant differential methylation status ofHIST1H3C
andACSS3betweenMYCNsingle copy and MNA samples
was confirmed in the NB cell lines (HIST1H3C, methy-lated in 15/21 (71%) MNA cell lines and in 2/10 (20%) MYCNsingle copy cell lines,P= 0.018;ACSS3, methylated in 20/21 (95%) MNA cell lines and in 3/10 (30%)MYCN single copy cell lines,P< 0.001). Moreover, expression of
HIST1H3CmRNA was significantly lower in methylated
samples compared to unmethylated samples, both in MNA (P= 0.005) andMYCNsingle copy (P= 0.044) cell lines (Figure 4). These data support the idea that HIST1H3Cpromoter methylation contributes to transcrip-tional silencing of the gene. Figure 4 further indicates that theMYCNstatus itself is not significantly associated with
HIST1H3C mRNA expression levels (P = 0.204). As
ACSS3is expressed at very low mRNA levels, we could
not correlate its mRNA expression data with the methyla-tion data (data not shown).
Discussion
Thus far, most of the studies analyzing DNA methyla-tion patterns in NB have been candidate gene-based, with the methylation status of the promoter region for only a limited number of genes being tested. These candi-date genes were selected based either on prior knowledge of NB tumor biology or on the fact of being methylated in other tumor types. As a consequence, only few DNA
methylation biomarkers, such asKRT19,TNFRSF10D,
CASP8,ZMYND10andRASSF1A, were previously related
with NB risk factors or survival [11,13-15,18,37-41]. In order to identify new DNA methylation biomarkers in NB, we applied a multilevel experimental approach. In the dis-covery phase we established a genome-wide methylome map of eight NB cell lines. These cell lines were profiled using gene expression microarrays before and after DAC treatment, and using MBD capture followed by next-gen-eration sequencing (NGS). The combination of both methodologies enabled the identification of regions that are both methylated and undergo re-expression upon DAC treatment. So far, only MeDIP chips were used in whole promoter profiling studies on NB [9], making this study the first one using NGS for unbiased and more sen-sitive assessment of genome-wide DNA methylation pat-terns in NB. Our results emphasize the potential of this epigenetic sequencing technique, as it enables the investi-gation of the methylome or epigenome of a sample in great detail at a feasible cost.
[image:8.595.57.540.111.198.2]Integration of these methylome maps with genome-wide gene expression profiles led to a selection of 43 candidate biomarkers that were tested on 89 primary NB patient samples. All samples were assigned to one of three discrete prognostic patient groups (low-risk survivors (LR-SURV), high-risk deceased (HR-DOD) and high-risk survivors (HR-SURV)). While most NB methylation studies did not discriminate between HR-SURV and HR-DOD patients, we believe this is an important clinical question, as both Table 3 mRNA expression level of several markers associates with neuroblastoma risk factors, prognostic groups and survival
Grouping variable Statistics CNR1 GRB10 KRT19 PRPH QPCT
Stage Kruskal-WallisP-value <0.001 0.008 0.118 0.010 <0.001
MYCN Mann-WhitneyP-value <0.001 <0.001 <0.001 <0.001 <0.001
Age cutoff 12 months Mann-WhitneyP-value <0.001 0.609 <0.001 0.005 <0.001
Age cutoff 18 months Mann-WhitneyP-value <0.001 0.810 <0.001 0.003 0.006
Overall survival status Mann-WhitneyP-value <0.001 0.003 0.023 <0.001 <0.001
Prognostic group Kruskal-WallisP-value <0.001 0.002 0.005 <0.001 <0.001
The statistical test used is shown andP-values (corrected for multiple testing using Benjamini-Hochberg) are indicated.P-values in bold indicate significant
prognostic groups are currently considered high-risk and uniformly treated, making the present study unique in its concept. As we make use of amplified bisulfite-converted DNA, only limited amounts (100 to 200 ng) of tumor DNA are required to test over 100 MSP assays. The MBD-seq results greatly help in designing the assays in the most informative regions, which is important as the assay location is critically important, again confirmed in this study for a number of genes for which multiple assays
were designed (for example, TGFBIandKRT19). The
combination of the number of samples and assays used in this study further makes it the most comprehensive methylation study in NB. Furthermore, the high-through-put validation pipeline allows fast and accurate follow-up validation of potential candidate DNA methylation bio-markers for large numbers of patients. Indeed, PCR-based detection methodologies are robust and can thus be used in a wide range of laboratory settings for a low price with-out the need of special equipment other than for qPCR and (microfluidic) electrophoresis, both present in most molecular laboratories. The presented DNA methylation screening and validation methodology can thus easily be adapted by (cancer) researchers addressing similar ques-tions in other research fields.
In this study, several novel biomarkers were established in addition to known DNA methylation biomarkers in NB,
such as KRT19,TGFBI,TNFRSF10D andTNFRSF10A
[14,18,37,42,43]. Interestingly, some of these novel genes were previously reported to be important in NB biology (without reference to their epigenetically altered status) or were described as epigenetic biomarkers in other tumor entities, such as FAS, which encodes a member of the tumor necrosis factor receptor (TNFR) superfamily [44-50]. Several other novel methylation biomarkers were also shown to be differentially methylated between HR and LR patients, and many of these were associated with NB risk factors or with survival. However, discriminating HR-DOD and HR-SURV patients is challenging. While
only a few individual MSP designs (HIST1H3C,KRT19
andACSS3) were moderately discriminatory between
these two HR subgroups, the combined methylation data analysis ofCNR1,ACSS3,HIST1H3CandPRPHindicates the potential of DNA methylation biomarkers in stratifying HR NB patients. In this study, the difficulty of identifying individual biomarkers that differentiate between HR-DOD and HR-SURV patients may be explained by the fact that NB cell lines were used in the discovery phase, thus enriching for genes discriminating between HR and LR patients as NB cell lines can be considered models for aggressive HR tumors. To accommodate this, we plan to perform a large-scale discovery using MBD capture fol-lowed by NGS on primary NB tumors equally distributed over the three prognostic groups used here.
PRPHis one of the novel biomarkers identified and is differentially methylated across the prognostic patient groups. This gene encodes the cytoskeletal protein periph-erin found in neurons of the peripheral nervous system, and is probably associated with maturation of the neuronal phenotype and hence serves as a differentiation marker for tumors derived from the neural crest [51]. In our study, PRPHmethylation was mainly detected in more advanced tumor stages. Since promoter methylation may cause tran-scriptional silencing of the gene and advanced NB tumor stages are less differentiated [52], this is in line with the idea that high levels of peripherin contribute to more dif-ferentiated tumor stages. As demonstrated in this study, this idea is further strengthened by the fact thatPRPH mRNA expression levels gradually decreased with increas-ing aggressiveness of the tumor. As whole genome sequence analysis recently showed that genes involved in neuritogenesis are recurrently affected in high-stage NB [53], the identification ofPRPHmethylation opens new research perspectives regarding NB therapy.
[image:9.595.62.539.93.205.2]Next to protein-coding genes, some MSP assays were designed in the promoter region of miRNAs. Aberrant miRNA expression contributes majorly to NB tumor biology and has been extensively studied during the past few years. Most of these studies used miRNA
Figure 4HIST1H3Chas lower mRNA expression levels in NB cell lines in which theHIST1H3Cpromoter is methylated. Thirty-one NB cell lines were categorized according to theirMYCNamplification andHIST1H3Cmethylation status. The relativeHIST1H3CmRNA expression level of each of these cell lines is indicated (MYCNsingle copy - Unmethylated,MYCNsingle copy - Methylated;MYCNamplified - Unmethylated,MYCN
amplified - Methylated).P-values according to the Mann-Whitney test are also indicated. Decocket al.Genome Biology2012,13:R95
http://genomebiology.com/2012/13/10/R95
microarrays or high-throughput RT-qPCR to analyze the miRNA expression patterns in primary NB tumor sam-ples [54-56]. Although a broad deregulation of the miRNA expression profile in NB has been described, miRNA promoter hypermethylation is relatively unex-plored. Up until now, the only miRNA for which the promoter region is known to be methylated in NB is miR-200b [57]. Interestingly, miR-1225, miR-3177 and miR-671 were found to be methylated in their promoter region in more than 75% of the NB tumors in our study. Currently, little is known about the putative func-tion of these miRNAs, as they are not well described or not described at all in the literature [58,59].
Another interesting finding is thatMYCNsingle copy and MNA samples show differential promoter methylation ofHIST1H3CandACSS3. Currently, little is known about
the association betweenMYCNand DNA methylation of
certain genes in NB, nor about the underlying molecular mechanisms. Previously, Teitzet al. [9,60] showed that DNA methylation ofCASP8 is almost exclusively asso-ciated with MNA in both NB cell lines and primary
tumors. They further noticed that CASP8was
hemi-methylated (only one allele) in stage 1, 2 and 3 NB, which may indicate that complete methylation ofCASP8may be coupled to another event, such as amplification of the MYCNgene. While this suggests that MNA is functionally linked to complete methylation of bothCASP8alleles, it is not clear if these two events occur concurrently, or if one event leads to the other. Obviously, genes differentially
methylated between MNA andMYCNsingle copy samples
need to be further functionally characterized, as this may lead to new insights into NB biology.
Conclusions
Although international collaboration in the field of NB has invested tremendous effort in optimizing patient stratifica-tion and therapy protocols, OS rates remain low. This study shows that DNA methylation biomarkers have the potential to refine current risk assessment schemes. In contrast to most NB methylation studies that are candi-date gene-based, we applied two genome-wide detection methodologies to discover hypermethylated regions in NB: re-expression analysis after demethylating DAC treatment and NGS after MBD capture. Furthermore, we present a high-throughput and semi-automated MSP pipeline, which was used to test the candidate DNA methylation markers on a large patient tumor cohort. We have identi-fied novel aberrant promoter hypermethylation of protein coding genes and miRNAs in NB. Some of these DNA methylation biomarkers are associated with NB risk fac-tors and/or survival, emphasizing the prognostic value of these markers and their potential to be used in a DNA methylation-based prognostic classifier in NB. The use of such a DNA methylation signature, discriminating HR
patients, is demonstrated here by the combined methyla-tion data analysis ofCNR1,ACSS3,HIST1H3CandPRPH. Furthermore, some DNA methylation biomarkers showed low levels of mRNA expression in patient groups with high methylation levels. This suggests that promoter methylation may contribute to transcriptional silencing of these genes, which may be important in the pathogenesis of NB. Encouraged by these results, we will now exten-sively further validate these DNA methylation biomarkers and refine the methylome map of different prognostic NB patient groups.
Materials and methods
Neuroblastoma cell lines and primary tumors
In total, 33 well-characterized NB cell lines, authenticated using array comparative genomic hybridization and short tandem repeat genotyping, were included in this study (Additional files 2 and 4). DNA was isolated using the QIAamp DNA Mini Kit (Qiagen, Venlo, The Nether-lands). In addition, 109 primary tumor samples of NB patients were collected prior to therapy at the Ghent University Hospital (Ghent, Belgium), the University Children’s Hospital Essen (Essen, Germany), Our Lady’s Children’s Hospital Dublin (Dublin, Ireland) or the Hospi-tal Clínico Universitario (Valencia, Spain). Informed con-sent was obtained from each patient’s guardian and the study was approved by the ethical committee of the Ghent University Hospital (approval number B67020109912). Clinical characteristics of the patients are shown in Addi-tional files 1 and 3. All NB patient samples were assigned to one of three defined risk groups based on risk para-meters (tumor stage,MYCNstatus and age at diagnosis) and disease outcome. First, HR patients that died of dis-ease (HR-DOD) as defined by stage 2/3, MNA, DOD; stage 4, age at diagnosis <12 months, MNA, DOD; or stage 4, age at diagnosis >12 months, DOD (n = 39). Second, HR patients alive (HR-SURV) after follow-up time >1,000 days (n = 30). Third, LR patients alive (LR-SURV) defined by stage 1/2,MYCNsingle copy, follow-up time >1,000 days; stage 3,MYCNsingle copy, age <12 months, follow-up time >1,000 days (status at last known follow-up is alive; n = 40). The clinical data of the 366 primary NB tumors (SIOPEN/GPOH cDNA library [6]), used to test the mRNA expression levels of the most promising DNA methylation biomarkers, can be found in Additional file 5.
Microarray after re-expression analysis
After RNA quality check on the Experion (Bio-Rad, Nazar-eth, Belgium), sample preparation, hybridization to Affy-metrix Human Genome U133 Plus 2.0 oligonucleotide chips and scanning were carried out according to the manufacturer’s protocol at the VIB MicroArray Facility. Standard quality metrics (simpleaffy BioC package [62] -boxplots, visual inspection of the slides, 5’-3’degradation plot) demonstrated that the oligonucleotide chip data were of good quality. The BioC affy package was used to normalize (gc-RMA normalization) the expression levels and to obtain present/absent (expression/no expression) MAS 5.0 calls for each probe set. For all cell lines and for each probe set, the number of reactivation events was counted (absent in untreated cells and present in treated cells). Expression data (before and after DAC treatment) have been deposited into the Gene Expression Omnibus [GEO: GSE31229], according to the MIAME guidelines.
MBD-seq
DNA samples (1 µg DNA) of the eight NB cell lines were sheared (Covaris S2) to an average length of 200 bp. Frag-ment distribution was determined by the Agilent 2100 Bioanalyzer and the concentration was determined using the Quant-iT PicoGreen dsDNA HS Assay Kit (Invitrogen, Ghent, Belgium). Starting from 200 ng sheared DNA, the MethylCollector Kit (ActiveMotif, La Hulpe, Belgium) was used to enrich for methylated fragments. Library prepara-tion for multiplex Illumina sequencing was done by com-bining the DNA Sample Prep Master Mix Set 1 (New England Biolabs, Frankfurt am Main, Germany) and the Multiplexing Sample Preparation Oligo Kit (Illumina). Size selection of the library was done on a 2% agarose gel. Frag-ments of around 300 bp (±50 bp) were excised and puri-fied. Illumina library amplification (21 cycles) was performed and concentration was determined. Paired-end sequencing was used for high confidence mapping of cap-tured fragments (2 × 45 bp sequencing - Illumina GAIIx, NXTGNT). Paired-end reads were mapped on the human reference genome (GRCh37) using Bowtie 0.12.7 and peaks were called using MACS 1.4beta. For differential methylation analysis, PCR duplicates were removed and sequence tags counted by using the BioC packages Short-Read and rtracklayer [63,64]. Sequence tag counts per sample were used to compose a count matrix that could be processed by the BioC package DESeq [25]. Sequencing data (raw sequence files, WIG files for visualization of the mapping results and the BED peak files as determined by MACS) have been deposited into GEO [GEO:GSE31353].
Selection of candidate biomarkers
Initial high-throughput MSP
In total, 212 MSP assays (Additional file 1) were designed in the promoter region of 120 corresponding genes re-expressed after DAC treatment, and tested on both the
DAC-treated and untreated NB cell lines, 9 LR-SURV patients and 11 HR-DOD patients (Additional file 1). A total of 500 to 1,000 ng DNA of these samples was bisul-fite-treated (EZ DNA Methylation Kit, Zymo Research, Irvine, CA, USA), eluted in 30 µl elution buffer and then tested on the BioTrove OpenArray (Life Technologies, Ghent, Belgium). Beta actin (ACTB) was used as a con-trol and to normalize samples. Thein vitromethylated
HCT-116 DKO cell line (treated with SssI, Zymo
Research) was used as a positive control. The methylation status for each MSP assay was determined, and called methylated if the melting temperature (Tm) of the ampli-con was within a specific interval as defined by the posi-tive control sample. These methylation calls were further analyzed by determining specificity and sensitivity of the HR-DOD samples versus LR-SURV samples.
Publicly available mRNA expression studies
Six publicly available mRNA expression studies [27-34] [GEO:GSE19274, GEO:GSE16237, GEO:GSE14880, GEO: GSE12460, GEO:GSE13136, GEO:GSE3960] were ana-lyzed using RankProd analysis (BioC package [18]), to identify differentially expressed probes between prognostic groups (high-risk versus risk, high-stage versus low-stage, and MNA versusMYCNsingle copy).
Scoring system
Each analysis score of a promoter region (for example, RankProd FDR value andP-value for differential expres-sion between risk groups, andP-values of the peak after MBD-seq) was ranked and given a score, ranging from tan (1) to 0 according to their rank. These individual scores were then summed and 43 top-ranking genes were selected for further analysis.
High-throughput MSP
MSP assays were designed to only amplify the bisulfite-converted target region of interest and do not anneal to genomic DNA. As each primer contains at least two CpG sites, this means that a PCR product will only be generated if the template is methylated. We choose not to design the according U primers (that would amplify the non-lated bisulfite-converted DNA) as we do not assess methy-lation in a quantitative way. Afterin silicoassay evaluation, 48 selected MSP primers (including theACTBcontrol; Additional file 3) were empirically validated on the Roche LightCycler 480 (LC480) using thein vitromethylated HCT-116 DKO (positive control), the HCT-116 DKO (negative control) and NB cell lines. Based on melting curve and amplicon size analysis, all assays were consid-ered amplicon specific. The MSP assays were tested on 89 samples, selected from the previously described patient groups (31 LR-SURV patients, 28 HR-DOD patients and 30 HR-SURV patients; Additional file 3). A no template control (NTC) sample was loaded as well. For all samples, 500 to 1,000 ng DNA was bisulfite-treated (EZ DNA
Decocket al.Genome Biology2012,13:R95 http://genomebiology.com/2012/13/10/R95
Methylation Kit, Zymo Research) and eluted in 40 µl elu-tion buffer. Prior to MSP, bisulfite-treated DNA (BT-DNA) was amplified using the EpiTect Whole Bisulfitome Kit (Qiagen), starting from 100 ng BT-DNA. After amplifi-cation, the yield was determined by the Qubit 2.0 fluorom-eter in combination with the Quant-iT PicoGreen dsDNA BR Assay Kit (Invitrogen). The MSP was performed on the LC480 and plates were prepared using the Tecan freedom Evo robot, using a design that assures that all samples were tested for the same assay in the same run [65]. MSP amplifications were performed in 10 µl containing 5 µl LC480 SYBR Green I Master Mix (2×; Roche, Vilvoorde, Belgium), 1 mg/ml bovine serum albumin (Roche), 1 mM MgCl2(Roche), 125 nM forward and reverse primer (IDT, Leuven, Belgium), sample (20 ng amplified BT-DNA) and nuclease-free water (Sigma). MSP conditions were as fol-lows: activation for 10 minutes at 95°C, 45 amplification cycles (10 s at 95°C, 30 s at 60°C and 5 s at 72°C), followed by melting curve analysis (5 s at 95°C - melting curve from 60 to 95°C) and cool down to 45°C. Afterwards, the size of the amplicons was determined using the Caliper LabChip GX. A MSP assay was considered methylated if (1) its Cq value <35 (calculated by the LC480 software using the sec-ond derivative maximum method), (2) its melting tempera-ture (Tm) differed no more than 2°C from that of the positive control sample, and (3) the amplicon length dif-fered no more than 10 bp from the band size of the posi-tive control sample. In addition, the band height, as determined by the LabChip GX software, was required to be higher than 20.
mRNA expression profiling
The mRNA expression levels ofCNR1,GRB10,KRT19,
PRPH and QPCT were profiled on the NB SIOPEN/
GPOH cDNA library generated from 366 primary NB tumor samples (Additional file 5) [6]. For each DNA methylation marker a qPCR mRNA assay was designed and validatedin silicoandin vitro(Additional file 5) [66]. PCR plates were prepared as described in the previous sec-tion and RT-qPCR was performed on the LC480 as described in [6]. Relative gene expression levels were then normalized using the geometric mean of five reference
sequences (HPRT1,SDHA,UBC,HMBSandAluSq) [67].
ForHIST1H3CandACSS3, a qPCR mRNA assay
(Addi-tional file 4) was designed and tested on 31 NB cell lines on which the corresponding MSP assay was tested as well. Here, qPCR amplifications were performed in 5 µl con-taining 2.5 µl SsoAdvanced SYBR Green Supermix (2×; Bio-Rad), 0.25 µl forward and reverse primer (5 µM each) and 2 µl cDNA sample (corresponding to 5 ng cDNA). Relative gene expression levels were normalized using the geometric mean of the reference sequencesSDHA,UBC andAluSq. All RT-qPCR data analysis was done in qbase-PLUS
version 2.0 (Biogazelle, Ghent, Belgium) [65]. Logged
and normalized qPCR data can be found in Additional file 4 and 5.
Statistical analysis
Statistical analyses were performed using IBM SPSS soft-ware version 19.0. All statistical tests were two-sided and P-values <0.05 were considered statistically significant. Dif-ferential methylation across the prognostic groups was determined by the Chi square test. The relationship between the methylation status and NB risk factors was determined using Fisher’s exact test. Univariate survival analysis was performed with the Kaplan-Meier method and log-rank statistics (Mantel-Cox) to determine the impact of methylation status on EFS and OS. EFS was defined as the time between initial diagnosis and relapse or death of disease, or time between diagnosis and last follow-up if no event had occurred. OS is the time to disease-related death or last follow-up. Hierarchical clustering and leave-one-out decision tree analysis were performed using R 2.13.0 (rpart package). The relationship between logged mRNA expression levels and the prognostic groups, OS status and NB risk factors was determined using the non-parametric Kruskal-Wallis test or Mann-Whitney test. Hazard ratios between logged mRNA expression data and survival were estimated using the Cox proportional hazard model. Kaplan-Meier curves were created by dichotomiz-ing the logged mRNA expression data, usdichotomiz-ing the median mRNA expression value as a cutoff. ForHIST1H3C, the relationship between logged mRNA expression levels and the methylation status of the gene, and theMYCNstatus, was determined using the Mann-Whitney test. For all the above mentioned statistical tests, multiple hypothesis test-ing correction was performed (Benjamini-Hochberg method by using the R function p.adjust).
Additional material
Additional file 1: Clinical patient annotation, MSP assays and results on the BioTrove discovery platform.
Additional file 2: Visualization of the protocadherin beta gene cluster and theHIST1H3Cpromoter region in the Integrative Genomic Viewer. Eight neuroblastoma cell lines (SK-N-AS, CLB-GA, SH-SY5Y, SJNB-1, CHP-902R, IMR-32, LAN-2 and N206) and the MBD-seq results are displayed.
Additional file 3: Clinical patient annotation, summary of clinical characteristics, MSP assays, results and summarized results (per clinical parameter) on the LC480 platform for 89 NB patient samples. Assays differentially methylated between prognostic groups and between neuroblastoma risk factors are discussed in detail, as well as extended analyses on the MSP data (hierarchical clustering (heatmap) and survival analysis according to the number of methylation events (Kaplan-Meier plot)).
Additional file 4: Quantitative PCR and MSP assays forHIST1H3C
andACSS3and matched results (expression levels - methylation call) for a panel of 31 NB cell lines.
366 NB patient samples (SIOPEN/GPOH cDNA library). Boxplots of the expression levels forCNR1,GRB10,KRT19,PRPHandQPCTin each of the five different NB stages (stages 1, 2, 3, 4 and 4S). A Kaplan-Meier plot shows overall survival according to the relative mRNA expression levels ofCNR1,GRB10,KRT19,PRPHandQPCT.
Abbreviations
BT-DNA: bisulfite-treated DNA; CI: confidence interval; DAC: 5-aza-2’ -deoxycytidine; EFS: event-free survival; FDR: false discovery rate; GEO: Gene Expression Omnibus; HR: high-risk; DOD: high-risk deceased patients; HR-SURV: high-risk survivors; LR: low-risk; LR-HR-SURV: low-risk survivors; MBD: methyl-CpG-binding domain; MBD-seq: massively parallel sequencing after capturing with an MBD; MeDIP: methylated DNA immunoprecipitation; miRNA: microRNA; MNA:MYCNamplification; MSP: methylation-specific PCR; NB: neuroblastoma; NGS: next-generation sequencing; OS: overall survival; TSS: transcriptional start site.
Acknowledgements
The authors thank Els De Smet, Nurten Yigit, Justine Nuytens, Johan Vandersmissen and Jean-Pierre Renard (MDxHealth) for their kind help and NXTGNT for the excellent sequencing services. AD, KDP and TVM are supported by a grant of the Research Foundation Flanders (FWO), and GVP by a grant of the Ghent University Special Research Fund (BOF). RLS was a recipient of grants from Science Foundation Ireland (07/IN.1/B1776), Children’s Medical and Research Foundation, and National Institutes of Health (NIH; 5R01CA127496). RN was a recipient of grants (RD06/0020/0102) from Thematic Network of Cooperative Research on Cancer (RTICC), Institute of Health Carlos III (ISCIII) and European Regional Development Fund (ERDF), and Spanish Health Research Fund (FIS; 2010/PI015). This study was further supported by Emmanuel Van der Schueren Foundation (scientific partner of the Flemish League Against Cancer (VLK)), Fournier-Majoie Foundation for Innovation (FFMI), UGent GOA (grant number 01G01910), Institute for the Promotion of Innovation by Science and Technology in Flanders (IWT) and FWO (grant number G0530.12N).
Author details
1Center for Medical Genetics, Department of Pediatrics and Genetics, Ghent
University, De Pintelaan 185, 9000 Ghent, Belgium.2Faculty of Education, Health and Social Work, University College Ghent, 9000 Ghent, Belgium. 3Department of Mathematical Modelling, Statistics and Bio-informatics,
Ghent University, Coupure Links 653, 9000 Ghent, Belgium.4MDxHealth, Tour 5 GIGA, Avenue de l’Hôpital 11, 4000 Liège, Belgium.5NXTGNT, Ghent University, De Pintelaan 185, 9000 Ghent, Belgium.6Children’s Cancer Research Institute, St Anna Kinderkrebsforschug, Zimmermannplatz 10, A-1090 Vienna, Austria.7University Children’s Hospital Essen, Hufelandstraße 55, 45122 Essen, Germany.8Department of Pathology, Medical School, University of Valencia, Blasco Ibañez 17, 46010 Valencia, Spain.9National Children’s Research Centre, Our Lady’s Children’s Hospital, Crumlin, Dublin 12, Ireland. 10Department of Molecular and Cellular Therapeutics, Royal College of
Surgeons in Ireland, York House, York Street, Dublin 2, Ireland.11Department of Pediatrics, Brussels University Hospital, Laarbeeklaan 101, 1090 Brussels, Belgium.12Department of Pediatric Hematology and Oncology, Ghent University Hospital, De Pintelaan 185, 9000 Ghent, Belgium.13Pédiatrie, Hôpital de Jolimont, Rue Ferrer 159, 7100 La Louvière (Haine-Saint-Paul), Belgium.14Department of Clinical Chemistry, Microbiology and Immunology, Ghent University Hospital, De Pintelaan 185, 9000 Ghent, Belgium.
Authors’contributions
AD performed the high-throughput MSP study, was involved in data analysis and drafted the manuscript. MO performed data analysis of the re-expression data and sequencing data, supervised the work and helped draft the manuscript. JH carried out the DAC experiments and the initial high-throughput MSP. KDP was involved in advanced data analysis and helped draft the manuscript. GVP was involved in optimizing the high-throughput MSP experiments. WVC optimized the MBD- seq techniques and was involved in the data analysis of re-expression data. RL, JHS, RN, RLS, AVD, GL and TVM were involved in sample collection and management and helped to define the clinical questions. JV was involved in the mRNA expression
profiling experiments. FS and JVa supervised the entire study and helped draft the manuscript. All authors read and approved the final manuscript.
Competing interests
The authors declare that they have no competing interests.
Received: 30 May 2012 Revised: 12 September 2012 Accepted: 3 October 2012 Published: 3 October 2012
References
1. Øra I, Eggert A:Progress in treatment and risk stratification of neuroblastoma: impact on future clinical and basic research.Semin Cancer Biol2011,21:217-228.
2. Schleiermacher G, Michon J, Ribeiro A, Pierron G, Mosseri V, Rubie H, Munzer C, Bénard J, Auger N, Combaret V, Janoueix-Lerosey I, Pearson A, Tweddle DA, Bown N, Gerrard M, Wheeler K, Noguera R, Villamon E, Cañete A, Castel V, Marques B, de Lacerda A, Tonini GP, Mazzocco K, Defferrari R, de Bernardi B, di Cataldo A, van Roy N, Brichard B,
Ladenstein R,et al:Segmental chromosomal alterations lead to a higher risk of relapse in infants with MYCN-non-amplified localised
unresectable/disseminated neuroblastoma (a SIOPEN collaborative study).Br J Cancer2011,105:1940-1948.
3. Vandesompele J, Baudis M, De Preter K, Van Roy N, Ambros P, Bown N, Brinkschmidt C, Christiansen H, Combaret V, Lastowska M, Nicholson J, O’Meara A, Plantaz D, Stallings R, Brichard B, Van den Broecke C, De Bie S, De Paepe A, Laureys G, Speleman F:Unequivocal delineation of clinicogenetic subgroups and development of a new model for improved outcome prediction in neuroblastoma.J Clin Oncol2005,23:2280-2299. 4. Cohn SL, Pearson ADJ, London WB, Monclair T, Ambros PF, Brodeur GM,
Faldum A, Hero B, Iehara T, Machin D, Mosseri V, Simon T, Garaventa A, Castel V, Matthay KK:The International Neuroblastoma Risk Group (INRG) classification system: an INRG Task Force report.J Clin Oncol2009,27:289-297.
5. Schulte JH, Schowe B, Mestdagh P, Kaderali L, Kalaghatgi P, Schlierf S, Vermeulen J, Brockmeyer B, Pajtler K, Thor T, de Preter K, Speleman F, Morik K, Eggert A, Vandesompele J, Schramm A:Accurate prediction of neuroblastoma outcome based on miRNA expression profiles.Int J Cancer2010,127:2374-2385.
6. Vermeulen J, De Preter K, Naranjo A, Vercruysse L, Van Roy N, Hellemans J, Swerts K, Bravo S, Scaruffi P, Tonini GP, De Bernardi B, Noguera R, Piqueras M, Cañete A, Castel V, Janoueix-Lerosey I, Delattre O, Schleiermacher G, Michon J, Combaret V, Fischer M, Oberthuer A, Ambros PF, Beiske K, Bénard J, Marques B, Rubie H, Kohler J, Pätschger U, Ladenstein R,et al:Predicting outcomes for children with neuroblastoma using a multigene-expression signature: a retrospective SIOPEN/COG/ GPOH study.Lancet Oncol2009,10:663-671.
7. De Preter K, Mestdagh P, Vermeulen J, Zeka F, Naranjo A, Bray I, Castel V, Chen C, Drozynska E, Eggert A, Hogarty MD, Izycka E, London WB, Noguera R, Piqueras M, Bryan K, Schowe B, van Sluis P, Molenaar JJ, Schramm A, Schulte JH, Stallings RL, Versteeg R, Laureys G, Van Roy N, Speleman F, Vandesompele J:miRNA expression profiling enables risk stratification in archived and fresh neuroblastoma tumor samples.Clin Cancer Res2011,17:7684-7692.
8. Portela A, Esteller M:Epigenetic modifications and human disease.Nat Biotechnol2010,28:1057-1068.
9. Teitz T, Wei T, Valentine MB, Vanin EF, Grenet J, Valentine VA, Behm FG, Look AT, Lahti JM, Kidd VJ:Caspase 8 is deleted or silenced preferentially in childhood neuroblastomas with amplification of MYCN.Nat Med2000, 6:529-535.
10. Astuti D, Agathanggelou A, Honorio S, Dallol A, Martinsson T, Kogner P, Cummins C, Neumann HP, Voutilainen R, Dahia P, Eng C, Maher ER, Latif F: RASSF1A promoter region CpG island hypermethylation in
phaeochromocytomas and neuroblastoma tumours.Oncogene2001, 20:7573-7577.
11. Michalowski MB, de Fraipont F, Plantaz D, Michelland S, Combaret V, Favrot M-C:Methylation of tumor-suppressor genes in neuroblastoma: The RASSF1A gene is almost always methylated in primary tumors. Pediatr Blood Cancer2008,50:29-32.
12. Yang Q, Liu S, Tian Y, Hasan C, Kersey D, Salwen HR, Chlenski A, Perlman EJ, Cohn SL:Methylation-associated silencing of the heat shock protein 47 gene in human neuroblastoma.Cancer Res2004,64:4531-4538. Decocket al.Genome Biology2012,13:R95
http://genomebiology.com/2012/13/10/R95
13. Grau E, Martinez F, Orellana C, Canete A, Yañez Y, Oltra S, Noguera R, Hernandez M, Bermudez JD, Castel V:Hypermethylation of apoptotic genes as independent prognostic factor in neuroblastoma disease.Mol Carcinog2010,50:153-162.
14. Banelli B, Gelvi I, Di Vinci A, Scaruffi P, Casciano I, Allemanni G, Bonassi S, Tonini GP, Romani M:Distinct CpG methylation profiles characterize different clinical groups of neuroblastic tumors.Oncogene2005,24:5619-5628. 15. Misawa A, Tanaka S, Yagyu S, Tsuchiya K, Iehara T, Sugimoto T, Hosoi H:
RASSF1A hypermethylation in pretreatment serum DNA of neuroblastoma patients: a prognostic marker.Br J Cancer2009,100:399-404.
16. Murphy DM, Buckley PG, Bryan K, Das S, Alcock L, Foley NH, Prenter S, Bray I, Watters KM, Higgins D, Stallings RL:Global MYCN transcription factor binding analysis in neuroblastoma reveals association with distinct E-box motifs and regions of DNA hypermethylation.PLoS One
2009,4:e8154.
17. Buckley PG, Das S, Bryan K, Watters KM, Alcock L, Koster J, Versteeg R, Stallings RL:Genome-wide DNA methylation analysis of neuroblastic tumors reveals clinically relevant epigenetic events and large-scale epigenomic alterations localized to telomeric regions.Int J Cancer2010, 128:2296-2305.
18. Caren H, Djos A, Nethander M, Sjoberg R-M, Kogner P, Enstrom C, Nilsson S, Martinsson T:Identification of epigenetically regulated genes that predict patient outcome in neuroblastoma.BMC Cancer2011,11:66.
19. Decock A, Ongenaert M, Vandesompele J, Speleman F:Neuroblastoma epigenetics: from candidate gene approaches to genome-wide screenings.Epigenetics2011,6:962-970.
20. Hoque MO, Kim MS, Ostrow KL, Liu J, Wisman GB a, Park HL, Poeta ML, Jeronimo C, Henrique R, Lendvai A, Schuuring E, Begum S, Rosenbaum E, Ongenaert M, Yamashita K, Califano J, Westra W, van der Zee AGJ, Van Criekinge W, Sidransky D:Genome-wide promoter analysis uncovers portions of the cancer methylome.Cancer Res2008,68:2661-2670. 21. Ongenaert M, Wisman GB a, Volders HH, Koning AJ, Zee AGVD, van Criekinge W, Schuuring E:Discovery of DNA methylation markers in cervical cancer using relaxation ranking.BMC Med Genomics2008,1:57. 22. Huss M:Introduction into the analysis of high-throughput-sequencing
based epigenome data.Brief Bioinform2010,11:512-523. 23. Abe M, Ohira M, Kaneda A, Yagi Y, Yamamoto S, Kitano Y, Takato T,
Nakagawara A, Ushijima T:CpG island methylator phenotype is a strong determinant of poor prognosis in neuroblastomas.Cancer Res2005, 65:828-834.
24. Banelli B, Brigati C, Di Vinci A, Casciano I, Forlani A, Borzì L, Allemanni G, Romani M:A pyrosequencing assay for the quantitative methylation analysis of the PCDHB gene cluster, the major factor in neuroblastoma methylator phenotype.Lab Invest2011,92:458-465.
25. Anders S, Huber W:Differential expression analysis for sequence count data.Genome Biol2010,11:R106.
26. Subramanian A, Tamayo P, Mootha VK, Mukherjee S, Ebert BL, Gillette MA, Paulovich A, Pomeroy SL, Golub TR, Lander ES, Mesirov JP:Gene set enrichment analysis: a knowledge-based approach for interpreting genome-wide expression profiles.Proc Natl Acad Sci USA2005, 102:15545-15550.
27. Cole K a, Huggins J, Laquaglia M, Hulderman CE, Russell MR, Bosse K, Diskin SJ, Attiyeh EF, Sennett R, Norris G, Laudenslager M, Wood AC, Mayes P a, Jagannathan J, Winter C, Mosse YP, Maris JM:RNAi screen of the protein kinome identifies checkpoint kinase 1 (CHK1) as a therapeutic target in neuroblastoma.Proc Natl Acad Sci USA2011,108:3336-3341. 28. Ohtaki M, Otani K, Hiyama K, Kamei N, Satoh K, Hiyama E:A robust
method for estimating gene expression states using Affymetrix microarray probe level data.BMC Bioinformatics2010,11:183.
29. Bourdeaut F, Janoueix-Lerosey I, Lucchesi C, Paris R, Ribeiro A, de Pontual L, Amiel J, Lyonnet S, Pierron G, Michon J, Peuchmaur M, Delattre O: Cholinergic switch associated with morphological differentiation in neuroblastoma.J Pathol2009,219:463-472.
30. Janoueix-Lerosey I, Lequin D, Brugières L, Ribeiro A, de Pontual L, Combaret V, Raynal V, Puisieux A, Schleiermacher G, Pierron G, Valteau-Couanet D, Frebourg T, Michon J, Lyonnet S, Amiel J, Delattre O:Somatic and germline activating mutations of the ALK kinase receptor in neuroblastoma.Nature2008,455:967-970.
31. Łastowska M, Viprey V, Santibanez-Koref M, Wappler I, Peters H, Cullinane C, Roberts P, Hall AG, Tweddle DA, Pearson ADJ, Lewis I, Burchill SA, Jackson MS:Identification of candidate genes involved in neuroblastoma
progression by combining genomic and expression microarrays with survival data.Oncogene2007,26:7432-7444.
32. Wang Q, Diskin S, Rappaport E, Attiyeh E, Mosse Y, Shue D, Seiser E, Jagannathan J, Shusterman S, Bansal M, Khazi D, Winter C, Okawa E, Grant G, Cnaan A, Zhao H, Cheung N-K, Gerald W, London W, Matthay KK, Brodeur GM, Maris JM:Integrative genomics identifies distinct molecular classes of neuroblastoma and shows that multiple genes are targeted by regional alterations in DNA copy number.Cancer Res2006, 66:6050-6062.
33. Balamuth NJ, Wood A, Wang Q, Jagannathan J, Mayes P, Zhang Z, Chen Z, Rappaport E, Courtright J, Pawel B, Weber B, Wooster R, Sekyere EO, Marshall GM, Maris JM:Serial transcriptome analysis and cross-species integration identifies centromere-associated protein E as a novel neuroblastoma target.Cancer Res2010,70:2749-2758.
34. Wang K, Diskin SJ, Zhang H, Attiyeh EF, Winter C, Hou C, Schnepp RW, Diamond M, Bosse K, Mayes PA, Glessner J, Kim C, Frackelton E, Garris M, Wang Q, Glaberson W, Chiavacci R, Nguyen L, Jagannathan J, Saeki N, Sasaki H, Grant SFA, Iolascon A, Mosse YP, Cole KA, Li H, Devoto M, McGrady PW, London WB, Capasso M,et al:Integrative genomics identifies LMO1 as a neuroblastoma oncogene.Nature2011,469:216-220. 35. Schmidt ML, Lal A, Seeger RC, Maris JM, Shimada H, O’Leary M, Gerbing RB,
Matthay KK:Favorable prognosis for patients 12 to 18 months of age with stage 4 nonamplified MYCN neuroblastoma: a Children’s Cancer Group Study.J Clin Oncol2005,23:6474-6480.
36. London WB, Castleberry RP, Matthay KK, Look AT, Seeger RC, Shimada H, Thorner P, Brodeur G, Maris JM, Reynolds CP, Cohn SL:Evidence for an age cutoff greater than 365 days for neuroblastoma risk group stratification in the Children’s Oncology Group.J Clin Oncol2005,23:6459-6465. 37. Yagyu S, Gotoh T, Iehara T, Miyachi M, Katsumi Y, Tsubai-Shimizu S,
Kikuchi K, Tamura S, Tsuchiya K, Imamura T, Misawa-Furihata A, Sugimoto T, Sawada T, Hosoi H:Circulating methylated-DCR2 gene in serum as an indicator of prognosis and therapeutic efficacy in patients with MYCN nonamplified neuroblastoma.Clin Cancer Res2008,14:7011-7019. 38. Yang Q, Kiernan CM, Tian Y, Salwen HR, Chlenski A, Brumback BA, London WB, Cohn SL:Methylation of CASP8, DCR2, and HIN-1 in neuroblastoma is associated with poor outcome.Clin Cancer Res2007, 13:3191-3197.
39. Banelli B, Bonassi S, Casciano I, Mazzocco K, Di Vinci A, Scaruffi P, Brigati C, Allemanni G, Borza L, Tonini GP, Romani M:Outcome prediction and risk assessment by quantitative pyrosequencing methylation analysis of the SFN gene in advanced stage, high-risk, neuroblastic tumor patients.Int J Cancer2010,126:656-668.
40. Kamimatsuse A, Matsuura K, Moriya S, Fukuba I, Yamaoka H, Fukuda E, Kamei N, Hiyama K, Sueda T, Hiyama E:Detection of CpG island hypermethylation of caspase-8 in neuroblastoma using an oligonucleotide array.Pediatr Blood Cancer2009,52:777-783.
41. Yang Q, Zage P, Kagan D, Tian Y, Seshadri R, Salwen HR, Liu S, Chlenski A, Cohn SL:Association of epigenetic inactivation of RASSF1A with poor outcome in human neuroblastoma.Clin Cancer Res2004,10:8493-8500. 42. Alaminos M, Davalos V, Cheung N-KV, Gerald WL, Esteller M:Clustering of
gene hypermethylation associated with clinical risk groups in neuroblastoma.J Natl Cancer Inst2004,96:1208-1219.
43. Grau E, Martinez F, Orellana C, Canete A, Yañez Y, Oltra S, Noguera R, Hernandez M, Bermudez JD, Castel V:Epigenetic alterations in disseminated neuroblastoma tumour cells: influence of TMS1 gene hypermethylation in relapse risk in NB patients.J Cancer Res Clin Oncol
2010,136:1415-1421.
44. Petak I, Danam RP, Tillman DM, Vernes R, Howell SR, Berczi L, Kopper L, Brent TP, Houghton JA:Hypermethylation of the gene promoter and enhancer region can regulate Fas expression and sensitivity in colon carcinoma.Cell Death Differ2003,10:211-217.
45. Chaopatchayakul P, Jearanaikoon P, Yuenyao P, Limpaiboon T:Aberrant DNA methylation of apoptotic signaling genes in patients responsive and nonresponsive to therapy for cervical carcinoma.Am J Obstet Gynecol2010,202:281.e1-9.
46. Schaefer JT, Barthlen W, Schweizer P:Ceramide induces apoptosis in neuroblastoma cell cultures resistant to CD95 (Fas/APO-1)-mediated apoptosis.J Pediatr Surg2000,35:473-479.
to Fas-mediated apoptosis in neuroblastoma cells.Cancer Sci2003, 94:598-605.
48. Takamizawa S, Okamoto S, Wen J, Bishop W, Kimura K, Sandler A: Overexpression of Fas-ligand by neuroblastoma: a novel mechanism of tumor-cell killing.J Pediatr Surg2000,35:375-379.
49. Bernassola F, Scheuerpflug C, Herr I, Krammer PH, Debatin KM, Melino G: Induction of apoptosis by IFNgamma in human neuroblastoma cell lines through the CD95/CD95L autocrine circuit.Cell Death Differ1999, 6:652-660.
50. Gross N, Balmas K, Beretta Brognara C, Tschopp J:Expression of Fas (APO-1/CD95) and Fas ligand (FasL) in human neuroblastoma.Med Pediatr Oncol2001,36:111-114.
51. Pedersen WA, Becker LE, Yeger H:Expression and distribution of peripherin protein in human neuroblastoma cell lines.Int J Cancer1993, 53:463-470.
52. Ambros IM, Hata J, Joshi VV, Roald B, Dehner LP, Tüchler H, Pötschger U, Shimada H:Morphologic features of neuroblastoma (Schwannian stroma-poor tumors) in clinically favorable and unfavorable groups. Cancer2002,94:1574-1583.
53. Molenaar JJ, Koster J, Zwijnenburg DA, van Sluis P, Valentijn LJ, van der Ploeg I, Hamdi M, van Nes J, Westerman BA, van Arkel J, Ebus ME, Haneveld F, Lakeman A, Schild L, Molenaar P, Stroeken P, van Noesel MM, Ora I, Santo EE, Caron HN, Westerhout EM, Versteeg R:Sequencing of neuroblastoma identifies chromothripsis and defects in neuritogenesis genes.Nature2012,483:589-593.
54. Chen Y, Stallings RL:Differential patterns of microRNA expression in neuroblastoma are correlated with prognosis, differentiation, and apoptosis.Cancer Res2007,67:976-983.
55. Mestdagh P, Van Vlierberghe P, De Weer A, Muth D, Westermann F, Speleman F, Vandesompele J:A novel and universal method for microRNA RT-qPCR data normalization.Genome Biol2009,10:R64. 56. Schulte JH, Horn S, Otto T, Samans B, Heukamp LC, Eilers U-C, Krause M,
Astrahantseff K, Klein-Hitpass L, Buettner R, Schramm A, Christiansen H, Eilers M, Eggert A, Berwanger B:MYCN regulates oncogenic MicroRNAs in neuroblastoma.Int J Cancer2008,122:699-704.
57. Ragusa M, Majorana A, Banelli B, Barbagallo D, Statello L, Casciano I, Guglielmino MR, Duro LR, Scalia M, Magro G, Di Pietro C, Romani M, Purrello M:MIR152, MIR200B, and MIR338, human positional and functional neuroblastoma candidates, are involved in neuroblast differentiation and apoptosis.J Mol Med (Berl)2010,88:1041-1053. 58. Tan Y-C, Blumenfeld J, Rennert H:Autosomal dominant polycystic kidney
disease: genetics, mutations and microRNAs.Biochim Biophys Acta2011, 1812:1202-1212.
59. Hansen TB, Wiklund ED, Bramsen JB, Villadsen SB, Statham AL, Clark SJ, Kjems J:miRNA-dependent gene silencing involving Ago2-mediated cleavage of a circular antisense RNA.EMBO J2011,30:4414-4422. 60. Teitz T, Lahti JM, Kidd VJ:Aggressive childhood neuroblastomas do not
express caspase-8: an important component of programmed cell death. J Mol Med (Berl)2001,79:428-436.
61. Hoebeeck J, Michels E, Pattyn F, Combaret V, Vermeulen J, Yigit N, Hoyoux C, Laureys G, De Paepe A, Speleman F, Vandesompele J:Aberrant methylation of candidate tumor suppressor genes in neuroblastoma. Cancer Lett2009,273:336-346.
62. Gentleman RC, Carey VJ, Bates DM, Bolstad B, Dettling M, Dudoit S, Ellis B, Gautier L, Ge Y, Gentry J, Hornik K, Hothorn T, Huber W, Iacus S, Irizarry R, Leisch F, Li C, Maechler M, Rossini AJ, Sawitzki G, Smith C, Smyth G, Tierney L, Yang JYH, Zhang J:Bioconductor: open software development for computational biology and bioinformatics.Genome Biol2004,5:R80. 63. Morgan M, Anders S, Lawrence M, Aboyoun P, Pagès H, Gentleman R:
ShortRead: a bioconductor package for input, quality assessment and exploration of high-throughput sequence data.Bioinformatics2009, 25:2607-2608.
64. Lawrence M, Gentleman R, Carey V:rtracklayer: an R package for interfacing with genome browsers.Bioinformatics2009,25:1841-1842. 65. Hellemans J, Mortier G, De Paepe A, Speleman F, Vandesompele J:qBase
relative quantification framework and software for management and automated analysis of real-time quantitative PCR data.Genome Biol2007, 8:R19.
66. Lefever S, Vandesompele J, Speleman F, Pattyn F:RTPrimerDB: the portal for real-time PCR primers and probes.Nucleic Acids Res2009,37:D942-945.
67. Vandesompele J, De Preter K, Pattyn F, Poppe B, Van Roy N, De Paepe A, Speleman F:Accurate normalization of real-time quantitative RT-PCR data by geometric averaging of multiple internal control genes.Genome Biol2002,3, RESEARCH0034.
doi:10.1186/gb-2012-13-10-R95
Cite this article as:Decocket al.:Genome-wide promoter methylation
analysis in neuroblastoma identifies prognostic methylation biomarkers. Genome Biology201213:R95.
Submit your next manuscript to BioMed Central and take full advantage of:
• Convenient online submission
• Thorough peer review
• No space constraints or color figure charges
• Immediate publication on acceptance
• Inclusion in PubMed, CAS, Scopus and Google Scholar
• Research which is freely available for redistribution
Submit your manuscript at www.biomedcentral.com/submit Decocket al.Genome Biology2012,13:R95
http://genomebiology.com/2012/13/10/R95