comm
en
t
re
v
ie
w
s
re
ports
de
p
o
si
te
d r
e
se
a
rch
refer
e
e
d
re
sear
ch
interacti
o
ns
inf
o
rmation
Regulatory conservation of protein coding and microRNA genes in
vertebrates: lessons from the opossum genome
Shaun Mahony
*
, David L Corcoran
†
, Eleanor Feingold
†‡
and
Panayiotis V Benos
*†§
Addresses: *Department of Computational Biology, School of Medicine, University of Pittsburgh, Fifth Avenue, Pittsburgh, PA 15260, USA. †Department of Human Genetics, Graduate School of Public Health, University of Pittsburgh, DeSoto Street, Pittsburgh, PA 15261, USA. ‡Department of Biostatistics, Graduate School of Public Health, University of Pittsburgh, DeSoto Street, Pittsburgh, PA 15261, USA. §University
of Pittsburgh Cancer Institute, School of Medicine, University of Pittsburgh, Centre Avenue, Pittsburgh, PA 15232, USA.
Correspondence: Panayiotis V Benos. Email: [email protected]
© 2007 Mahony et al.; licensee BioMed Central Ltd.
This is an open access article distributed under the terms of the Creative Commons Attribution License (http://creativecommons.org/licenses/by/2.0), which permits unrestricted use, distribution, and reproduction in any medium, provided the original work is properly cited.
Regulatory conservation
<p>A study of conservation of non-coding sequences, <it>cis</it>-regulatory elements and biological functions of regulated genes in opos-sum and other vertebrates enables better estimation of promoter conservation and transcription factor binding site turnover among mam-mals</p>
Abstract
Background: Being the first noneutherian mammal sequenced, Monodelphis domestica (opossum)
offers great potential for enhancing our understanding of the evolutionary processes that take place in mammals. This study focuses on the evolutionary relationships between conservation of
noncoding sequences, cis-regulatory elements, and biologic functions of regulated genes in opossum
and eight vertebrate species.
Results: Analysis of 145 intergenic microRNA and all protein coding genes revealed that the
upstream sequences of the former are up to twice as conserved as the latter among mammals, except in the first 500 base pairs, where the conservation is similar. Comparison of promoter conservation in 513 protein coding genes and related transcription factor binding sites (TFBSs) showed that 41% of the known human TFBSs are located in the 6.7% of promoter regions that are conserved between human and opossum. Some core biologic processes exhibited significantly fewer conserved TFBSs in human-opossum comparisons, suggesting greater functional divergence. A new measure of efficiency in multigenome phylogenetic footprinting (base regulatory potential rate [BRPR]) shows that including human-opossum conservation increases specificity in finding human TFBSs.
Conclusion: Opossum facilitates better estimation of promoter conservation and TFBS turnover among mammals. The fact that substantial TFBS numbers are located in a small proportion of the human-opossum conserved sequences emphasizes the importance of marsupial genomes for phylogenetic footprinting-based motif discovery strategies. The BRPR measure is expected to help select genome combinations for optimal performance of these algorithms. Finally, although the etiology of the microRNA upstream increased conservation remains unknown, it is expected to have strong implications for our understanding of regulation of their expression.
Published: 16 May 2007
Genome Biology 2007, 8:R84 (doi:10.1186/gb-2007-8-5-r84)
Received: 6 November 2006 Revised: 29 January 2007 Accepted: 16 May 2007 The electronic version of this article is the complete one and can be
Background
One of the prime motivating factors driving the sequencing of vertebrate genomes is the expectation that the role played by the functional regions of the human genome may be dis-cerned by finding molecular level commonalities with and differences from other animals. This is especially true of the
newly sequenced opossum (Monodelphis domestica), which
is the first completed marsupial genome. Being the first non-eutherian mammal sequenced, the opossum helps to clarify which sequence changes occurred before and after the diver-gence of mammalian ancestors from other vertebrates [1], and has already provided new insight into the evolution of mammalian major histocompatibility complex genes [2]. It is also hoped that the opossum genome may yield insights into how gene regulation has evolved in vertebrates.
In protein coding genes, gene regulation is primarily control-led by short DNA sequences in the vicinity of the gene's tran-scription start sites (TSSs), which are targets for trantran-scription factor proteins. A high degree of evolutionary conservation of
these promoter regions can be attributed to functional cis
-regulatory elements. The increased conservation in the bio-logically more important parts of the promoter region has been explored by various phylogenetic footprinting algo-rithms, such as PhyloGibbs [3], ConSite [4], rVista [5], and FOOTER [6], to improve the prediction of transcription fac-tor binding sites (TFBSs) in vertebrate genomes. Phyloge-netic footprinting is a comparative genomics approach that exploits cross-species sequence conservation in order to pre-dict regulatory genomic elements. In the absence of evolu-tionary information, TFBSs can be evaluated in terms of sequence similarity scans against frequency matrices derived from alignments of known binding sites for a given transcrip-tion factor [7]. However, the typical short length of TFBSs (5 to 20 base pairs [bp]) and their inherent level of sequence degeneracy makes them notoriously difficult to predict with any degree of specificity using similarity searches alone [8]. Phylogenetic footprinting provides a way to reduce the sequence search space to regions that are conserved (and therefore more likely to contain functional elements), thereby improving the specificity of TFBS prediction.
In order to improve the performance of phylogenetic foot-printing algorithms, the evolutionary aspects of the promoter regions and the TFBSs residing in them must be investigated. Evolutionary distance is an important factor in the effective-ness of phylogenetic footprinting techniques. For example, the divergence between chimpanzee and human is generally insufficient to reduce the sequence search space in any
mean-ingful way; conversely, the divergence between Drosophila
and human can be too large for any regulatory sequence con-servation to be detected. Recently, the maximum sensitivity of phylogenetic footprinting techniques has been measured via estimations of the rate of TFBS 'turnover' between human and rodent genomes [9-13]. We consider that a TFBS has undergone turnover if the sequence in which it resides is not
conserved between the species compared. High or low TFBS turnover rates do not necessarily coincide with the rate of changes in the regulatory mechanism (for instance, replace-ment TFBSs can arise by chance elsewhere in the promoter region or functional TFBSs may still be present in noncon-served regions). Turnover, however, corresponds to the min-imum false-negative rate for detection of TFBSs via phylogenetic footprinting, and thus it serves as a critical bound on the success of such algorithms. Human-rodent TFBS turnover has been estimated at between 28% and 40% [9-13], suggesting that TFBSs are among the most malleable functional elements in the genomic landscape. However, although rodents and primates diverged relatively recently (approximately 90 million years ago [14]), the shorter gener-ational time of rodents has placed a large degree of dissimilar-ity between the two clades, as is evident in the human-dog comparisons [15]. Therefore, TFBS turnover rates will have to be estimated in other mammals before a clearer picture of the selective pressure on mammalian TFBSs can emerge.
Another major mechanism for control of gene expression is provided by microRNA (miRNA) genes. miRNAs are small (22 to 61 bp long), noncoding RNAs that downregulate their target genes via base complementarity to their mRNA mole-cules [16,17]. Each miRNA can target multiple genes and each gene can be targeted by multiple miRNAs [18-21]. In verte-brates, their expression is tissue specific [22] and has been shown to play an important role during development [23-25]. Although some miRNAs are found in the introns of coding genes and therefore are probably regulated by the promoters of the genes in which they reside [26], others are located in the intergenic parts of the genome. Little is known about the transcriptional regulation of these intergenic miRNAs, although RNA polymerase II appears to be involved in the process [27]. This suggests that they may have active
pro-moter regions that contain cis-regulatory elements, similar to
coding genes. The following question then arises; how does the conservation in the upstream regions of the intergenic miRNA genes compare with that of the protein coding genes? In this respect, opossum and the other vertebrate species pro-vide a broad range of evolutionary distances in which this issue may be addressed.
comm
en
t
re
v
ie
w
s
re
ports
refer
e
e
d
re
sear
ch
de
p
o
si
te
d r
e
se
a
rch
interacti
o
ns
inf
o
rmation
regulatory mechanisms are shared between all mammals. For these reasons, the conservation rates of the promoters of 513 human genes are also analyzed in relation to the turnover of the 1,162 TFBSs they contain. Relationships between conser-vation of sites and identity of the corresponding transcription factors and their Gene Ontology (GO) [28] categories are also investigated. Finally, we computationally re-evaluate the potential of phylogenetic footprinting in the light of the opos-sum genome and other recently sequenced vertebrates. A new statistical measure, the base regulatory potential rate (BRPR), is introduced to assess the efficiency of both pair-wise and multiple species comparisons in phylogenetic foot-printing strategies.
Results and discussion
Distribution of conserved blocks in the upstream regions of protein coding and intergenic miRNA genes
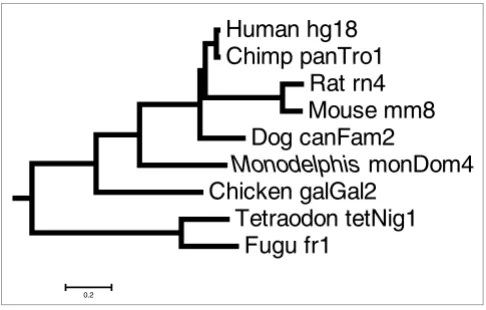
Conservation of the 5 kilobases (kb) upstream regions of all RefSeq protein coding genes as well as the known intergenic miRNA genes was calculated using the sliding window approach, as we describe in Materials and methods (below). We chose to focus solely on intergenic miRNAs because intronic miRNAs have been shown to be co-transcribed with their corresponding protein coding genes [26]. Because little is known about the transcriptional regulation of non-intronic miRNA genes, we cannot assess the possible TFBS turnover. We can, however, assess whether the miRNA upstream regions evolve at the same, slower, or faster rate than those of the protein coding genes, and whether their conservation pat-tern across the upstream region indicates parts of potential biologic importance. The phylogenetic tree of the species examined in this paper is plotted in Figure 1.
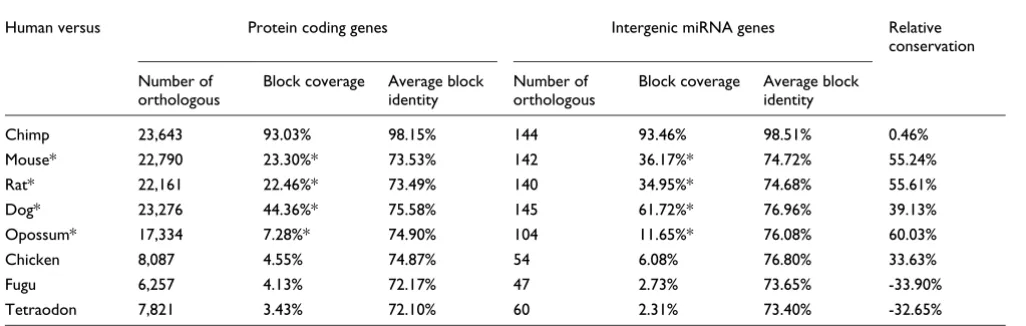
Table 1 presents the number of orthologous genes in each spe-cies (derived from the MULTIZ University of California,
Santa Cruz [UCSC] synteny-based alignments), the average block coverage of their upstream regions, and the average percentage identity within these conserved blocks. For the calculation of the average percentage identity, the conserva-tion percentage of each block is multiplied by the total length of the block. In other words, the average block conservation corresponds to the number of bases that are identical in all conserved blocks of one promoter over the total length of the blocks in this promoter. The human genes were used as refer-ence for all pair-wise comparisons. Surprisingly, we found that, with the exception of teleosts and chimp, the conserva-tion in the upstream regions of the miRNA genes is 34% to 60% higher on average than that in the protein coding genes. This is independent of the average block identity, which remains practically the same between the two types of genes in these comparisons (Table 1). In all nonprimate mammals the average block coverage in the miRNA upstream sequences is significantly higher than that in the promoters of the
pro-tein coding genes (Wilcoxon rank-sum test: P = 6 × 10⁻⁴ for
opossum and P = 10-14 to 10-16 for rodents and dog).
In order to investigate this surprising finding further, we plot-ted the sequence conservation as a function of the distance from the start of the corresponding genes (Figure 2). We found that in the first 500 bp the sequence conservation of the miRNA genes is almost identical to that of the promoters of
the protein coding genes (R values > 0.9 and usually much
higher; regression t-test: P < 10-19). In protein coding genes
this is typically the region with the highest concentration of
the known cis-regulatory elements. From all known human
and mouse TFBSs in TRANSFAC [29], 69.1% and 65.1%, respectively, are annotated as being located in the proximal 500 bp region (data not shown). Interestingly, Lee and cow-orkers [27] showed that this region is sufficient to drive expression of the miR 23a~27a~24-2 intergenic miRNA gene cluster by RNA polymerase II. Could this be a coincidence? We tested this by analyzing the upstream sequence conserva-tion of the tRNA genes in the human genome (see Materials and methods, below). It has been long established that the
cis-regulatory elements of the tRNA genes are located
down-stream of their transcription start [30]. We found that the sequence conservation for the tRNA genes was constant throughout their 5 kb upstream regions (Figure 2; green dashed line).
The conservation rates in both protein coding and miRNA genes decline after the first 500 bp and become almost con-stant. The difference between these two types of genes is that, in the case of miRNAs, the constant conservation rate is up to twofold higher than that in the protein coding genes for rodents, dog, opossum, and chicken. We found this difference to be statistically significant (Additional data file 1 [Supple-mentary Figure 2]). Similarly high conservation rates are observed in chimp for both types of genes, probably reflecting the generally high conservation rate throughout the genome. By contrast, similarly low conservation rates are observed for
[image:3.612.54.297.86.241.2]Phylogenetic tree of the species examined in this study
Figure 1
Phylogenetic tree of the species examined in this study. This phylogenetic tree is based on the University of California, Santa Cruz (UCSC) multiple alignments. The tree was generated using phyloGif [72].
Human hg18
Chimp panTro1
Rat rn4
Mouse mm8
Dog canFam2
Monodelphis
monDom4
Chicken galGal2
Tetraodon tetNig1
Fugu fr1
the fugu fish and tetraodon. We note, however, that the higher conservation rates are statistically significant only in the (nonprimate) mammals, including opossum (Additional data file 1).
It is not clear whether this increased upstream sequence con-servation is a general biologic feature of the miRNA upstream regions or is an artifact of the methods used to discover miRNA genes. It is possible, for example, that the known intergenic miRNAs happen to fall in more conserved regions of the genome. This may be related to the way in which the miRNAs were originally identified (through high similarity to known miRNAs). However, it is also possible that because miRNAs are involved in highly regulated vital cell or organis-mal processes such as development [23-25], there is a much greater selective pressure on their regulatory regions. We investigate this further by comparing the upstream sequence conservation in the miRNA genes with that of genes identified as developmental according to GO classification (Figure 2; light blue dashed line). We find that the upstream conserva-tion of the developmental genes in all mammals is uniformly higher than the overall average and similar to the conserva-tion of the miRNA genes, especially in the first 2,000 bp. This is true for all species examined, although in the nonmamma-lian vertebrates the overall upstream sequence conservation for all types of genes is similarly low (10% or lower after the first 500 bp; Figure 2). The fact that miRNA genes have been implicated in the regulation of various developmental proc-esses [31] may partly explain the similar conservation rates in their upstream regions and the promoters of the
developmen-tal genes, also indicating that analogous mechanisms and cis
-elements may regulate the expression of the corresponding genes. The fact that opossum sequences also exhibit similar conservation patterns, as do the sequences of eutherian
spe-cies, indicates that mammalian specific evolutionary con-straints are in place.
In summary, the above observations are consistent with the idea that miRNAs are regulated by similar mechanisms as protein coding genes, which was also shown to be true in the few cases studied thus far [27,32]. As more miRNA genes are identified, the issue of their transcriptional mechanism will warrant further investigation.
In all of the above pair-wise comparisons, except human-chimp, the average block identity is about the same (72% to 77%; Table 1), regardless of the evolutionary distance or the type of gene (protein coding or miRNA). Because the block conservation threshold was 65%, this equivalency indicates that a reduction in the number of conserved blocks rather than a uniform decrease in similarity is responsible for the observed conservation rates. Such a pattern of evolution is
expected if the cis-regulatory sites are organized in clusters
located in these upstream regions. Such clusters might con-tain regulatory elements specific to, for instance, primates only, eutherians only, and so on.
Evolutionary turnover of transcription factor binding sites in vertebrates
We now turn to the relationship between promoter
conserva-tion of the protein coding genes and the turnover of the cis
-regulatory elements located in them. Table 2 presents the per-centage of known human TFBSs that reside in conserved blocks for each pair of genomes tested. The number of such detectable TFBSs in each species differs depending on the number of orthologous genes identified in that species. We note that our analysis focuses on the TFBSs that are located immediately upstream of the protein coding genes (up to 5 kb). This bias is imposed by the available data. It will be
inter-Table 1
Conservation in the 5 kilobases upstream sequences in all protein coding and intergenic miRNA genes
Human versus Protein coding genes Intergenic miRNA genes Relative
conservation
Number of orthologous
Block coverage Average block identity
Number of orthologous
Block coverage Average block identity
Chimp 23,643 93.03% 98.15% 144 93.46% 98.51% 0.46%
Mouse* 22,790 23.30%* 73.53% 142 36.17%* 74.72% 55.24%
Rat* 22,161 22.46%* 73.49% 140 34.95%* 74.68% 55.61%
Dog* 23,276 44.36%* 75.58% 145 61.72%* 76.96% 39.13%
Opossum* 17,334 7.28%* 74.90% 104 11.65%* 76.08% 60.03%
Chicken 8,087 4.55% 74.87% 54 6.08% 76.80% 33.63%
Fugu 6,257 4.13% 72.17% 47 2.73% 73.65% -33.90%
Tetraodon 7,821 3.43% 72.10% 60 2.31% 73.40% -32.65%
[image:4.612.55.568.118.281.2]comm en t re v ie w s re ports refer e e d re sear ch de p o si te d r e se a rch interacti o ns inf o rmation
Upstream sequence conservation of protein coding versus miRNA genes
Figure 2
Upstream sequence conservation of protein coding versus miRNA genes. Comparison of 5-kilobase upstream sequence conservation between human and various organisms, relative to the transcription start site (TSS; protein-coding, solid blue line) and gene start (intergenic microRNA [miRNA] genes, orange line). The conservation of developmental genes (light blue dotted line) and tRNA genes (green dotted line) are also plotted for comparison purposes. For the plot 100 base pair (bp) intervals were used for the first 500 bp and 500 bp intervals thereafter.
Human-chimp 0.00 0.10 0.20 0.30 0.40 0.50 0.60 0.70 0.80 0.90 1.00
-5,500 -4,500 -3,500 -2,500 -1,500 -500
Distance from start
Conserved block coverage
Coding miRNA Develop tRNA Human-mouse 0.00 0.10 0.20 0.30 0.40 0.50 0.60 0.70
-5,500 -4,500 -3,500 -2,500 -1,500 -500
Distance from start
Conserved block coverage
Coding miRNA Develop tRNA Human-rat 0.00 0.10 0.20 0.30 0.40 0.50 0.60 0.70
-5,500 -4,500 -3,500 -2,500 -1,500 -500
Distance from start
Conserved block coverage
Coding miRNA Develop tRNA Human-dog 0.00 0.10 0.20 0.30 0.40 0.50 0.60 0.70
-5,500 -4,500 -3,500 -2,500 -1,500 -500
Distance from start
Conserved block coverage
Coding miRNA Develop tRNA Human-opossum 0.00 0.10 0.20 0.30 0.40 0.50 0.60 0.70
-5,500 -4,500 -3,500 -2,500 -1,500 -500
Distance from start
Conserved block covera
ge Coding miRNA Develop tRNA Human-chicken 0.00 0.10 0.20 0.30 0.40 0.50 0.60 0.70
-5,500 -4,500 -3,500 -2,500 -1,500 -500
Distance from start
Conserved block covera
ge Coding miRNA Develop tRNA Human-fugu 0.00 0.10 0.20 0.30 0.40 0.50 0.60 0.70
-5,500 -4,500 -3,500 -2,500 -1,500 -500
Distance from start
Conserv
e
d block coverage
Coding miRNA Develop tRNA Human-tetraodon 0.00 0.10 0.20 0.30 0.40 0.50 0.60 0.70
-5,500 -4,500 -3,500 -2,500 -1,500 -500
Distance from start
Conserv
e
d block coverage
Coding miRNA
esting to see how our results compare with the evolution of DNA regulatory regions in other parts of the genome.
Although we confirm previously estimated rate of human-mouse TFBS turnover [9-13], it is particularly interesting that 27% or more of the known human TFBSs are not located in blocks conserved in mammals more distant than rodents (Table 2). This does not necessarily mean that the mecha-nisms of gene regulation have changed accordingly. Func-tionally equivalent TFBSs are not always located in conserved blocks, as demonstrated in a recent comparison of gene regulation in human and zebrafish RET genes [33]. Similarly, individual TFBSs that are not conserved between two species may have been functionally replaced by other sites for the same transcription factor in one of the species [34]. The find-ing that only about 41% of TFBSs are located in conserved human-opossum blocks is nevertheless surprising, because it points to the relative ease with which individual mammalian TFBSs may be deleted, replaced, or added.
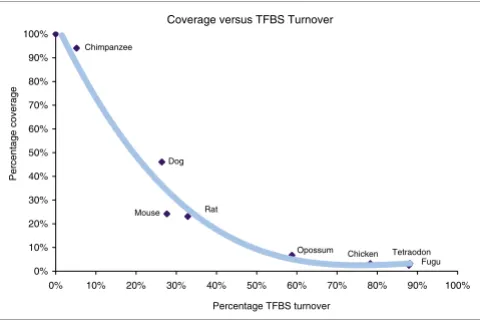
As expected, TFBS turnover increases with decreasing per-centage conservation coverage of the upstream regions. Fig-ure 3 shows that opossum has low block conservation similar to that in the nonmammal vertebrate species, but it retains almost twice as many sites as chicken, which is the evolutionarily closest nonmammal. This gives a first qualita-tive assessment for the potential importance of the opossum genome for identification of TFBSs in phylogenetic footprint-ing approaches. In general, outside mammalian genomes, the percentage of the detected TFBSs is reduced with increasing evolutionary distance, although the percentage 5 kb upstream coverage remains constant.
Table 2 also presents the average identity within the con-served TFBSs. With the exception of human-chimp compari-sons, the average identity within sites is substantially higher than the average identity in the conserved blocks and
rela-tively constant in all genome comparisons. We found no lin-ear correlation between the block coverage rate and the
average block identity in these comparisons (R = 0.48). This
finding supports the idea that individual TFBSs are under greater selective pressure than are the wider conserved blocks
in mammalian genomes (Wilcoxon test: P = 0.01).
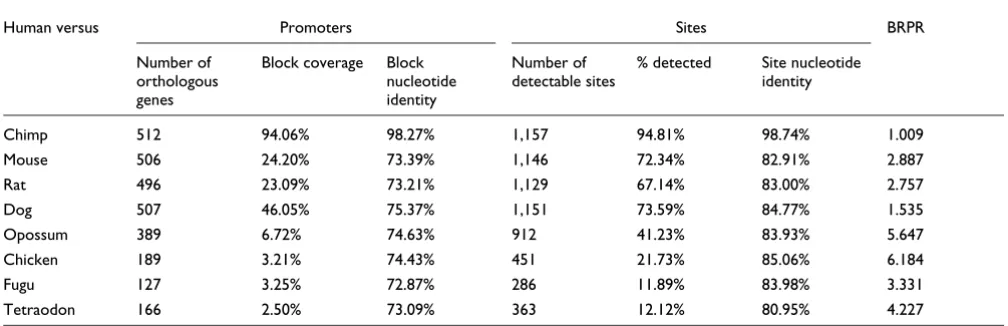
Finally, Table 2 presents the BRPR values for each pair of genomes (see Materials and methods, below). BRPR is the likelihood ratio of the posterior probability of a base being regulatory (part of a regulatory site), given that it is in a
con-served region, over the a priori probability of being
regula-tory. In other words, BRPR shows how much we can improve our belief that a base (or a conserved region) is regulatory if we only focus on the conserved blocks between two or more species. One of the most surprising aspects of this study is that, on average, a relatively large percentage of TFBSs (41%) is located in only the 6.72% of the 5 kb promoter regions that are conserved between human and opossum. This gives human-opossum comparisons the second highest BRPR value among the tested pair-wise comparisons, and makes the use of opossum almost twice as effective for finding regu-latory elements as the more typically used human-mouse alignments (BRPR 5.647 versus 2.887, respectively). Another interesting finding is that, because of the extensive conserva-tion between human and dog genomes, the human-dog com-parisons are not as effective as human-mouse for phylogeny-based motif discovery (Table 2). The maximum BRPR value occurs for human-chicken comparisons (BRPR 6.184). How-ever, this value is very close to the opossum BRPR value and, given that only 22% of known TFBSs can be detected as con-served between human and chicken (as opposed to 41% in human-opossum), we suggest that human-opossum compar-isons are more effective overall than human-chicken comparisons.
Phylogenetic footprinting becomes less effective in human-fugu and human-tetraodon comparisons (Table 2). The Afrotherian (elephant and tenrec) or Xenarthran (armadillo) genomes that are currently undergoing low-coverage sequencing, as well as the genomes of more distant verte-brates, do not appear to offer any improvement in pair-wise phylogenetic footprinting effectiveness (all are less effective than using the mouse genome; unpublished data). However, they may offer improvement in specificity in multispecies reg-ulatory conservation scans.
Phylogenetic footprinting with multispecies alignments
Thus far, the TFBS turnover rates and BRPR values were used in pair-wise comparisons in order to assess the relative effec-tiveness of discovering TFBSs via evolutionary conservation. Given the availability of multiple vertebrate genomes, it is naturally expected that combining conservation information from multiple sources will increase the accuracy of phyloge-netic footprinting. The following question then arises; which
[image:6.612.58.298.87.249.2]Conserved block coverage of the 5 kilobases upstream regions versus TFBS turnover rates
Figure 3
Conserved block coverage of the 5 kilobases upstream regions versus TFBS turnover rates. A third-order polynomial trendline is fitted for illustration. TFBS, transcription factor binding site.
Coverage versus TFBS Turnover
0% 10% 20% 30% 40% 50% 60% 70% 80% 90% 100%
0% 10% 20% 30% 40% 50% 60% 70% 80% 90% 100% Percentage TFBS turnover
Percentage coverage
Dog
Rat Mouse
comm
en
t
re
v
ie
w
s
re
ports
refer
e
e
d
re
sear
ch
de
p
o
si
te
d r
e
se
a
rch
interacti
o
ns
inf
o
rmation
genome combinations offer greater specificity? To address this, we evaluate all possible combinations of tested genomes (256 combinations). In the following, P(C) and P(C|R) are the prior and posterior probability, respectively, that a base is conserved, given that the base is part of a regulatory site. For
consistency, both P(C) and P(C|R) are calculated over all
known human sites in our dataset (1,162 sites) in all examined human upstream bases (513 genes × 5,000 bp = 2.565 mega-bases), regardless of the species we compare.
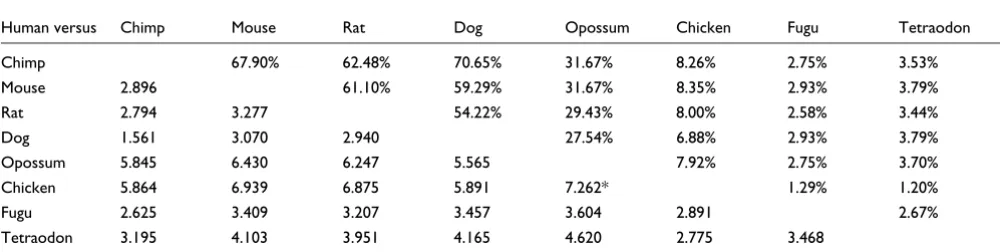
Table 3 shows the BRPR values for all comparisons between human and two other species. Interestingly, the highest
BRPR value in three species comparisons is achieved when human sequences are compared with both opossum and chicken (BRPR 7.26). However, only 92 of the 1,162 known human TFBSs (7.9%) may be found via this strategy. Table 3 also shows that requiring a base to be conserved with both mouse and opossum is more effective than using either genome alone, and 31.7% of known human TFBSs may be detected in this way. The results of all tests (256 combina-tions) are provided in Additional data file 1. The combination with the overall highest BRPR value was human with chimp, mouse, opossum, and chicken (BRPR 7.628). We note that this maximum BRPR score places a cap on the possible value
of P(R). In the unlikely event that all
human-chimp-mouse-opossum-chicken conserved bases are part of TFBSs (that is,
assuming P(R|C) = 1), then the maximum value of P(R) from
Equation 1 (see materials and methods, below) is (7.628)-1. If
[image:7.612.53.557.118.281.2]we extrapolate, then we find that a maximum of 655 bp may be regulatory in the average human 5 kb upstream region. Taking the average size of a TFBS in the JASPAR database [35] of high-quality binding sites (10.658 bp) suggests that no more than 61.5 nonoverlapping TFBSs are present in the average 5 kb upstream region. This maximum value is in agreement with previous reports that estimate this number to be between 10 and 50 sites, depending on the promoter [36,37]. The addition of six more (as yet unpublished) verte-brate species in this analysis did not yield a combination of
Table 2
Promoter and site conservation between human and eight vertebrate species
Human versus Promoters Sites BRPR
Number of orthologous genes
Block coverage Block nucleotide identity
Number of detectable sites
% detected Site nucleotide identity
Chimp 512 94.06% 98.27% 1,157 94.81% 98.74% 1.009
Mouse 506 24.20% 73.39% 1,146 72.34% 82.91% 2.887
Rat 496 23.09% 73.21% 1,129 67.14% 83.00% 2.757
Dog 507 46.05% 75.37% 1,151 73.59% 84.77% 1.535
Opossum 389 6.72% 74.63% 912 41.23% 83.93% 5.647
Chicken 189 3.21% 74.43% 451 21.73% 85.06% 6.184
Fugu 127 3.25% 72.87% 286 11.89% 83.98% 3.331
Tetraodon 166 2.50% 73.09% 363 12.12% 80.95% 4.227
Analysis of 1,162 known human transcription factor binding sites (TFBSs) associated with the promoters of 513 human genes between human and eight vertebrate species. The number of genes orthologous to human genes in each species, their conservation block coverage, and their average block identity are presented; also, the number of TFBSs associated with these orthologous genes in each species, the percentage of sites located in conserved regions between species, and the average nucleotide identity within TFBSs are reported. The base regulatory potential rate (BRPR) statistic is calculated from these data for each pair of genomes (see text). Block coverage is the percentage of the upstream region that is covered by conserved blocks (>50 base pairs with >65% identity); the block nucleotide identity is the percentage of nucleotides in all conserved blocks that are identical to the human sequence; and site nucleotide identity the percentage nucleotides in all detected TFBSs that are identical to the human sequence.
[image:7.612.54.297.440.603.2]Association between BRPR scores and detectable sites
Figure 4
Association between BRPR scores and detectable sites. For each given percent of detectable transcription factor binding sites (TFBSs), the combination of aligned genomes with the highest base regulatory potential rate (BRPR) value will yield the smaller conserved region (for phylogenetic footprinting algorithm searches). The full list of genome combinations and their BRPR values are given in Additional data file 1. The blue line presents the association between percentage of human TFBSs located in conserved regions in a combination of genomes with this BRPR value among all possible genome combinations in this study (see text for detailed description). The grey line plot is similar after the opossum genome is omitted (see text). BRPR, base regulatory potential rate.
0 10 20 30 40 50 60 70 80 90 100
0 1 2 3 4 5 6 7 8
BRPR threshold (relative specificity)
Percentage TFBS detection rate (sensitivity)
genomes with a higher BRPR than the human-chimp-mouse-opossum-chicken combination (data not shown).
Most phylogenetic footprinting approaches use evolutionary conservation in order to reduce the search space to the parts of the promoters that are more likely to contain functional
cis-regulatory elements (for example, see the reports by
San-delin and coworkers [4] and Loots and Ovcharenko [5]). As combinations of more than two genomes are considered, the search space (the jointly conserved region) is reduced. At the same time, the number of sites located within these conserved regions is reduced as well, although at a slower rate. One might then ask, for a given percentage of detectable sites (maximum site sensitivity), which is the combination that minimizes the search space (thereby maximizing specificity)? We found that BRPR scores can be used to address this
ques-tion. BRPR scores are reversely proportional to P(C), which is
the a priori conservation probability (Equation 1; see Materi-als and methods, below). Thus, the lower the BRPR score, the larger the conserved region and the greater the chance that false-positive TFBS predictions will be made. Therefore, for a given percentage of detectable sites, one wishes to choose the combination of genomes with high BRPR values.
We ranked each of the 1,162 tested human TFBSs according to the highest BRPR value from the combinations of genomes that could detect the given site. From this ranking of sites, it may be seen that some subsets of highly conserved TFBSs may be detected at much higher BRPR thresholds than those sites that are conserved only with closely related species. The proportion of TFBSs that may be detected for a given BRPR threshold is plotted in Figure 4 (blue line). This figure shows, for example, that in order to guarantee detection of 75% or more of the known TFBSs, one should choose a combination of genomes with BRPR value of 1.7 or less. Naturally, these will be closely related species. By contrast, the combination of genomes with the overall maximum BRPR score (human-chimp-mouse-opossum-chicken, BRPR 7.628) includes only about 7.7% of the known TFBSs in its conserved regions,
whereas the lowest possible BRPR score (human-chimp, BRPR 1.009) includes about 98%. BRPR values may be more appropriate than evolutionary distance for the purposes of weighting contributions when aiming to discover constrained regulatory sequences in multispecies alignments. We there-fore suggest that when it comes to regulatory regions, the BRPR score may be more useful that the 'conservation scores' currently employed in phastCons [38] or MCS [39] approaches.
Figure 4 also shows the importance of including the opossum genome in the comparisons. The grey line displays the same graph, but excluding the opossum genome from the plotted combinations. Without including the opossum genome, the BRPR threshold must be reduced to 3.5 before 20% of the known TFBSs may be found in the conserved regions. How-ever, with the opossum included, the BRPR threshold for the same search may be increased to 6.5, indicating analogous reduction in the search space. Figure 4 shows that opossum's greatest contribution in terms of phylogenetic footprinting efficiency is for the sensitivity values in the range of 10% to 33%, although smaller improvements are observed in the 55% to 65% range. The 'blocky' nature of the plot is attributable to the subsets of known TFBSs that are detectable in each of the eight species. As more distant mammalian genomes are
sequenced, this plot may smooth out to give higher P(R|C)
scores to more of the known TFBSs.
[image:8.612.57.557.118.244.2]Our preliminary results including unpublished genomes show that more sites may be predicted with increased BRPR thresholds. Only 20 human sites (1.72% of known TFBSs) are not detected by any combinatorial approach, suggesting that only a small minority of human TFBSs may not be conserved in any other species. It should also be noted that without the chimp genome, a maximum of 86.5% of the sites can be iden-tified as conserved, suggesting that only 13.5% of known human TFBSs may be conserved only among primates. This is an interesting finding, because it establishes 86.5% as an upper limit to the proportion of TFBSs that may be found
Table 3
Three-way comparisons between human and two other vertebrate species
Human versus Chimp Mouse Rat Dog Opossum Chicken Fugu Tetraodon
Chimp 67.90% 62.48% 70.65% 31.67% 8.26% 2.75% 3.53%
Mouse 2.896 61.10% 59.29% 31.67% 8.35% 2.93% 3.79%
Rat 2.794 3.277 54.22% 29.43% 8.00% 2.58% 3.44%
Dog 1.561 3.070 2.940 27.54% 6.88% 2.93% 3.79%
Opossum 5.845 6.430 6.247 5.565 7.92% 2.75% 3.70%
Chicken 5.864 6.939 6.875 5.891 7.262* 1.29% 1.20%
Fugu 2.625 3.409 3.207 3.457 3.604 2.891 2.67%
Tetraodon 3.195 4.103 3.951 4.165 4.620 2.775 3.468
comm
en
t
re
v
ie
w
s
re
ports
refer
e
e
d
re
sear
ch
de
p
o
si
te
d r
e
se
a
rch
interacti
o
ns
inf
o
rmation
using traditional phylogenetic footprinting techniques with mouse or more distantly related species. If complete detec-tion of all funcdetec-tional human TFBSs is required, then the phy-logenetic shadowing technique for comparing closely related species, proposed by Boffelli and colleagues [40,41], may be more effective than traditional phylogenetic footprinting for primate-specific TFBSs. However, as suggested by those authors, at least six primate genome sequences other than human will be required before phylogenetic shadowing will become effective [40]. Another interesting approach is pre-sented in the recent report by Donaldson and Göttgens [42], which used the mouse genome as an outgroup compared with human and chimpanzee promoters in order to discover regu-latory motifs that are conserved in one but not the other [42].
Exploring dependencies between transcription factor binding site nucleotide conservation and the associated transcription factors
As noted above, the nucleotide conservation within the human TFBSs (as compared with other vertebrates) is higher than the percentage identity in the conserved blocks where they reside (Table 2). This is expected because the regulatory nucleotides may be under stronger evolutionary pressure. Similarly, one would expect that high information content positions (the most conserved positions of the motif) are crit-ical for the binding and thus would also be most conserved across species. This assumption does not take into consideration possible differences in the binding protein res-idues between species, but it has been shown to be correct for individual yeast and fruit fly transcription factors [43,44]. However, this dependence appears to become weaker when average conservation data are calculated over positions from different vertebrate transcription factors.
From the transcription factors included in our dataset, 80 have a position-specific scoring matrix (PSSM) binding model in JASPAR [45] or our manually curated set of mam-malian motifs [6,46]. These transcription factors are associ-ated with 544 sites in our dataset. The PSSM model of the corresponding transcription factor was used to scan each of its sites from our dataset (see Materials and methods, below). Sometimes the recorded sites extend beyond the length of the PSSM model, reflecting the biochemical method used to dis-cover these sites (for example, DNA footprinting). The high-est scoring (sub)sequence was considered to be the correct target site (TFBS), and conservation of each of its nucleotides was calculated for the species in which the site was conserved. The results are plotted in Figure 5, sorted by information con-tent of the corresponding PSSM columns. A weak but definite trend is present in the nonprimate genomes, although even transcription factor motif positions with zero information content (typically assumed to be under no selective pressure) are conserved at a higher rate than the wider conserved blocks. This finding suggests that natural selection operates almost equally strongly across the TFBS positions, regardless of the perceived role of the nucleotide in protein-DNA inter-actions. One possible explanation for the observed trends is that some motif positions with lower information content may play an indirect role in DNA binding, perhaps by facili-tating DNA conformation or by some other mechanism (for instance, Burden and Weng [47] demonstrated conserved DNA structural features at degenerate TFBS locations).
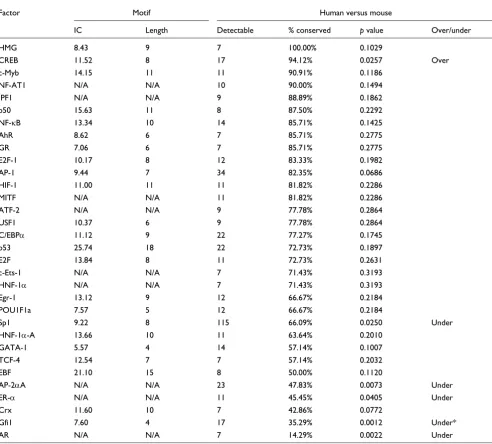
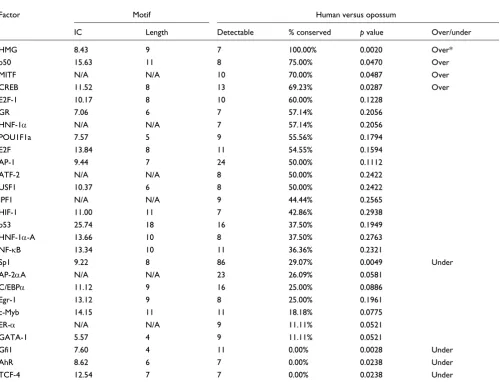
As noted by Sauer and coworkers [11], for human-rodent comparisons certain transcription factors are more likely to have their TFBSs conserved across species than others. We test this finding outside eutherians by examining conserva-tion rates of TFBSs for those factors for which at least seven instances are detectable in the corresponding comparisons. The findings for human-mouse and human-opossum com-parisons are presented in Tables 4 and 5, and similar compar-isons between human and other species are available in Additional data file 1.
Although some factors' TFBSs are conserved at higher than expected (for example, CREB) or lower than expected (for example, Gfi1, AR and Sp1) rates in human-mouse compari-sons, only the sites of Gfi1 are (under)conserved after the Bonferroni correction (see Materials and methods, below). Similarly, the sites of various factors are over-conserved (for example, HMG and CREB, among others) and under-con-served (for example, Gfi1 and Sp1, and so on) in human-opos-sum comparisons, but only the HMG sites remain (over)conserved after the correction (Table 5). We found that all detectable HMG sites are conserved in both mouse and opossum, but their small number (seven) made them appear significant only in the human-opossum comparisons. Interestingly, human Sp1 TFBSs are under-conserved in all genomes except rodents (Additional data file 1). This may be explained by the fact that the Sp1 target site (consensus:
[image:9.612.54.297.509.675.2]Cross-species conservation of individual TFBS positions versus their information content
Figure 5
Cross-species conservation of individual TFBS positions versus their information content. Conservation is measured between the human and each of the other species. Information content is measured according to the human position-specific score matrix (PSSM) model.
0.6 0.65 0.7 0.75 0.8 0.85 0.9 0.95 1
0→ 0.49 0.5 → 0.99 1.0 → 1.49 1.5 → 2.0 Motif column information content
Average base conservation rate
'GGcGGG') and related patterns are expected to occur fre-quently in GC-rich mammalian promoters. As such, random mutations in mammalian promoters have a high probability of producing additional copies of functional sites. With such a potential proliferation of 'backup' Sp1 target sites, an increased Sp1 TFBS turnover rate should not be surprising. Therefore, evolutionary conservation of TFBSs has some dependency on the identity of the bound transcription factor, but no strong conclusions can be drawn at this point because
of the limited amount of available data. AP-2α is represented
by 23 human sites in our dataset. All genes regulated by these sites have orthologs in both mouse and opossum, and yet its TFBSs are under-conserved in mouse. This is an example in which TFBS conservation does not coincide with the conser-vation of the downstream genes, which has been observed for developmental genes as well [1].
[image:10.612.59.551.119.563.2]We found no association between the information content (IC) of the transcription factor motif and the percentage con-servation. For example, TCF-4 motif has a relatively high IC
Table 4
Human-mouse TFBS conservation dependency on transcription factor identity
Factor Motif Human versus mouse
IC Length Detectable % conserved p value Over/under
HMG 8.43 9 7 100.00% 0.1029
CREB 11.52 8 17 94.12% 0.0257 Over
c-Myb 14.15 11 11 90.91% 0.1186
NF-AT1 N/A N/A 10 90.00% 0.1494
IPF1 N/A N/A 9 88.89% 0.1862
p50 15.63 11 8 87.50% 0.2292
NF-κB 13.34 10 14 85.71% 0.1425
AhR 8.62 6 7 85.71% 0.2775
GR 7.06 6 7 85.71% 0.2775
E2F-1 10.17 8 12 83.33% 0.1982
AP-1 9.44 7 34 82.35% 0.0686
HIF-1 11.00 11 11 81.82% 0.2286
MITF N/A N/A 11 81.82% 0.2286
ATF-2 N/A N/A 9 77.78% 0.2864
USF1 10.37 6 9 77.78% 0.2864
C/EBPα 11.12 9 22 77.27% 0.1745
p53 25.74 18 22 72.73% 0.1897
E2F 13.84 8 11 72.73% 0.2631
c-Ets-1 N/A N/A 7 71.43% 0.3193
HNF-1α N/A N/A 7 71.43% 0.3193
Egr-1 13.12 9 12 66.67% 0.2184
POU1F1a 7.57 5 12 66.67% 0.2184
Sp1 9.22 8 115 66.09% 0.0250 Under
HNF-1α-A 13.66 10 11 63.64% 0.2010
GATA-1 5.57 4 14 57.14% 0.1007
TCF-4 12.54 7 7 57.14% 0.2032
EBF 21.10 15 8 50.00% 0.1120
AP-2αA N/A N/A 23 47.83% 0.0073 Under
ER-α N/A N/A 11 45.45% 0.0405 Under
Crx 11.60 10 7 42.86% 0.0772
Gfi1 7.60 4 17 35.29% 0.0012 Under*
AR N/A N/A 7 14.29% 0.0022 Under
comm
en
t
re
v
ie
w
s
re
ports
refer
e
e
d
re
sear
ch
de
p
o
si
te
d r
e
se
a
rch
interacti
o
ns
inf
o
rmation
value (12.5) and its sites are generally under-conserved in both mouse and opossum, but they are significantly under-conserved only in opossum (Tables 4 and 5). In contrast, the sites of HMG are all in conserved regions in human-mouse and human-opossum comparisons, yet the HMG motif has an IC value of 8.4.
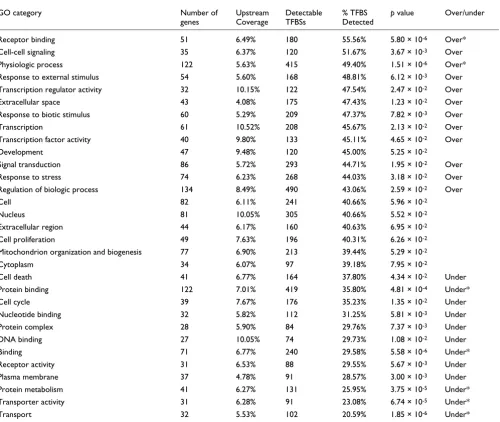
Exploring transcription factor binding site conservation dependencies on Gene Ontology categories between human and opossum
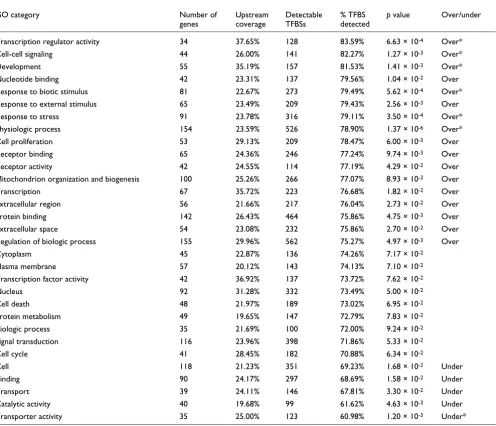
We also test the possible association between TFBS turnover rates and the functional category of the corresponding regu-lated genes. Previous studies suggest that the genes with the highest upstream sequence conservation coverage are those involved in transcription and development [48-51]. Table 6 presents the top 30 most populated GO-slim categories [28] in terms of human-mouse orthologous genes from our 513 protein coding gene dataset. Significance was assessed using
[image:11.612.56.556.117.499.2]the Fisher's exact test, as described in the Materials and methods (below). We found that GO categories 'physiologic process' and 'transporter activity' to be over-represented and under-represented, respectively, in both mouse and opos-sum, even after the Bonferroni correction. Many other GO categories have over-conserved TFBSs in the promoters of their member genes between human and mouse. Examples include 'transcription', 'development', 'cell-cell signaling', response to various stimuli, among others (Table 6). Sauer and coworkers [11] also showed that TFBS conservation in human-rodent comparisons is correlated with the functional category of the downstream regulated gene. Their findings agree with ours in many categories. In particular, there are 34 categories in common for which one (or both) of the studies has found them to be statistically over-represented or under-represented. In 29 of them (85%) the two studies agree with respect to the 'sign' of conservation. The differences observed between the two studies can be attributed to the different set
Table 5
Human-opossum TFBS conservation dependency on transcription factor identity
Factor Motif Human versus opossum
IC Length Detectable % conserved p value Over/under
HMG 8.43 9 7 100.00% 0.0020 Over*
p50 15.63 11 8 75.00% 0.0470 Over
MITF N/A N/A 10 70.00% 0.0487 Over
CREB 11.52 8 13 69.23% 0.0287 Over
E2F-1 10.17 8 10 60.00% 0.1228
GR 7.06 6 7 57.14% 0.2056
HNF-1α N/A N/A 7 57.14% 0.2056
POU1F1a 7.57 5 9 55.56% 0.1794
E2F 13.84 8 11 54.55% 0.1594
AP-1 9.44 7 24 50.00% 0.1112
ATF-2 N/A N/A 8 50.00% 0.2422
USF1 10.37 6 8 50.00% 0.2422
IPF1 N/A N/A 9 44.44% 0.2565
HIF-1 11.00 11 7 42.86% 0.2938
p53 25.74 18 16 37.50% 0.1949
HNF-1α-A 13.66 10 8 37.50% 0.2763
NF-κB 13.34 10 11 36.36% 0.2321
Sp1 9.22 8 86 29.07% 0.0049 Under
AP-2αA N/A N/A 23 26.09% 0.0581
C/EBPα 11.12 9 16 25.00% 0.0886
Egr-1 13.12 9 8 25.00% 0.1961
c-Myb 14.15 11 11 18.18% 0.0775
ER-α N/A N/A 9 11.11% 0.0521
GATA-1 5.57 4 9 11.11% 0.0521
Gfi1 7.60 4 11 0.00% 0.0028 Under
AhR 8.62 6 7 0.00% 0.0238 Under
TCF-4 12.54 7 7 0.00% 0.0238 Under
of TFBSs upon which their measurements are based (Sauer and coworkers used sites from mouse and rat in addition to human) and the methods used to assign significance.
We extend this study in opossum (Table 7) and the other ver-tebrate genomes (Additional data file 1). Most of the over-conserved categories between human and mouse are also over-conserved in human-opossum comparisons (Fisher's exact test; see Tables 6 and 7). These include 'cell-cell signal-ing' and response to stress and biotic stimuli. On the other hand, the TFBS conservation rate for the 'protein binding' went from being over-conserved in human-mouse compari-sons (76% TFBS conservation) to under-conserved in human-opossum comparisons (36% TFBS conservation). This is one
of the highly populated categories, and its members are involved in almost every cellular process, for instance signal transduction, chromatin structure, transcription, translation, cell cytoskeleton, and so on. It is therefore difficult to assess the significance of this change in TFBS conservation related to this category. One thing is for sure; the observed differ-ences are not an artifact caused by the low number of TFBSs. This category is represented by 142 genes associated with 464 TFBSs in mouse and 122 genes associated with 419 TFBSs in opossum, making it one of the best represented categories in our dataset.
[image:12.612.62.558.117.543.2]'Development' is another category in which TFBSs are signif-icantly over-conserved in human-mouse comparisons. In
Table 6
Human-mouse TFBS conservation dependency on the GO category of the downstream regulated gene
GO category Number of
genes
Upstream coverage
Detectable TFBSs
% TFBS detected
p value Over/under
Transcription regulator activity 34 37.65% 128 83.59% 6.63 × 10⁻⁴ Over*
Cell-cell signaling 44 26.00% 141 82.27% 1.27 × 10⁻³ Over*
Development 55 35.19% 157 81.53% 1.41 × 10⁻³ Over*
Nucleotide binding 42 23.31% 137 79.56% 1.04 × 10⁻² Over
Response to biotic stimulus 81 22.67% 273 79.49% 5.62 × 10⁻⁴ Over*
Response to external stimulus 65 23.49% 209 79.43% 2.56 × 10⁻³ Over
Response to stress 91 23.78% 316 79.11% 3.50 × 10⁻⁴ Over*
Physiologic process 154 23.59% 526 78.90% 1.37 × 10⁻⁶ Over*
Cell proliferation 53 29.13% 209 78.47% 6.00 × 10⁻³ Over
Receptor binding 65 24.36% 246 77.24% 9.74 × 10⁻³ Over
Receptor activity 42 24.55% 114 77.19% 4.29 × 10⁻² Over
Mitochondrion organization and biogenesis 100 25.26% 266 77.07% 8.93 × 10⁻³ Over
Transcription 67 35.72% 223 76.68% 1.82 × 10⁻² Over
Extracellular region 56 21.66% 217 76.04% 2.73 × 10⁻² Over
Protein binding 142 26.43% 464 75.86% 4.75 × 10⁻³ Over
Extracellular space 54 23.08% 232 75.86% 2.70 × 10⁻² Over
Regulation of biologic process 155 29.96% 562 75.27% 4.97 × 10⁻³ Over
Cytoplasm 45 22.87% 136 74.26% 7.17 × 10⁻²
Plasma membrane 57 20.12% 143 74.13% 7.10 × 10⁻²
Transcription factor activity 42 36.92% 137 73.72% 7.62 × 10⁻²
Nucleus 92 31.28% 332 73.49% 5.00 × 10⁻²
Cell death 48 21.97% 189 73.02% 6.95 × 10⁻²
Protein metabolism 49 19.65% 147 72.79% 7.83 × 10⁻²
Biologic process 35 21.69% 100 72.00% 9.24 × 10⁻²
Signal transduction 116 23.96% 398 71.86% 5.33 × 10⁻²
Cell cycle 41 28.45% 182 70.88% 6.34 × 10⁻²
Cell 118 21.23% 351 69.23% 1.68 × 10⁻² Under
Binding 90 24.17% 297 68.69% 1.58 × 10⁻² Under
Transport 39 24.11% 146 67.81% 3.30 × 10⁻² Under
Catalytic activity 40 19.68% 99 61.62% 4.63 × 10⁻³ Under
Transporter activity 35 25.00% 123 60.98% 1.20 × 10⁻³ Under*
comm
en
t
re
v
ie
w
s
re
ports
refer
e
e
d
re
sear
ch
de
p
o
si
te
d r
e
se
a
rch
interacti
o
ns
inf
o
rmation
human-opossum comparisons TFBSs are still over-con-served, but not at a significant level. This can also be attrib-uted to the sharp decrease in the percentage of detected TFBSs (from 81.5% in mouse to 45% in opossum) in relation to the high number of potentially detectable TFBSs (157 ver-sus 120 in mouse and opossum, respectively). The develop-mental genes themselves are ultra-conserved in opossum [1], resulting in the detection of many orthologs and hence many potentially detectable TFBSs associated with them. Conserva-tion tables, similar to Tables 6 and 7, for comparisons between human and other species are available in Additional data file 1.
Comparison with other studies
A number of existing studies have attempted to quantify reg-ulatory conservation in mammals, albeit using different
approaches and typically restricting their interest to human-rodent comparisons. Our results on human-human-rodent compari-sons generally agree with these studies. For example, we find approximately 72% of detectable human TFBSs conserved in mouse 5 kb upstream regions. Similarly, Sauer and coworkers [11] reported detection of TRANSFAC [29] TFBSs in human-rodent conserved sequences at a rate of 71.7% when using the same conservation threshold (65% identity).
[image:13.612.57.557.119.541.2]For conservation cutoffs of 70% identity, Liu and coworkers [9], Levy and Hannenhalli [12], and Lenhard and colleagues [13] independently found human-mouse conservation rates for known TFBSs of about 60%, 65%, and 68%, respectively. The latter three studies were also based on finding conserved blocks via sliding windows on aligned sequences. Dermitzakis and Clark [10] also reported detection of TRANSFAC TFBSs
Table 7
Human-opossum TFBS conservation dependency on the GO category of the downstream regulated gene
GO category Number of
genes
Upstream Coverage
Detectable TFBSs
% TFBS Detected
p value Over/under
Receptor binding 51 6.49% 180 55.56% 5.80 × 10⁻⁶ Over*
Cell-cell signaling 35 6.37% 120 51.67% 3.67 × 10⁻³ Over
Physiologic process 122 5.63% 415 49.40% 1.51 × 10⁻⁶ Over*
Response to external stimulus 54 5.60% 168 48.81% 6.12 × 10⁻³ Over
Transcription regulator activity 32 10.15% 122 47.54% 2.47 × 10⁻² Over
Extracellular space 43 4.08% 175 47.43% 1.23 × 10⁻² Over
Response to biotic stimulus 60 5.29% 209 47.37% 7.82 × 10⁻³ Over
Transcription 61 10.52% 208 45.67% 2.13 × 10⁻² Over
Transcription factor activity 40 9.80% 133 45.11% 4.65 × 10⁻² Over
Development 47 9.48% 120 45.00% 5.25 × 10⁻²
Signal transduction 86 5.72% 293 44.71% 1.95 × 10⁻² Over
Response to stress 74 6.23% 268 44.03% 3.18 × 10⁻² Over
Regulation of biologic process 134 8.49% 490 43.06% 2.59 × 10⁻² Over
Cell 82 6.11% 241 40.66% 5.96 × 10⁻²
Nucleus 81 10.05% 305 40.66% 5.52 × 10⁻²
Extracellular region 44 6.17% 160 40.63% 6.95 × 10⁻²
Cell proliferation 49 7.63% 196 40.31% 6.26 × 10⁻²
Mitochondrion organization and biogenesis 77 6.90% 213 39.44% 5.29 × 10⁻²
Cytoplasm 34 6.07% 97 39.18% 7.95 × 10⁻²
Cell death 41 6.77% 164 37.80% 4.34 × 10⁻² Under
Protein binding 122 7.01% 419 35.80% 4.81 × 10⁻⁴ Under*
Cell cycle 39 7.67% 176 35.23% 1.35 × 10⁻² Under
Nucleotide binding 32 5.82% 112 31.25% 5.81 × 10⁻³ Under
Protein complex 28 5.90% 84 29.76% 7.37 × 10⁻³ Under
DNA binding 27 10.05% 74 29.73% 1.08 × 10⁻² Under
Binding 71 6.77% 240 29.58% 5.58 × 10⁻⁶ Under*
Receptor activity 31 6.53% 88 29.55% 5.67 × 10⁻³ Under
Plasma membrane 37 4.78% 91 28.57% 3.00 × 10⁻³ Under
Protein metabolism 41 6.27% 131 25.95% 3.75 × 10⁻⁵ Under*
Transporter activity 31 6.28% 91 23.08% 6.74 × 10⁻⁵ Under*
Transport 32 5.53% 102 20.59% 1.85 × 10⁻⁶ Under*
in human-rodent conserved sequences at rates of 60% to 68%. All of the aforementioned human-rodent TFBS turnover rates are consistent with our findings, given the slightly higher conservation cut-offs and the lower number of known TFBSs tested (40 sites by Lenhard and colleagues [13], 64 sites by Dermitzakis and Clark [10], 467 sites by Liu and cow-orkers [9], and 481 sites by Levy and Hannenhalli [12]).
In relation to our human-mouse 5 kb upstream conservation coverage figure (24%), a number of other studies have found human-rodent upstream conservation rates in the range 17% to 25% [9,52,53]. In a comparison of 77 well defined human-mouse gene pairs, Jareborg and coworkers [54] found 36% conservation coverage of upstream sequence using the soft-ware program DBA and a 60% cutoff. However, their upstream sequences ranged from 500 bp to 1,000 bp upstream of the TSS. Our conservation coverage in the same range of distance is 38.7% to 49.2%. Sauer and coworkers [11] found a background conservation rate of 35% in human-rodent comparisons, although their study was based on 800 bp windows of sequence centered on a known TFBSs, and was therefore also biased toward including sequence from the proximal 500 bp region.
A recent study of the mouse transcriptome showed that a large part of this mammalian genome may be transcribed [55]. The authors found many more transcripts than the number of genes currently estimated for the mammalian genomes. For about one-third of these transcripts no associa-tion with protein coding genes was found, and therefore they were considered to be noncoding RNAs (ncRNAs). Similar to our study, the authors analyzed the upstream sequences of these potential ncRNAs, which they found to be more con-served than the promoters of the protein coding genes. How-ever, their study has some differences compared with ours. First, it does not focus specifically on the intergenic miRNA genes, but analyzes all transcripts for which no protein coding gene association was found. Also, their study does not depict the similarity we found in the conservation rates of coding and noncoding upstream regions in the first 500 bp, which is an important finding of our study, especially when compared with the conservation of the upstream sequences of the tRNA genes (Figure 2). Cooper and coworkers [56] recently ana-lyzed the conservation rates of core promoter sequences of protein coding genes. Their findings agree with ours in that they find that the first 300 bp upstream of the TSS are impor-tant for the core promoter activity. This is the region where we find the highest conservation (Figure 2). In another study, Taylor and coworkers [57] reported that the nucleotide sub-stitution rate increases with the distance from TSS in various types of protein coding genes in a way similar to our observations.
Conclusion
This study is the first to analyze conservation of the upstream regions of protein coding genes in relation to the upstream regions of intergenic miRNA genes. We found the latter to be about twice as conserved as the former beyond the first 500 bp. The reason for this conservation is currently unknown. The first 500 bp appear to be equally conserved in both types of genes, a feature that is missing from the upstream sequences of the tRNA genes. This indicates that similar mechanisms of gene regulation may be in place, which is in agreement with other studies [27,32]. The difference in con-servation rates is more apparent in the mammalian lineages, including opossum, and may reflect similarities in mamma-lian gene regulation.
Another important finding is that the opossum genome offers great potential in terms of improving the performance of the phylogenetic footprinting algorithms. We found that 41% of the known human TFBSs are located in the 6.7% of promoter regions that are conserved between human and opossum, illustrating that the opossum genome sequence can be used to reduce the search space for a large proportion of human TFBSs. A new statistical measure, BRPR, is introduced that quantifies the trade-off between sequence conservation (or reduction of the search space for comparative genomics strat-egies) and regulatory site conservation. We show that for a given site sensitivity threshold, an appropriate combination of genomes can be selected to minimize the search space. Finally, we find that basic cellular functions, such as cell-cell signaling and receptor binding, have significantly over-con-served sites between human and opossum (the corresponding genes have more TFBSs located in the conserved parts of their promoter regions). By contrast, TFBSs related to functions such as transporter activity and protein metabolism are sig-nificantly under-conserved.
Materials and methods
MicroRNA gene dataset
comm
en
t
re
v
ie
w
s
re
ports
refer
e
e
d
re
sear
ch
de
p
o
si
te
d r
e
se
a
rch
interacti
o
ns
inf
o
rmation
were used to retrieve up to 5 kb regions upstream of the gene start site as described below.
We note that in a recent study, Devor and Samollow (personal communication) tested 71 predicted miRNA genes using quantitative polymerase chain reaction on pooled RNA from brain, heart, lung, liver, tongue, and esophagus from an adult opossum. They found evidence of expression in 80% of the cases they tested, including 36 genes in our opossum dataset.
Pair-wise and multiple species comparisons
Pair-wise and multiple species alignments for both protein coding and miRNA genes were retrieved from the 17-species MULTIZ multiple alignments [38], which are available from the UCSC web server (version hg18, March 2006) [63]. The MULTIZ algorithm builds a multiple alignment from local pair-wise BLASTZ alignments of the reference genome with each other genome of interest [38,64]. Each base in the refer-ence genome is aligned to at most one base in the other genomes, and the alignment is guided by synteny. In this study, we present the results from pair-wise and multiple spe-cies comparisons of human [65] with four eutherian mammals (chimpanzee [66], mouse [67], rat [68], and dog [15]), the newly sequenced opossum [1], chicken [69], fugu [70], and tetraodon [71]. A phylogenetic tree for those species and with branch lengths derived from the ENCODE project Multi-Species Sequence Analysis group (September 2005) is shown in Figure 1. This tree was generated using the phyloGif program [72] from Threaded Blockset Aligner (TBA) align-ments over 23 vertebrate species and is based on 4D sites (similar to the tree presented by Margulies and coworkers [73]).
For each pair-wise or multiple species comparisons, the cor-responding (aligned) 5 kb upstream sequences were retrieved directly from the MULTIZ alignments for greater accuracy, using the human genes as reference. If other genes were found within this 5 kb range, then the upstream sequences were shortened accordingly to exclude the additional genes. We used the 65% as our conserved block threshold, which is similar to that in previous studies [9,12,13] and similar to the default threshold used by many phylogenetic footprinting algorithms [6,13].
tRNA dataset
Human tRNA genes and pair-wise alignments were extracted from the UCSC Genome Browser database (version hg18, March 2006) using the genomic MULTIZ alignments as we describe above. Genes that were found to be facing opposite directions in the genome ('head-to-head') and their starts were closer than 2.5 kb apart were excluded from the analysis. This rule excluded 156 genes. The final human tRNA dataset included 1,795 upstream sequences.
Dataset of known transcription factor binding sites
TRANSFAC database (release 9.3) [29] contains 1,162 human confirmed TFBSs that satisfy the following criteria: the site is experimentally confirmed and associated with a promoter of a human gene from the database (confirmed sites); the TFBS sequence can be found within 5 kb upstream of the TSS; if multiple site occurrences are present in the corresponding promoter, then positional information (relative to TSS) is listed in the database; and the regulated human gene corre-sponds to an entry in the RefSeq gene collection. The above TFBSs are located in the promoters of 513 human genes, which serves as our primary dataset for the transcription fac-tor-TFBS association study. We focus on the sites located in the 5 kb upstream region, because this includes 83.4% of all known human TFBSs in TRANSFAC (data not shown). The majority of the sites (a total of 774) have a TRANSFAC assigned quality score of 1, 2, 3, or 4, which shows confirmed binding activity to a known transcription factor. For an addi-tional 325 sites, no TRANSFAC quality score was assigned. The remaining 63 sites (about 5%) belong to TRANSFAC cat-egory 5, for which an unknown protein has been shown to bind to a DNA element.
Dataset of position-specific scoring matrix models
JASPAR database [35] contains 20 PSSM models for tran-scription factors whose sites are present in our dataset. In addition, we previously generated manually 60 more PSSM models from high-quality human and mouse sites in TRANS-FAC [6], which we make publicly available through our web server [74]. These models were used to analyze the position information content with the nucleotide conservation in the subset of 572 corresponding known TFBSs (Figure 5).
Conserved blocks and transcription factor binding site detection: some definitions
In this study, sequence conservation is expressed as con-served block coverage. A sliding window of width 50 bp and step size 10 bp was used to find conserved regions (or blocks) of at least 65% identity between human and each other species. Each pair-wise alignment was extracted from the MULTIZ multiple alignments. Sauer and coworkers [11] have shown that the 65% identity threshold most effectively sepa-rates TFBSs from background sequence in human-rodent comparisons. The percentage of human 5 kb upstream sequence that is located within conserved blocks is denoted the 'conserved block coverage'. The 'average block conserva-tion' is the percentage of identical bases in conserved blocks over all bases in conserved blocks. A 'conserved site' is a known human TFBS that overlaps a conserved block between human and another species. Because we explore the effect of
sequence and pattern of conservation in the discovery of cis