IJPSR (2019), Volume 10, Issue 12 (Research Article)
Received on 14 March 2019; received in revised form, 27 June 2019; accepted, 17 July 2019; published 01 December 2019
FORMULATION EVALUATION AND OPTIMIZATION OF METFORMIN HCl MATRIX TABLET USING NATURAL POLYMER
Trideep Saikia
Girijananda Chowdhury Institute of Pharmaceutical Science, Azara, Guwahati - 781017, Assam, India.
ABSTRACT:Objectives: The main objective was to find out a suitable
and effective natural release retardant, which can be used in matrix tablet preparation along with synthetic excipients. Methods: Tamarind seed polysaccharides (TSP) were isolated from Tamarindus indica by hot extraction method followed by freeze-drying and yield was found to be 16.85%. Microbial studies confirmed that TSP doesn’t support microbial growth. Matrix tablet of Metformin HCl was prepared by using a wet granulation method with the help of TSP. Drug excipients compatibility was checked with the help of Fourier Transform Infrared Spectroscopy (FTIR) and Differential Scanning Calorimetry (DSC). At last, the release was compared with the marketed formulation. Results: The drug content of all the formulations ranged from 96.55% to 98.54%. Formulation F7 showed release up to 12 h. It was observed that as per increase in the polymer concentration, the release rate also increased. F6 formulation was found to be the optimized formulation. The F6 and marketed both the formulation followed the Higuchi model as n values came within the range of 0.5-1.00.
INTRODUCTION: Type - II diabetes is related to abnormal blood glucose, overweight, lipid disturbances, and blood pressure. For all this problem, oral hypoglycemic agents (OHAs) or insulin is often preferred. Biguanides particularly Metformin HCl enhance insulin-mediated glucose uptake and disposal in skeletal muscle and fat. It suppresses the hepatic gluconeogenesis and glucose output from the liver to lower blood glucose level 1. It is having an oral bioavailability of 50%-60% in the fasting condition with a duration of action in between 6-8 h.
QUICK RESPONSE CODE
DOI:
10.13040/IJPSR.0975-8232.10(12).5435-42
The article can be accessed online on
www.ijpsr.com
DOI link: http://dx.doi.org/10.13040/IJPSR.0975-8232.10(12).5435-42
The daily dose is 0.5 to 2.5 g with a plasma t1/2 of 1.5-3 h 2, 3. Matrix tablets are the oral solid dosage forms in which drug or active ingredient is
homogeneously dispersed throughout the
hydrophobic or hydrophilic matrices which act as release rate retardant. Furthermore, Metformin HCl presents formulation challenges due to its inherently poor compressibility, high dose, and high water solubility (> 300 mg/ml at 25 ºC).
It belongs to class III of Biopharmaceutical Classification System (BCS) having high water solubility and low permeability. For drugs that are highly water-soluble, both hydrophobic and hydrophilic matrices used for oral drug delivery system 4. Polymers, which have high molecular mass each molecule of which consist of a very large number of single structural units joined together regularly. Natural polymers occur in nature and can be extracted.
Keywords:
Metformin HCl, Tamarind seed polysaccharides (TSP), Freeze-drying,
Matrix tablet, Differential Scanning Calorimetry (DSC) Correspondence to Author: Trideep Saikia
CSIR, NEIST, Jorhat,
Girijananda Chowdhury Institute of Pharmaceutical Science, Azara, Guwahati - 781017, Assam, India.
They are water-based. Tamarind seed polysaccharides is also a naturally extracted polymer isolated from Tamarindus indica, possesses properties like high viscosity, broad pH tolerance, non-carcinogenicity, mucoadhesive nature, and biocompatibility 5.
MATERIALS AND METHODS: Tamarind seed polysaccharides (TSP) was obtained from the forest of Assam, district- Darrang. Metformin HCl was purchased from Yarrow Chem Products, Mumbai. USP I tapper of a USP tap density tester (Electro lab, model ETD-1020), vortex mixer (Lab-line Equipment’s, India), Bench centrifuge (Remi,
India), Brookfield viscometer (LVDV-E)
(Brookfield Engineering Labs, Stoughton- USA), Perkin Elmer 2400 Semis II CHN analyzer, differential scanning calorimeter (JADE DSC, Perkin Elmer, and USA), Siemens D5000 X-ray Diffractometer (Siemens, Munich, Germany), IR spectrometer (Bruker Alpha FTIR). All other chemicals and solvents used were of analytical grade.
Isolation of Tamarind Seed Polysaccharides: Seeds of Tamarindus indica was collected and dried in sunlight. After that, seeds were crushed into powder and boiled with water at 45 °C to extract the polysaccharides. After boiling for 12 h, the supernatant liquids were collected and stored in a cool place. After the liquids become cooled acetone was added and freeze at -40 °C. Freeze materials then lyophilized to extract out the Tamarind seed polysaccharides 6.
Characterization of Tamarind Seed Poly-saccharides:
Phytochemical Examination: Preliminary tests were performed to confirm the presence of polysaccharide by ruthenium red test and Molisch’s test 7.
Organoleptic Properties: Properties like color, odor, taste, shape, touch, and texture were determined.
Composition of Polysaccharides: Considering glucose as standard, the total sugar content was estimated by the phenol-sulfuric acid analysis. Tests like Molisch tests, Fehling’s test, and the iodine test was performed to determine the total carbohydrate content. UV- visible spectra and
Barfoed test were undergone to determine the protein presence 8.
Micromeritic Properties of Polysaccharides: Isolated TSP powder was evaluated for bulk density, tap density, angle of repose, Hausner’s ratio, and Carr’s index.
Solubility Studies: The polysaccharides obtain from Tamarindus indica was evaluated for solubility in water, acetone, methanol, and ether as per Indian Pharmacopoeia specification.
Determination of Melting Point: Melting point was determined by a capillary tube in melting point apparatus.
Loss on Drying: LOD was carried out as per the method mentioned in Indian Pharmacopoeia 9.
pH of 1% Solution: The pH of the 1% TSP solution was measured using a digital pH meter.
Moisture Content: The moisture content of the powder was carried out by thermos gravimetric method using IR moisture balance.
Viscosity of 1% Solution: The viscosity of 1% solution was determined by Brookfield viscometer
(LVDV-E) (Brookfield Engineering Labs,
Stoughton- USA) using Spindle 62 at 0, 20, 40 and 60 rpm.
Determination of Swelling Index:This was done by taking 1.0 g quantity of in a 15 ml plastic centrifuge tubes, and the volume occupied was noted. Ten milliliters of distilled water was added to it, and the content was mixed on a vortex mixer (Lab-line Equipment, India) for 2 min. The mixture was allowed to stand for 10 min and immediately centrifuged at 1000 rpm on a bench centrifuge (Remi, India). The supernatant was carefully decanted, and the volume of sediment was measured. The swelling index was computed using the following equation.
S = (V2 - V1) / V1 × 100
Determination of Ash Value: 2 gm of polysaccharide (TSP) was weighed accurately in a previously ignited and tarred silica crucible. The material was then ignited by gradually increasing the heat to 500- 600 °C until it appeared white indicating the absence of carbon. It is then cooled in a desiccator, and total ash in mg per gm of air-dried material is calculated. To the crucible containing total ash, 25 ml of 2M HCl was added and boiled gently for 5 min, and then about 5 ml of hot water was added and transferred into the crucible. The insoluble matter was collected on an ashless filter paper. This was then washed with hot water until filtrate is neutral and the filter paper along with the insoluble matter was transferred into the crucible and ignited to constant weight. The residue was then allowed to cool and then weighed. The percentage of insoluble acid ash was calculated from the weight of the sample taken 11.
Microbial Content Determination: Total microbial content was determined by Streak plate (surface plating) method using agar plates.
Compatibility Studies:
FTIR Studies: The pure drug, Metformin hydrochloride and the physical mixture of pure drug with tamarind seed polysaccharides (TSP) powder, HPMC K 100M in the ratio 1:1 were subjected to IR spectral studies using FTIR spectrophotometer (Bruker Alpha FTIR)at the scanning range of 4000-400 cm-1. 12
DSC Studies:It is used to analyses thermal stress on drug and their mixture. Individual sample and 1:1 w/w physical mixture of the drug were weighed, and almost 5 mg was taken in the DSC pan and scanned in the temperature range of 50 to 300 °C in a nitrogen environment. A heating rate of 10 °C per minute was used, and the thermograph was reviewed for evidence of any interaction 13.
Formulation of Matrix Tablets: Metformin HCl tablets were prepared by wet granulation technique. Sustained-release (SR) matrix tablets of Metformin HCl was prepared by using drug Metformin HCl,
HPMC-K-100, PVP-K-30, microcrystalline
cellulose, and tamarind seed polysaccharides. Tamarind seed polysaccharides were used as matrix-forming polymer, while microcrystalline cellulose was used as a filler to maintain the tablet weight. All ingredients were passed through a sieve
#20, weighed and blended. The granules were compressed by a direct compression technique, using KBR (IR press), with the help of 10 mm flat punches.
Evaluation Parameters of Tablets: 14, 15
Pre-Compression Studies of Granules: Various parameters like bulk density, tap density, angle of repose, Hausner’s ratio, and Carr’s index were determined.
Post-Compression Studies of the Prepared Formulations: Test for weight variation, hardness, friability, and thickness were determined for compressed tablets.
Drug Content Determination: Ten tablets of each formulation were powdered. Powder equivalent to 500 mg of Metformin hydrochloride was weighed and transferred to 100 ml volumetric flask, initially about 50 ml of phosphate buffer 6.8 was added and the flask was shaken thoroughly, and the volume was made up to 100 ml with the buffer solution. The resulting solution was filtered. From this, 5 ml was taken and diluted to 100 ml. From this, 2 ml was taken and diluted to 100 ml. From the resulting solution, drug content was estimated at 234 nm using UV spectrophotometer taking phosphate buffer as blank.
In-vitro Drug Release: Drug release studies were carried out using USP type - II dissolution test apparatus, rotating paddle method (Electro lab, Mumbai, India). The study was conducted at 37°C ± 5°C and 50 rpm. The dissolution medium used was 900 ml of phosphate buffer pH 6.8 and study was carried up to 12 h 10 ml of sample was withdrawn at different time intervals and replaced with fresh medium to maintain sink condition. The withdrawn samples were diluted suitably, and drug
release percentage was estimated
spectrophotometrically at 234 nm, using phosphate buffer as blank 16.
Drug Release Kinetics:
Zero-Order Kinetics: Zero-order as a cumulative amount of Percentage drug released vs. time.
C = K0t
First Order Kinetics: First order as cumulative log percentage of log (%) cumulative drug remaining vs. time.
Log C = LogC0-kt/ 2.303
Where Co is the initial concentration of the drug, k is the first order constant, and t is the time.
Higuchi Model: Higuchi's model as a cumulative percentage of drug released vs. square root of time.
Q = Kt1/2
Where K is the constant reflecting the design variables of the system and t is the time in hours. Hence, the drug release rate is proportional to the reciprocal of the square root of time
Korsmeyer Peppas Equations: Korsmeyer-Peppas equation used to determine the mechanism of drug release from the polymer matrix of the tablet as Log cumulative percentage of drug released vs. log time, and the exponent n was calculated through the slope of the straight line.
Mt/Mo = Ktn
Selection of Optimized Formulation: The concentration of natural polymer in matrix tablet was optimized by study the properties of tablet and in vitro release profile. The effect of polymer concentration on release properties of matrix tablet
was determined using different drug: polymer ratio. All the tablet parameter was evaluated for each formulation, and mathematical kinetics model for release profile was compared. The formulation which provides best release pattern with better tablet parameter selected as an optimized tablet.
RESULTS AND DISCUSSION:
Evaluation of Tamarind Seed Polysaccharides (TSP): The purity of polysaccharide was determined by undergoing phytochemical tests such as a test for alkaloids, proteins, fats & oils and amino acid whose outcome found to be absent. The purity was confirmed as the only carbohydrate was found to be present. Then the polysaccharide was characterized by various organoleptic properties such as color, odor, taste, touch, and texture are shown in Table 2. % yield of Tamarind Seed Polysaccharides (TSP) was found to be 16.85%.
Swelling index of the tamarind seed
polysaccharides (TSP) was found to be high. The ability of swelling of any polysaccharide is based on its water retention capacity. The pH of the 1% w/v tamarind seed polysaccharides (TSP) was found to be 6.9. The melting point of polysaccharides was found to be 250°C - 260 °C. Moisture content was found to be 8.10%, which results from good stability for pharmaceutical dosage forms.
TABLE 1: COMPOSITION OF METFORMIN HCl TABLET (mg)
Ingredients F1 F2 F3 F4 F5 F6 F7 F8 F9
Metformin HCl 500 500 500 500 500 500 500 500 500
Polymer (TSP) 50 100 150 200 250 300 350 - -
HPMC K100 - - - 100 200
MCC 330 280 230 180 130 80 30 280 180
PVP K 30 10 10 10 10 10 10 10 10 10
Mg stearate 5 5 5 5 5 5 5 5 5
Talc 5 5 5 5 5 5 5 5 5
Total 900 900 900 900 900 900 900 900 900
TABLE 2: ORGANOLEPTIC PROPERTIES OF POLYSACCHARIDES
Organoleptic properties Results
Colour Brown
Odor Odorless
Taste Tasteless
Shape Irregular
Touch and Texture Hard and rough
The solubility behavior of the polysaccharide was carried out which shows that the polysaccharide is soluble in warm water, sparingly soluble in cold
was found to be within limit; thus, microbial contamination is not a risk factor for product degradation. The properties such as bulk density, tapped density, compressibility index, Hausner’s ratio and angle of repose are referred to as properties of the powder to adhere together for better compressibility in a pharmaceutical formulation. Compressibility index (CI) values up to 15% usually result in good to excellent flow properties, and value above 25% are often sources of poor tableting qualities. The values are found to be within the limit and are believed to serve for good flow properties and compressibility. The angle of repose was found to be 29.45, which indicates good flow properties, and all these are shown in Table 3. The viscosity of 1% solution of tamarind seed polysaccharides (TSP) was found to be 1250, 620, 420 and 90 Centipoise (cP) at 0, 20, 40, 60 rpm respectively and shown in Fig. 1.
TABLE 3: EVALUATION PARAMETERS OF TAMARIND SEED POLYSACCHARIDES (TSP)
Parameters Results
% yield 16.85
Swelling index (%v/v) water 0.1N HCl
Phosphate buffer 6.8
196 220 455
Loss on drying (%w/w) 11
Moisture Content (%w/w) 8.10
Total ash (%w/w) 1.6050
Acid insoluble ash (%w/w) 0.0996 Water soluble ash (%w/w) 0.8218
pH 6.9
Melting Point 250-260°C
The angle of repose (Degree) 29.45
Bulk density (g/cc) 0.63
Tapped density (g/cc) 0.83
Compressibility index (%) 24.17
Hausner’s ratio 1.03
FIG. 1: VISCOSITY DIAGRAM FOR POLYSACCHARIDES
Drug-Excipients Compatibility Study:
Differential Scanning Calorimetry: After mixing Metformin HCl and tamarind seed polysaccharides
(TSP) onset shifted to 221.74°C and peak is 228.72 °C, which is acceptable as shown in Fig. 2.
FIG. 2: DSC OF METFORMIN HCL AND TSP
Fourier Transform Infrared Spectroscopy (FTIR): FT-IR Spectroscopy studies of Metformin HCl, Metformin HCl with polysaccharide and only polysaccharide was carried out separately to find out the compatibility of the Metformin HCl with the polymer. The FT-IR spectra of pure Metformin HCl showed characteristics peak at for the presence of respectively which are also present in the combination of Metformin HCl and polymer indicating the compatibility of Metformin HCl with Tamarind Seed Polysaccharides polymer, shown in Fig. 3.
FIG. 3: FTIR STUDY OF DRUG AND POLYMER
TABLE 4: PRE-COMPRESSION PARAMETERS OF ALL GRANULES Formulation
code
Angle of repose (ɵ°)
Bulk Density (g/cm3)
Tapped density (g/cm3)
Hausner’s ratio
Carr’s index (%)
F-1 22.45 0.456 0.534 1.09 9.02
F-2 23.67 0.461 0.578 1.16 11.23
F-3 25.21 0.421 0.532 1.05 9.67
F-4 23.87 0.498 0.578 1.17 12.44
F-5 24.44 0.454 0.545 1.09 11.06
F-6 26.01 0.429 0.578 1.20 13.32
F-7 24.56 0.478 0.588 1.27 16.53
F-8 26 0.498 0.591 1.07 10.76
F-9 28.23 0.467 0.567 1.23 11.03
TABLE 5: POST COMPRESSION PARAMETERS FOR ALL FORMULATIONS Formulation
code
Thickness (mm)
Hardness (kg/cm2)
Friability (%)
Weight variation
% of Drug content
F-1 4.2±0.02 4.5±0.2 0.23±0.01 907±0.6 97.55±0.27
F-2 4.2±0.04 4.8±0.2 0.26±0.02 906±0.5 97.33±0.48
F-3 4.3±0.02 4.8±0.8 0.25±0.01 908±0.3 96.55±0.78
F-4 4.4±0.03 5.2±0.4 0.18±0.04 907±0.01 97.62±0.44
F-5 4.3±0.04 5.6±0.4 0.16±0.06 905±0.05 98.54±0.58
F-6 4.2±0.02 6.2±0.1 0.11±0.01 906±0.04 98.56±0.18
F-7 4.2±0.05 5.9±0.5 0.14±0.03 906±0.06 98.35±0.45
F-8 4.3±0.02 6.4±0.3 0.8±0.07 906±0.04 96.58±0.48
F-9 4.2±0.03 5.8±0.7 0.13±0.01 907±0.03 98.54±0.36
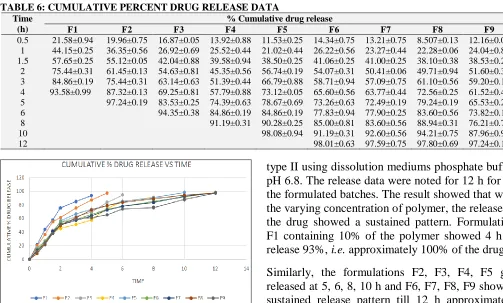
Drug Release: Maximum % cumulative drug release was observed in F5. Minimum % cumulative drug release was observed in F1. The
[image:6.612.48.551.401.704.2]concentration of polymer varies the release of the drug and shown in Table 6.
TABLE 6: CUMULATIVE PERCENT DRUG RELEASE DATA
Time (h)
% Cumulative drug release
F1 F2 F3 F4 F5 F6 F7 F8 F9
0.5 21.58±0.94 19.96±0.75 16.87±0.05 13.92±0.88 11.53±0.25 14.34±0.75 13.21±0.75 8.507±0.13 12.16±0.06
1 44.15±0.25 36.35±0.56 26.92±0.69 25.52±0.44 21.02±0.44 26.22±0.56 23.27±0.44 22.28±0.06 24.04±0.88
1.5 57.65±0.25 55.12±0.05 42.04±0.88 39.58±0.94 38.50±0.25 41.06±0.25 41.00±0.25 38.10±0.38 38.53±0.25
2 75.44±0.31 61.45±0.13 54.63±0.81 45.35±0.56 56.74±0.19 54.07±0.31 50.41±0.06 49.71±0.94 51.60±0.38
3 84.86±0.19 75.44±0.31 63.14±0.63 51.39±0.44 66.79±0.88 58.71±0.94 57.09±0.75 61.10±0.56 59.20±0.13
4 93.58±0.99 87.32±0.13 69.25±0.81 57.79±0.88 73.12±0.05 65.60±0.56 63.77±0.44 72.56±0.25 61.52±0.44
5 97.24±0.19 83.53±0.25 74.39±0.63 78.67±0.69 73.26±0.63 72.49±0.19 79.24±0.19 65.53±0.25
6 94.35±0.38 84.86±0.19 84.86±0.19 77.83±0.94 77.90±0.25 83.60±0.56 73.82±0.13
8 91.19±0.31 90.28±0.25 85.00±0.81 83.60±0.56 88.94±0.31 76.21±0.75
10 98.08±0.94 91.19±0.31 92.60±0.56 94.21±0.75 87.96±0.94
12 98.01±0.63 97.59±0.75 97.80±0.69 97.24±0.19
FIG. 4: CUMULATIVE % DRUG RELEASE CURVE
The in-vitro dissolution studies were carried out for all the formulations from F1-F9 in USP apparatus
type II using dissolution mediums phosphate buffer pH 6.8. The release data were noted for 12 h for all the formulated batches. The result showed that with the varying concentration of polymer, the release of the drug showed a sustained pattern. Formulation F1 containing 10% of the polymer showed 4 h to release 93%, i.e. approximately 100% of the drug.
concentration of polymer the release of drug is extended because of slower erosion and increased viscosity which kept the gel network intact for 12 h with a higher proportion of polysaccharide and release profile shown in Fig. 4.
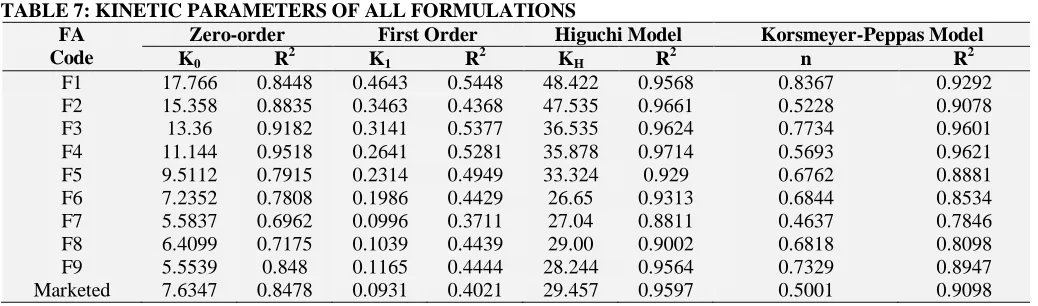
Optimization of Tablets: The R2 value and model constant of the corresponding mathematical model were given in Table 7. From the zero-order and First-order plot it can be easily understood that with an increasing percentage of polymer, the more retardation of drug release occurred as seen in F1 to
F7. The best release was seen in the case of F6. But linearity was observed with Higuchi equation indicating that drug release by diffusion through swellable matrix. The n values of the formulations were found to be 0.9313.
[image:7.612.48.567.227.380.2]Thus as the n value of F6 falls in the range of 0.5-1.0, it follows anomalous non-fickian drug diffusion occurs i.e. combination of both diffusion or swelling as well as erosion mechanism in case of Higuchi model. So F6 can be considered as optimized formulation.
TABLE 7: KINETIC PARAMETERS OF ALL FORMULATIONS FA
Code
Zero-order First Order Higuchi Model Korsmeyer-Peppas Model
K0 R2 K1 R2 KH R2 n R2
F1 17.766 0.8448 0.4643 0.5448 48.422 0.9568 0.8367 0.9292
F2 15.358 0.8835 0.3463 0.4368 47.535 0.9661 0.5228 0.9078
F3 13.36 0.9182 0.3141 0.5377 36.535 0.9624 0.7734 0.9601
F4 11.144 0.9518 0.2641 0.5281 35.878 0.9714 0.5693 0.9621
F5 9.5112 0.7915 0.2314 0.4949 33.324 0.929 0.6762 0.8881
F6 7.2352 0.7808 0.1986 0.4429 26.65 0.9313 0.6844 0.8534
F7 5.5837 0.6962 0.0996 0.3711 27.04 0.8811 0.4637 0.7846
F8 6.4099 0.7175 0.1039 0.4439 29.00 0.9002 0.6818 0.8098
F9 5.5539 0.848 0.1165 0.4444 28.244 0.9564 0.7329 0.8947
Marketed 7.6347 0.8478 0.0931 0.4021 29.457 0.9597 0.5001 0.9098
The R2 values for the marketed formulation were also carried out as given in Table 7. The marketed formulation was found to follow Higuchi model thus, and the values falls in the range of 0.5-1.00 which indicates it follows anomalous non-fickian drug diffusion occurs, i.e. combination of both diffusion or swelling as well as erosion mechanism in case of Higuchi model. Thus F6 was compared with the marketed formulation, and the release was
found to be equivalent with that of the standard marketed formulation.
Stability Study: The stability study of optimized tablets (F6) was carried out according to ICH guidelines at 40°C ± 2°C/75 ± 5% RH for three months by storing the samples in stability chamber and result displayed in Table 8. 17
TABLE 8: STABILITY STUDIES DATA
Formulation Duration of Period Drug Content (%) Hardness (Kg/cm2) Friability (%)
F6
One Month 98.44±0.18 6.1±0.8 0.14±0.02
Two Month 98.21±0.23 6.1±0.5 0.14±0.06
Three Month 98.02±0.21 6.1±0.1 0.15±0.02
CONCLUSION: The research work was carried out successfully. The tablets were prepared by wet granulation technique using different drug-polymer ratios. Before compression, the granules were evaluated for pre-compression parameters, and then the tablets were evaluated for post-compression parameters. The results were found satisfactory for some of the formulations. Then in-vitro release studies were carried out for 12 h, and the release studies showed release approximately 100%. From which formulation F6 with polymer concentration,
ACKNOWLEDGEMENT: Nil
CONFLICTS OF INTEREST: Nil
REFERENCES:
1. Roy H, Brahma CK, Nandi S and Parida KR Formulation
and design of sustained release matrix tablets of metformin hydrochloride: Influence of hypromellose and polyacrylate polymers. International Journal of Applied and Basic Medical Research 2016; 11: 55-63.
2. Nanjwade BK, Mhase SR and Manvi FV: Formulation of extended-release Metformin hydrochloride matrix tablets. Tropical J of Pharmaceutical Res 2011; 10(4): 375-83. 3. Tripathi KD: Essentials of Medical Pharmacology. Jaypee
Brothers Medical Publishers (P) Ltd; 2014.
4. Rathore AS, Jat RC, Sharma N and Tiwari R: An overview: matrix tablet as controlled drug delivery system. International Journal of Research and Development in Pharmacy and Life Sciences 2013; 2(4): 482-92.
5. Baveja SK, Rao KV and Arora J: Examination of natural gums and mucilages as sustaining materials in tablet dosage forms. Indian Journal of Pharmaceutical Sciences 1989; 5(1): 115-19.
6. Chandramouli Y, Firoz S, Vikram A, B. Mahitha, Yasmeen BR and Hemanthpavankumar K: Tamarind seed polysaccharide (TSP) - An adaptable excipient for novel drug delivery systems. International Journal of Pharmacy Practice and Drug Research 2012; 2(2): 57-63.
7. Raman N: Phytochemical techniques. New India
Publishing Agency; New Delhi; 2006.
8. Phani Kumar GK, Gangarao B, Kotha NS and Lova R: Isolation and evaluation of tamarind seed polysaccharide being used as a polymer in pharmaceutical dosage forms. Research Journal of Pharmaceutical, Biological and Chemical Sciences 2011; 2(2): 274.
9. Indian Pharmacopoeia. The Indian Pharmacopoeia
Commission; Vol. I, 2007.
10. Nimit TA, Divakar G, Shantha Kumar GS, Nishit TA, Priyanka P and Patel C: Formulation and evaluation of fast dissolving tablets of hydrocortisone sodium succinate. Res J Pharm Bio Chem Sci 2011; 2(2): 817-37.
11. Shah CS and Quadry JS: A text Book of Pharmacognosy. B S Shah Praskashan; 1995.
12. Manivannan R, Sriram V, Rao BLN and Reddy PVK: Formulation and evaluation of Metformin hydrochloride sustained release tablets. International Journal of Biopharmaceutics 2013; 4(2): 73-79.
13. Sravani B, Deveswaran R, Bharath S, Basavaraj BV and
Madhavan V: Development of sustained-release
metformin hydrochloride tablets using a natural polysaccharide. International Journal of Applied Pharmaceutics 2012; 4(2): 23-29.
14. Fukui S, Yano H, Yada S, Mikkaichi T and Minami H: Design and evaluation of an extended-release matrix tablet formulation; the combination of hypromellose acetate succinate and hydroxypropyl cellulose. Asian Journal of Pharmaceutical Sciences 2016; 11(2): 1-20.
15. Elzayat EM, Abdel-Rahman AA, Ahmed SM, Alanazi FK,
Habib WA, Abou-Auda HS and Sakr A: Formulation and pharmacokinetics of multilayered matrix tablets: Biphasic delivery of diclofenac. Saudi Pharmaceutical Journal 2017; 25: 688-95.
16. Hadi MA, Rao NGR and Rao AS: Formulation and evaluation of oileo-colonic targeted matrix-mini-tablets of Naproxen for chronotherapeutic treatment of rheumatoid arthritis. Saudi Pharmaceutical Journal 2016; 24(1): 64-73. 17. Sharma A, Shukla T, Indoria M and Jha SK: Design,
Development and evaluation of aceclofenac sustained release matrix tablets. International J Drug Dev Res 2011; 3(1): 307-13.
All © 2013 are reserved by International Journal of Pharmaceutical Sciences and Research. This Journal licensed under a Creative Commons Attribution-NonCommercial-ShareAlike 3.0 Unported License. This article can be downloaded to Android OS based mobile. Scan QR Code using Code/Bar Scanner from your mobile. (Scanners are available on Google Playstore)
How to cite this article: