BIROn - Birkbeck Institutional Research Online
Waudby, C.A. and Ramos, A. and Cabrita, Lisa and Christodoulou, John
(2016) Two-dimensional NMR lineshape analysis. Scientific Reports 6 , p.
24826. ISSN 2045-2322.
Downloaded from:
Usage Guidelines:
Please refer to usage guidelines at
or alternatively
www.nature.com/scientificreports
Two-Dimensional NMR Lineshape
Analysis
Christopher A. Waudby, Andres Ramos, Lisa D. Cabrita & John Christodoulou
NMR titration experiments are a rich source of structural, mechanistic, thermodynamic and kinetic information on biomolecular interactions, which can be extracted through the quantitative analysis of resonance lineshapes. However, applications of such analyses are frequently limited by peak overlap inherent to complex biomolecular systems. Moreover, systematic errors may arise due to the analysis of two-dimensional data using theoretical frameworks developed for one-dimensional experiments. Here we introduce a more accurate and convenient method for the analysis of such data, based on the direct quantum mechanical simulation and fitting of entire two-dimensional experiments, which we implement in a new software tool, TITAN (TITration ANalysis). We expect the approach, which we demonstrate for a variety of protein-protein and protein-ligand interactions, to be particularly useful in providing information on multi-step or multi-component interactions.
Solution-state NMR spectroscopy is a powerful tool for the label-free characterization of structural and dynam-ical aspects of biomolecular interactions and equilibria1,2. Following changes in two-dimensional NMR spectra of macromolecules upon titration of a binding partner is a very common and information-rich approach capable of simultaneously characterizing thermodynamic (dissociation constant), kinetic (association and dissociation rates) and structural (chemical shift) aspects of interactions3. Critically, titration spectra are often sensitive probes of allosteric and multi-step binding mechanisms4, as used, for example, to elucidate the molecular mechanism underlying the remarkable selectivity of the chemotherapy drug Gleevec for inhibition of Abl tyrosine kinase5.
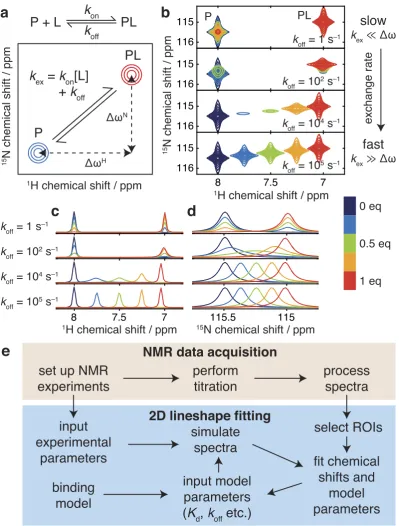
The appearance of NMR resonances during a titration experiment (e.g. to study a protein-ligand interac-tion) depends on the rate of exchange, kex, between free and bound forms relative to the frequency difference, Δω , between these states6. When k
ex≫ Δω (‘fast exchange’), a progressive change in peak position is observed across the titration, while when kex≪ Δω (‘slow exchange’), separate free and bound resonances are observed with population-dependent intensities. Between these limiting cases (‘intermediate exchange’), more complex behav-iour is observed in which chemical shift and intensity changes are not linearly related to the extent of binding. Analyses of chemical shift or intensity changes that neglect these effects can result in systematic errors in fitted Kd values3, but conversely, analyses that correctly account for the effects of exchange can extract valuable additional kinetic and mechanistic information on the system under investigation.
NMR lineshape analysis, also referred to as dynamic NMR, is a well-established method for the quan-titative analysis of titration data based upon the fitting of one-dimensional spectra (or cross-sections from two-dimensional spectra) to theoretical or numerical solutions of the equations governing evolution of mag-netization in an exchanging system7–9. As frequency differences, Δω , typically range from 10 to 10,000 s−1, NMR lineshape analysis can be suitable for the study of exchange processes, kex, on timescales from 10 μs to 100 ms. The approach therefore strongly complements other NMR methods such as magnetisation exchange spectroscopy or relaxation dispersion10–12, as well as orthogonal biophysical techniques such as isothermal titration calorim-etry13,14. Additionally, lineshape analysis can be a powerful probe of more complex reaction mechanisms4, such as cooperative or multi-step binding15,16, induced fit or conformational selection17, coupled folding and binding of intrinsically disordered proteins11, allostery18,19, enzyme catalytic cycles9,20 and ultrafast protein folding21. A variety of software packages have been described to implement the analysis4,15,22.
The extension of lineshape analysis to two-dimensional experiments, e.g. 1H, 15N-HSQC or HMQC exper-iments, presents a number of additional features not encountered in one-dimensional experiments. Firstly, as distinct frequency (chemical shift) differences are associated with each dimension (Fig. 1a), the description of two-dimensional resonances as being in fast or slow exchange is not technically valid: lineshapes in each dimen-sion may exhibit distinct behaviours (Fig. 1b–d). Secondly, relaxation occurring during the pulse sequence results
Institute of Structural and Molecular Biology, University College London and Birkbeck College, London WC1E 6BT,
UK. Correspondence and requests for materials should be addressed to C.A.W. (email: [email protected]) or J.C. (email: [email protected])
received: 18 February 2016
Accepted: 31 March 2016
Published: 25 April 2016
www.nature.com/scientificreports/
[image:3.595.155.555.42.569.2]www.nature.com/scientificreports/
the analysis of two-dimensional datasets. In this manuscript, we describe such an approach, based on the direct simulation and fitting of two-dimensional spectra, which can fully account for the effects of exchange in common biomolecular NMR experiments, while efficiently handling the fitting of overlapping resonances. We anticipate that this approach will help facilitate more accurate and informative analyses of common titration experiments.
Results and Discussion
Existing approaches to lineshape analysis are based upon fitting solutions of the equations governing the evo-lution of magnetisation during chemical shift evoevo-lution periods to cross-sections of the observed spectra. In this manuscript, we propose extending this approach by calculating the evolution of magnetisation through-out the specific pulse sequence applied, by direct quantum mechanical simulation in Liouville space23,24 (see Methods). The two-dimensional interferograms thus obtained may be Fourier transformed to yield spectra suit-able for comparison with experimental data. We have implemented this analysis using an optimised in silico
‘virtual spectrometer’ approach for the simulation and fitting of two-dimensional NMR experiments and datasets. This is configurable to match experimental acquisition parameters, allowing the efficient calculation of complete two-dimensional spectra against which best-fitting chemical shifts, linewidths and model parameters, such as binding constants and dissociation rates, can be determined using an iterative least-squares procedure (Fig. 1e).
Our new approach brings several important advantages over one-dimensional methods, both in terms of convenience and accuracy. The direct analysis of two-dimensional spectra allows far greater flexibility in avoiding peak overlap, a problem ubiquitous in the congested spectra typical of biomolecules: for each spectrum, arbitrary regions of interest (ROIs) can be defined to exclude regions of peak overlap, or alternatively groups of overlapping resonances can be fitted simultaneously. In addition, the global fitting of multiple ROIs, all reporting on a com-mon interaction as described below, provides a robust tool for com-monitoring the quality of fits. Also, by tracking the relaxation (decay) of magnetisation across the entire pulse sequence, calculations can fully account for the differ-ential relaxation of states during execution of the pulse program. Such effects arise frequently in slow-intermediate exchange regimes when the various states (conformations) of the macromolecule do not have the same linew-idth (for example in folding/unfolding reactions, or dimerization and other association/dissociation reactions), and can induce systematic errors when using one-dimensional analysis methods as the amount of magneti-zation associated with a particular state is no longer proportional to its population (Supplementary Fig. S1). A similar effect can also distort one-dimensional analyses of HMQC experiments, due to the influence of 1H chemical shift changes on multiple quantum coherences during the indirect detection period (Supplementary Fig. S2). Lastly, and again because relaxation is fully treated throughout the pulse sequence, the intensity of NMR signals can be rigorously compared between titration spectra. In contrast, one-dimensional methods require that every peak cross-section must be individually normalised (Fig. 1b–d), either by integration, which may introduce large errors due to noise in the spectrum, or by fitting, which introduces a large number of additional degrees of freedom, ultimately resulting in a less powerful analysis.
The two-dimensional lineshape analysis method described here has been implemented in the software package TITAN (TITration ANalysis, http://www.nmr-titan.com). TITAN can be used to simulate the HSQC and HMQC pulse programs commonly used to monitor protein-ligand interactions (Supplementary Fig. S3 and Table S1), and data can be fitted to a range of binding models, from simple two-state interactions to more complex induced fit or conformational selection mechanisms. Example data and analysis scripts are provided, and a flexible ‘plug-in’ approach allows the implementation of additional pulse programs or binding models if required. Simple func-tions and interfaces are provided for the import of data, selection of ROIs, and global fitting and error analysis.
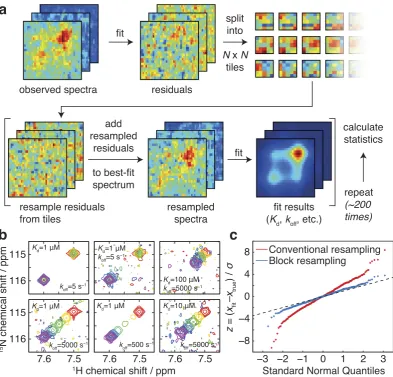
It is of paramount importance that parameters estimated by the lineshape analysis methods we describe are accompanied by reliable estimates of their experimental uncertainty. To this end, we have investigated the application of a bootstrap error analysis method based on resampling of fitting residuals in two-dimensional blocks(Kunsch, 1989) (Fig. 2a). In contrast to conventional methods based on resampling of individual points, this approach accounts for correlation between neighboring points, resulting in a more accurate estimation of parameter uncertainties. This method is also useful for linewidth measurements in single spectra. To validate the analysis, we generated test data for a two-state binding interaction in which the Kd, koff and noise level were systematically varied over several orders of magnitude (examples of which are shown in Fig. 2b). Parameter uncertainties were calculated by residual resampling using either conventional methods or 5 × 5 blocks. The distributions of the resulting z-scores (z= (xfit − xtrue)/σ x) are examined in Fig. 2c. While conventional residual resampling results in systematic underestimation of uncertainties, the distribution obtained by block resampling is close to a standard normal distribution, providing strong evidence that parameter values, and their associated uncertainties, are being correctly determined.
www.nature.com/scientificreports/
As discussed above, NMR lineshapes are a sensitive tool for identifying and investigating multi-step inter-action mechanisms such as induced fit or conformational selection4,5 (Supplementary Fig. S7). However, the dependence of lineshapes on binding mechanisms can be non-intuitive, and so example TITAN scripts are pro-vided that allow users to easily explore mechanisms and ranges of parameters of relevance to particular systems. Moreover, we have also developed an interactive online application that allows the rapid exploration of the most common binding models using a simple graphical user interface (accessible at http://www.nmr-titan.com).
As an example of the analysis of a more complex binding mechanism, we have investigated the interaction of calmodulin (CaM) with the drug trifluoperazine26 (TFP). Crystal structures have been determined with 1, 2 and 4 equivalents of TFP bound27–29, while previous NMR studies have observed complex patterns of chemical shift changes that have hitherto precluded quantitative analysis26. In particular, the direction of chemical shift changes were observed to change across the titration, which is indicative of a sequential binding mechanism (Fig. 4a,b and Supplementary Fig. S7). To obtain a quantitative model of this interaction, we recorded 1H, 15N-HSQC spec-tra across a tispec-tration of uniformly 15N-labelled (Ca2+)
[image:5.595.157.551.43.420.2]4-CaM with TFP, and attempted to fit the data to a model describing the sequential binding of 4 TFP molecules (Fig. 4a and Supplementary Fig. S8). We found that this minimal model, based on the simultaneous fitting of 33 residues evenly distributed around the protein, described the observed data accurately, revealing a hierarchy of binding constants together with their associated rate con-stants (Fig. 4b). Moreover, the fitted chemical shift changes provide useful structural information on the various binding sites: when projected onto previously determined crystal structures we found that the pattern of chemical shift changes reproduced the crystallographic order of the multiple binding sites, and could be used to resolve the order of the third and fourth binding sites (Fig. 4c–f).
www.nature.com/scientificreports/
In summary, we have presented an improved method to extract structural, thermodynamic and kinetic infor-mation on protein-ligand interactions using two-dimensional NMR spectroscopy. As a proof of principle we have applied the method to two very different systems, the 1:1 interaction between the FBP and FIR c-myc transcrip-tional regulators, and the multi-state interactions between the drug TFP and calmodulin. In both cases, we show that our analysis yields novel structural and mechanistic insight into the interactions. The method is applicable to the analysis of a wide range of processes and systems. Direct quantum mechanical simulation of experiments provides a flexible approach that is extensible to more complex pulse sequences (for example the CPMG-HSQC experiment30, Supplementary Fig. S9). The analysis can also be applied to more complex spin systems. For exam-ple, provided that fast-relaxing coherences can be neglected31, methyl-TROSY 1H, 13C-HMQC measurements of CH3 groups can be treated as two-spin systems using the existing HMQC implementation. This will extend the use of TITAN to the study of high molecular weight systems. Ultimately, we expect these methods to facilitate the routine quantitative analysis of NMR titration data to resolve aspects of complex interaction mechanisms.
Methods
Code availability.
The TITAN application and source code (developed and tested in MATLAB 2015b) is freely available for academic use from http://www.nmr-titan.com. An interactive online tool for the exploration of common binding models (developed in Mathematica 10.2, Wolfram Research Inc., Champaign, Illinois) is freely available at the same address. [image:6.595.157.494.46.372.2]www.nature.com/scientificreports/
also effective to use larger ROIs and fit the overlapping peaks directly. The fitting process itself is best conducted as an iterative process, due to the large number of free parameters (each spin has two chemical shifts and linewidths associated with each state, plus global model parameters). For example, it is often effective to fit chemical shifts and linewidths for the first spectrum alone, then hold these parameters constant for the remainder of the session. If additional constraints are known, for example Kd values from other biophysical methods, these can also be held constant. Finally, when a satisfactory fit is obtained (simple functions are provided for the two and three dimen-sional visualisation and inspection of fits), bootstrap error analysis can be performed, from which parameter uncertainties and covariances are determined.
Simulation of two-dimensional spectra.
Two-dimensional spectra are simulated by propagation of den-sity operators in a composite Liouville space formed from the direct product of the chemical state space and the spin Liouville space7,23,24, incorporating an exchange superoperator, K, derived from the specified binding model and calculated at each point in the titration series. For example, in the case of three-state exchange, the form ofK is:
=
− −
− −
− −
K
k k k k
k k k k
k k k k (1)
ab ac ba ca
ab ba bc cb
ac bc ca cb
[image:7.595.158.492.51.393.2]A vector of equilibrium concentrations, p0, is derived from the microscopic rate constants and this is used to form an initial density operator, ρ0 (Supplementary Table S1). This is then propagated for all required values of the indirect evolution period, t1, until the start of the direct acquisition period. To accelerate calculations only Figure 4. Analysis of the interaction of Ca2+
4-CaM with TFP. (a) Sequential binding model showing fitted
dissociation and rate constants. (b) Observed and fitted 1H, 15N-HSQC spectra of 40 μM Ca2+
4-CaM upon titration of TFP. Chemical shift changes are shown for K115, D118 and F141. D80 was excluded from the fitted region of interest, and contours of the fitted I63, F68 and S101 resonances are desaturated to improve contrast for the remaining resonances. (c–f) Chemical shift differences (Δδ = (ΔδH2+ (Δδ
www.nature.com/scientificreports/
active subspaces are propagated, and the effect of some pulses is therefore to rotate between these subspaces (Supplementary Fig. S1). Basis sets and superoperators are tabulated in Supplementary Table S1. To implement frequency discrimination, cosine and sine modulated amplitudes are obtained simultaneously as real and imag-inary components (Supplementary Fig. S1 and Table S1), and observable magnetisation at the point of acqui-sition is then mapped onto chemical states by the operator M+ (Table S1). Thus, for each spin, σ , we obtain a complex-valued (n1 × k) matrix Aσ, where n1 is the number of complex points and k is the number of states.
Next, for each spin lineshapes are calculated in the direct dimension via the McConnell equations6,8, e.g. in the case of three-state exchange:
ω ω ω Λ = − + + + + = ⋅ d dt M t M t M t R i R i R i K M t M t M t M t ( ) ( ) ( ) 0 0 0 0 0 0 ( ) ( ) ( ) ( ) (2) a b c a I aI b I bI c I cI a b c 2, 2, 2,
The evolution operator Λ is diagonalised, such that each eigenvalue λ i of Λ represents the complex frequency (i.e.
chemical shift and linewidth) of a Lorentzian resonance. From the eigenvectors we can determine the amplitudes of each eigenstate associated with starting populations of magnetisation in pure chemical states, and thus we can compute a (k × n2) matrix, Bσ, containing the combinations of Lorentzian lineshapes that originate from these pure states, where n2 is the number of (frequency domain) points in the direct dimension. We note that, if in the future the simulation of scalar coupled systems is required, the calculation at this stage could also be performed using a quantum mechanical density operator formalism as above.
The complete two-dimensional dataset can then be calculated, summing across all fitted spin systems, as
ω = ∑σ∈ σ σ
Y t( , )1 2 spinsA B . A window function can be applied directly to the indirect dimension, while in the
direct dimension apodization and, if required, a uniform3J
HNHA coupling, is introduced by convolution. Finally, the spectrum is Fourier transformed in the indirect dimension, with zero filling as required.
One-dimensional lineshape fitting.
1H and 15N lineshapes were obtained by integration over a rectan-gular region of interest, and these were fitted simultaneously to numerical solutions of the McConnell equations, with normalisation factors fitted for each spectrum, as previously described20,22.Validation by analysis of synthetic data.
Protein-ligand titrations were simulated with a fixed pro-tein concentration of 50 μM and ligand concentrations of 0, 12.5, 25, 50, 62.5 and 75 μM, with Kd values varied between 1 and 100 μM and koff values between 5 and 5000 s−1. The performance of the two-dimensional fitting algorithm was investigated with different levels of noise in the synthetic dataset, and the uncertainties in the fitted values were determined by bootstrapping using standard residual resampling, and by resampling of 5 × 5 blocks.Analysis of FIR RRM1-RRM2 interactions with FBP Nbox, FBP3 Nbox and oligonucleo
-tides.
Titration data, as previously described25, were processed with exponential line broadening using nmrPipe32, then imported into MATLAB for analysis with TITAN. Data were fitted to a two-state ligand binding model in a two-stage process: chemical shifts and linewidths of the free state were determined using the first spectrum only, then chemical shifts of the bound state, linewidths of all states, and the binding model parametersKd and koff were fitted using the entire dataset. Error estimation was performed by residual resampling using 200 replicas and a 5 × 5 block size.
CaM-TFP titration and analysis.
Following previous protocols26, a 41 μM sample of uniformly 15N-labelled rat calmodulin was prepared in 10 mM imidazole (pH 6.5), 100 mM KCl, 100 μM EDTA, 5 mM CaCl2, 10% (v/v) D2O, 0.001% (w/v) DSS, and titrated with 5 mM or 50 mM stocks of TFP in an identical buffer to give TFP:CaM ratios of 0, 0.30, 0.61, 0.91, 1.22, 1.52, 1.83, 2.13, 2.44, 2.74, 3.05, 3.35, 3.66, 3.96, 4.27, 4.57, 4.88, 5.49, 6.10, 7.32, 9.76, 14.63 and 24.39. At each point, FHSQC experiments were acquired (298 K, spectral width 18 × 31 ppm, acquisition times 107 × 32 ms, 16 scans, 1.5 s recycle delay) using a Bruker Avance III NMR spectrometer oper-ating at 800 MHz. Spectra were referenced to internal DSS33 and processed with 4 Hz and 10 Hz exponential line broadening in the direct and indirect dimensions respectively using nmrPipe32. Processed spectra were fitted to a five-state sequential binding model in stages: unbound chemical shifts and linewidths were determined using the first spectrum only, then all other chemical shifts and binding model parameters were fitted using the entire dataset. Given the conformations of the various protein-TFP complexes were not expected to vary significantly, to reduce the number of free parameters resonance linewidths were fitted as shared parameters, equal across all states of the model. Error estimation was performed by residual resampling using 200 replicas and a 5 × 5 block size, performed in parallel using the UCL Legion high performance computing facility.References
1. Rosenzweig, R. & Kay, L. E. Bringing dynamic molecular machines into focus by methyl-TROSY NMR. Annu. Rev. Biochem.83,
291–315 (2014).
2. Barrett, P. J. et al. The quiet renaissance of protein nuclear magnetic resonance. Biochemistry52, 1303–1320 (2013).
3. Williamson, M. P. Using chemical shift perturbation to characterise ligand binding. Prog. Nucl. Magn. Reson. Spectrosc.73, 1–16 (2013).
4. Kovrigin, E. L. NMR line shapes and multi-state binding equilibria. J. Biomol. NMR53, 257–270 (2012).
5. Agafonov, R. V., Wilson, C., Otten, R., Buosi, V. & Kern, D. Energetic dissection of Gleevec’s selectivity toward human tyrosine kinases. Nat. Struct. Mol. Biol.21, 848–853 (2014).
www.nature.com/scientificreports/
7. Binsch, G. Unified theory of exchange effects on nuclear magnetic resonance line shapes. J. Am. Chem. Soc.91, 1304–1309 (1969). 8. McConnell, H. M. Reaction Rates by Nuclear Magnetic Resonance. J. Chem. Phys.28, 430–431 (1958).
9. Kern, D., Kern, G., Scherer, G., Fischer, G. & Drakenberg, T. Kinetic analysis of cyclophilin-catalyzed prolyl cis/trans isomerization by dynamic NMR spectroscopy. Biochemistry34, 13594–13602 (1995).
10. Beach, H., Cole, R., Gill, M. L. & Loria, J. P. Conservation of mus-ms enzyme motions in the apo- and substrate-mimicked state.
J. Am. Chem. Soc.127, 9167–9176 (2005).
11. Sugase, K., Dyson, H. J. & Wright, P. E. Mechanism of coupled folding and binding of an intrinsically disordered protein. Nature447,
1021–1025 (2007).
12. Kleckner, I. R. & Foster, M. P. An introduction to NMR-based approaches for measuring protein dynamics. Biochim. Biophys. Acta
1814, 942–968 (2011).
13. McKenna, S. et al. Energetics and specificity of interactions within Ub.Uev.Ubc13 human ubiquitin conjugation complexes.
Biochemistry42, 7922–7930 (2003).
14. Ababou, A., Pfuhl, M. & Ladbury, J. E. Novel insights into the mechanisms of CIN85 SH3 domains binding to Cbl proteins: solution-based investigations and in vivo implications. J. Mol. Biol.387, 1120–1136 (2009).
15. Arai, M., Ferreon, J. C. & Wright, P. E. Quantitative analysis of multisite protein-ligand interactions by NMR: binding of intrinsically disordered p53 transactivation subdomains with the TAZ2 domain of CBP. J. Am. Chem. Soc.134, 3792–3803 (2012).
16. Kato, H. et al. Architecture of the high mobility group nucleosomal protein 2-nucleosome complex as revealed by methyl-based NMR. Proc. Natl. Acad. Sci. USA108, 12283–12288 (2011).
17. Hawse, W. F. et al. TCR scanning of peptide/MHC through complementary matching of receptor and ligand molecular flexibility.
J. Immunol.192, 2885–2891 (2014).
18. O’Connor, C. & Kovrigin, E. L. Characterization of the second ion-binding site in the G domain of H-Ras. Biochemistry51,
9638–9646 (2012).
19. Motlagh, H. N., Wrabl, J. O., Li, J. & Hilser, V. J. The ensemble nature of allostery. Nature508, 331–339 (2014).
20. Greenwood, A. I. et al. Complete determination of the Pin1 catalytic domain thermodynamic cycle by NMR lineshape analysis.
J. Biomol. NMR51, 21–34 (2011).
21. Wang, M. et al. Dynamic NMR line-shape analysis demonstrates that the villin headpiece subdomain folds on the microsecond time scale. J. Am. Chem. Soc.125, 6032–6033 (2003).
22. Günther, U. L. & Schaffhausen, B. NMRKIN: simulating line shapes from two-dimensional spectra of proteins upon ligand binding.
J. Biomol. NMR22, 201–209 (2002).
23. Helgstrand, M., Härd, T. & Allard, P. Simulations of NMR pulse sequences during equilibrium and non-equilibrium chemical exchange. J. Biomol. NMR18, 49–63 (2000).
24. Bain, A. D. & Berno, B. Liouvillians in NMR: The direct method revisited. Prog. Nucl. Magn. Reson. Spectrosc.59, 223–244 (2011). 25. Cukier, C. D. et al. Molecular basis of FIR-mediated c-myc transcriptional control. Nat. Struct. Mol. Biol.17, 1058–1064 (2010). 26. Feldkamp, M. D., O’Donnell, S. E., Yu, L. & Shea, M. A. Allosteric effects of the antipsychotic drug trifluoperazine on the energetics
of calcium binding by calmodulin. Proteins78, 2265–2282 (2010).
27. Cook, W. J., Walter, L. J. & Walter, M. R. Drug binding by calmodulin: crystal structure of a calmodulin-trifluoperazine complex.
Biochemistry33, 15259–15265 (1994).
28. Vandonselaar, M., Hickie, R. A., Quail, J. W. & Delbaere, L. T. Trifluoperazine-induced conformational change in Ca(2+ )-calmodulin. Nat. Struct. Biol.1, 795–801 (1994).
29. Vertessy, B. G. et al. Simultaneous binding of drugs with different chemical structures to Ca2+ -calmodulin: crystallographic and spectroscopic studies. Biochemistry37, 15300–15310 (1998).
30. Mulder, F. A. A., Spronk, C. A. E. M., Slijper, M., Kaptein, R. & Boelens, R. Improved HSQC experiments for the observation of exchange broadened signals. J. Biomol. NMR8, 223–228 (1996).
31. Ollerenshaw, J. E., Tugarinov, V. & Kay, L. E. Methyl TROSY: explanation and experimental verification. Magn. Reson. Chem.41,
843–852 (2003).
32. Delaglio, F. et al. NMRPipe: a multidimensional spectral processing system based on UNIX pipes. J. Biomol. NMR6, 277–293 (1995).
33. Wishart, D. S. et al. 1 H, 13 C and 15 N chemical shift referencing in biomolecular NMR. J. Biomol. NMR6, 135–140 (1995).
Acknowledgements
We acknowledge the use of the UCL Biological NMR Facility, the UCL Legion High Performance Computing Facility (Legion@UCL), and the MRC for access to the Biomedical NMR Centre at the Francis Crick Institute, London. The research was supported by a Wellcome Trust Investigator Award 097806/Z/11/Z (C.A.W. and J.C.).
Author Contributions
C.A.W. conceived the analysis strategy, wrote the code, designed and performed experiments, and analyzed data. A.R. provided experimental data and edited the manuscript. L.D.C. provided reagents. C.A.W. and J.C. wrote the manuscript.
Additional Information
Supplementary information accompanies this paper at http://www.nature.com/srep Competing financial interests: The authors declare no competing financial interests.
How to cite this article: Waudby, C. A. et al. Two-Dimensional NMR Lineshape Analysis. Sci. Rep. 6, 24826; doi: 10.1038/srep24826 (2016).