R E S E A R C H
Open Access
Relationship between cardiac diffusion
tensor imaging parameters and
anthropometrics in healthy volunteers
L.A. McGill
1,2, P.F. Ferreira
1,2, A.D. Scott
1,2, S. Nielles-Vallespin
1,3, A. Giannakidis
1,2, P.J. Kilner
1,2, P.D. Gatehouse
1,2,
R. de Silva
1,2, D.N. Firmin
1,2and D.J. Pennell
1,2*Abstract
Background:In vivo cardiac diffusion tensor imaging (cDTI) is uniquely capable of interrogating laminar myocardial dynamics non-invasively. A comprehensive dataset of quantative parameters and comparison with subject
anthropometrics is required.
Methods:cDTI was performed at 3T with a diffusion weighted STEAM sequence. Data was acquired from the mid left ventricle in 43 subjects during the systolic and diastolic pauses. Global and regional values were determined for fractional anisotropy (FA), mean diffusivity (MD), helix angle gradient (HAg, degrees/%depth) and the secondary eigenvector angulation (E2A). Regression analysis was performed between global values and subject
anthropometrics.
Results:All cDTI parameters displayed regional heterogeneity. The RR interval had a significant, but clinically small effect on systolic values for FA, HAg and E2A. Male sex and increasing left ventricular end diastolic volume were associated with increased systolic HAg. Diastolic HAg and systolic E2A were both directly related to left ventricular mass and body surface area. There was an inverse relationship between E2A mobility and both age and ejection fraction.
Conclusions:Future interpretations of quantitative cDTI data should take into account anthropometric variations observed with patient age, body surface area and left ventricular measurements. Further work determining the impact of technical factors such as strain and SNR is required.
Keywords:Diffusion tensor imaging, Fractional anisotropy, Mean diffusivity, Eigenvector, Helix angle, Helix angle gradient, Sheetlet
Background
The cardiac musculature has a unique structure with myocytes winding progressively from a left-handed helix in the epicardium, to circumferential in the mid wall, to a right handed-helix in the endocardium [1–3]. The link between this structure and cardiac function is complex, and as yet not fully understood. During systolic contrac-tion wall thickness increases by 30–50% radially, how-ever this cannot be fully accounted for by myocyte
thickening of ~8% [4–6], or changes in helix angle alone [1, 7]. There is increasing evidence that laminar myocar-dial structures, called sheetlets, provide a further contri-bution to wall thickening through systolic reorientation from the longitudinal to the radial plane [6, 8–11]. Fur-thermore reduced sheetlet mobility has been linked with myocardial hypertrophy in hypertrophic cardiomyopathy [8]. However, there remains a paucity of in vivo data assessing the dynamic function of myocytes and sheet-lets in healthy hearts.
Diffusion tensor imaging (DTI) is an MRI technique, which enables novel in vivo interrogation of biological sue structures noninvasively. DTI exploits the fact that tis-sue components, such as cell walls and collagen, act as * Correspondence:dj.pennell@rbht.nhs.uk
Firmin DN and Pennell D are Joint senior authors
1NIHR Cardiovascular Biomedical Research Unit, Royal Brompton Hospital,
Sydney Street, London SW3 6NP, UK
2National Heart and Lung Institute, Imperial College, London, UK
Full list of author information is available at the end of the article
natural barriers to diffusion resulting in anisotropy in the measured diffusion. When diffusion sensitizing gradients are applied, the degree of signal attenuation is dependent on the orientation of the gradient, with the greatest attenu-ation observed when gradients are applied parallel to the long axis of cells i.e. the orientation of greatest diffusion [12]. By measuring diffusion in 6 or more non-collinear di-rections a diffusion ellipsoid, or diffusion tensor, can be cal-culated, which represents the anisotropic diffusion in 3 dimensions. A number of quantitative parameters describ-ing the orientation and arrangement of tissue microstruc-tures can be derived from this tensor [13].
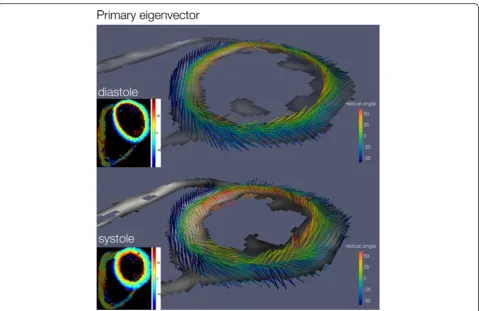
DTI is an established technique in central nervous sys-tem imaging [14–17] but there is increasing interest in cardiac DTI (cDTI) and a number of studies have vali-dated cDTI findings against myocardial histology [18–20]. The primary eigenvector (the principal diffusion direction) aligns with the long axis of myocytes, thus allowing the helical structure of the myocardium to be characterised [21]. Laminar structures, such as sheetlets and shear layers, tend to lie oblique to the local wall plane; therefore the direction of the secondary eigenvector of diffusion (E2A) is thought to align with the principal population of sheetlets in a voxel [10, 11, 22–25]. In light of its complex structure, historically the left ventricular (LV) myoarchi-tecture has proven remarkably resistant to functional as-sessment. In vivo cDTI is therefore uniquely capable of combining non-invasive interrogation of laminar struc-tures with functional analysis.
In vivo cDTI remains challenging in light of the diffi-culty of measuring small scale diffusion in the face of myocardial strain and bulk cardiac motion, nonetheless our group has established that the in vivo cDTI STEAM sequence has both good inter and intra-centre reprodu-cibility [26–28]. There is also a growing body of evidence that cardiovascular disease processes result in detectable differences in quantitative cDTI parameters [8, 29–33], however the relationship between healthy subject anthropometrics and cDTI parameters has yet to be established. In this work we examine the relation be-tween laminar myocardial structures, via quantitative cDTI parameters, and anthropometrics within a cohort of healthy volunteers.
Methods
Study population
We prospectively recruited 46 healthy volunteers for cDTI. Subjects were screened and excluded in the event of the following: significant co-morbidities; risk factors for ischaemic heart disease; high blood pressure; or an abnor-mal ECG. The study was approved by the National Re-search Ethics Service Committee South East Coast-Surrey, and was conducted in accordance with the principles set
out in the declaration of Helsinki, with written informed consent obtained from all volunteers.
Image acquisition
Images were acquired using a clinical 3T scanner (Mag-netom Skyra, Siemens AG Healthcare Sector, Erlangen, Germany) with an anterior 18 element matrix coil and 8–12 elements of a matrix spine coil. Functional and volumetric data was determined from breath hold, retro-spectively gated bSSFP cine acquisition in three long axis planes and contiguous short axes from the atrioventricu-lar ring to the apex [34]. The timing of subject specific systolic and diastolic pauses were determined from a high temporal resolution, retrogated cine in the mid-ventricular short axis plane. cDTI data were acquired in held expiration with a monopolar diffusion weighted stimulated echo sequence (DW-STEAM), triggered on every other R wave [26]. The acquisition time was short-ened with parallel imaging and a reduced field of view in the phase encoding direction [35]. Data was acquired in 3 mid ventricular slices during the systolic and diastolic pauses. Slice position was tracked between systole and diastole with a breath-hold spoiled gradient echo (GRE) sequence with a spatial modulation of magnetization (SPAMM) tagging prepulse in the 2 and 4 chamber views. The linear tags were separated by 16 mm and were perpendicular to the long-axis with an acquired spatial resolution of 2.1 × 1.7 mm in-plane and slice thickness of 6 mm. The displacement of the linear tag closest to the central mid- ventricular slice was manually tracked from the systolic to the diastolic phase.
minimum of 8 times, with up to 13 repetitions when one or more acquisitions were affected by motion artefacts from breathing or ectopy. Breath-hold duration was 18 cardiac cycles, which was typically 18 s. The order that the diffusion directions were acquired was also rotated to avoid losing data from the same direction at the end of each breath hold. The typical duration of the scan was 45 min.
Diffusion tensor analysis
All cDTI data was analysed by a single observer with in-house custom-built software written in MATLAB (Mathworks, MA, USA). This included a quality control step to reject images visually corrupted by artefacts and rigid co-registration of the remaining images [37]. The RR-intervals during the acquisition were calculated from the acquisition times recorded in the DICOM files. The b-value of each diffusion image was then adjusted with this information. The eigensystem (eigenvalues and ei-genvectors) was calculated for each voxel from a rank 2 diffusion tensor using the“B-matrix approach”described by Kingsley [38]. Infrequently, eigenvalues were mea-sured as negative, and when these were present, they were set to the mean of the corresponding non-negative eigenvalues in neighbouring voxels.
Two scalar diffusion parameter maps were calculated from the eigensystems: Fractional Anisotropy (FA) and Mean Diffusivity (MD) [13]. FA is an index of the degree of deviation of the observed diffusion from isotropic and ranges from 0 (completely isotropic) to 1 (completely anisotropic), and MD measures the average diffusivity of the tensor. The primary, or largest eigenvector (E1) of the diffusion tensor was taken to represent mean intra-voxel myocycte orientation [18–20]. The helix angle (HA) was calculated by projecting E1 radially to the local wall tangent plane. HA was defined as the angle in this plane between the E1 projection and the circumferential direction in the range −90 to 90°, being positive (right-handed helix) if rotated counter-clockwise from the cir-cumferential as viewed from the outside, and negative (left-handed helix) if rotated clockwise [22]. To obtain a single value relating to helix angle, a gradient was calcu-lated from best-fit radial projections drawn from the centre of the ventricle to the epicardial border. The gra-dient data are presented in two formats: HAG (degrees/ mm) and HAg (degrees/%depth). Both HAG [28] and HAg [9] have previously been employed in HA analyses, with the latter permitting analysis of true angular change with a reduced dependence on wall thickness.
The secondary eigenvector (E2A) was taken to repre-sent the mean sheetlet orientation [22–25]. The cross-myocyte plane, perpendicular to E1, was calculated for each voxel. The secondary eigenvector angle (E2A) was taken as the angle between E2A and the cross-myocyte
direction. This angle was measured in the range 0–90, with zero degrees as being aligned to the local LV wall. E2A mobility was defined as the change of mean abso-lute E2A values from diastole to systole. E2A mobility uses the absolute value of the angle so polarity is ignored to provide a measure of change of angulation.
Global values for FA, MD, HAg and E2A were calcu-lated in systole and diastole. . The myocardium was then divided into 4 segments for each slice and the same seg-ments in each slice were grouped into the conventional LV walls (anterior, septal, inferior, lateral) [39]. Care was taken to exclude papillary muscle regions and septal contributions from the right ventricle. The post-processing and analysis time was approximately 1 h per subject.
Image analysis
Ventricular volumes, function, mass, and ejection frac-tion for all patients were measured for the LV using a semi-automated threshold-based technique (CMRtools, Cardiovascular Imaging Solutions, London). All volume and mass measurements were also indexed to body sur-face area [40, 41].
Statistical analysis
Statistical analysis was performed using IBM SPSS Statistics software, version 22. Cohort characteristics are presented as the mean ± SD or median & range, and per-centage for categorical data. Variations in parameters between slices were assessed, with no discernible be-tween slice difference for FA, MD and HAg; global and regional data are thus presented from all three slices to reduce parameter variation. However, despite a small interspace gap, there were significant between slice varia-tions in E2A data, therefore global and regional wall E2A data are presented from the mid slice only. Comparison of regional data was conducted with a one-way repeated measures ANOVA, with correction for non-spherical data. Post hoc analysis was performed with paired t-tests with Bonferroni correction, taking the lateral wall as the reference.
Results
Study population
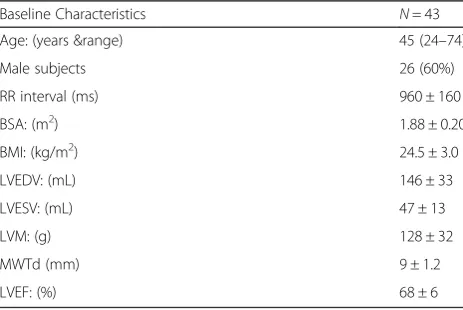
The baseline anthropometrics and CMR data of the study population are shown in Table 1. A total of 46 vol-unteers were recruited, 2 were excluded due to ECG ir-regularities, and 1 further subject was excluded due to poor quality diastolic data. Therefore data are presented for 43 subjects.
Global and regional cDTI results
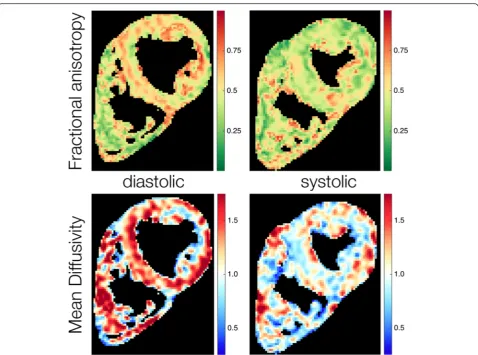
Fractional anisotropy A comparison of regional systolic and diastolic FA values is given in Table 2. An example parameter map of FA in systole and diastole is given in Fig. 1. The global systolic FA was 0.47 ± 0.05. With the lat-eral wall as the reference, the FA was greater in the inferior (p= 0.007) and anterior (p= 0.017) walls. Global diastolic FA was 0.56 ± 0.04. The lateral wall FA was less than the anterior (p< 0.001), inferior (p< 0.001) and septal walls (p = 0.004).
Mean diffusivity Regional systolic and diastolic MD values are shown in Table 3, an example parameter map of MD in systole and diastole is shown in Fig. 1. Global systolic MD was 0.93 ± 0.14 × 103mm2/s. There were no regional differences in systolic MD (p= 0.22). Global dia-stolic MD was 1.11 ± 0.13 × 103 mm2/s. The lateral wall MD was significantly greater than the anterior (p< 0.001) and inferior walls (p= 0.01).
Helix angle gradient The helix angle in systole and dia-stole is depicted in 3D in Fig. 2. Transmural and regional helix angle values are represented in a Bullseye plot in Fig. 3. Regional, systolic and diastolic HAg values are displayed in Table 4. The global systolic HAg was 0.91 ± 0.11°. In com-parison to the lateral wall HAg was greater in the septum
(p= 0.007) and less in the inferior wall (p< 0.001). Global diastolic HAg was 0.68 ± 0.1°. HAg was greater in the anter-ior wall (p< 0.001) and the septum (p< 0.001) compared to the lateral wall.
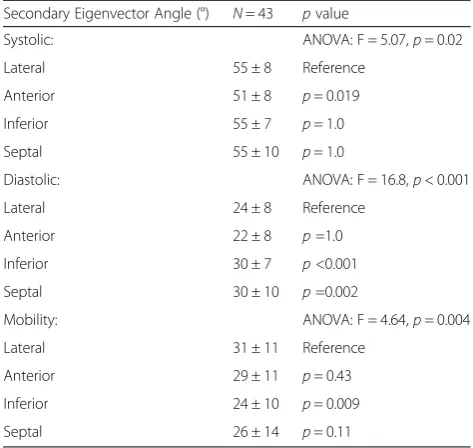
Secondary eigenvector angle E2A angles and E2A mo-bility in both cardiac phases showed significant between slice variation with greatest angulation in the basal slice (Systole: apical 47 ± 6°, mid 54 ± 6° , basal 58 ± 4° p< 0.001; Diastole: apical 23 ± 5° , mid 26 ± 6° , basal 29 ± 6° p< 0.001; Mobility: apical 24 ± 9°, mid 27 ± 8°, basal 29 ± 7°, p=0.006). Regional systolic and diastolic, mid slice E2A values are given in Table 5. E2A in systole and diastole is represented in 3D in Fig. 4. Global systolic E2A was 54 ±6°. Systolic E2A was greater in the lateral wall compared to the anterior wall(p= 0.019). Global diastolic E2A was 26 ± 6°. Regional diastolic E2A was less in the lateral wall compared to the inferior (p< 0.001) and septal walls (p= 0.002). Global E2A mobility was 27 ± 8°. Regionally E2A mobility was greater in the lateral wall compared to the inferior wall (p= 0.009).
Relationship between subject anthropometrics and cDTI Parameters
Fractional anisotropy There was a significant relation-ship between global systolic FA and RR interval with a decrease in FA of 0.013 for every 100 ms increase in RR (Standardised coefficient −0.43, p= 0.004). No subject characteristics were associated with global diastolic FA.
[image:4.595.306.540.110.262.2]Mean diffusivity Diastolic MD was 0.078 × 103 mm2/s less in male patients (Standardised coefficient −0.31, p= 0.046). RR interval was inversely associated with diastolic MD (Standardised coefficient −0.30, p= 0.048), with a 100 ms increase in RR interval associated with 0.024 × 103 mm2/s decrease in MD. LV wall thickness was also
Table 1Baseline characteristics mean ± SD, or median & range
Baseline Characteristics N= 43
Age: (years &range) 45 (24–74)
Male subjects 26 (60%)
RR interval (ms) 960 ± 160
BSA: (m2) 1.88 ± 0.20
BMI: (kg/m2) 24.5 ± 3.0
LVEDV: (mL) 146 ± 33
LVESV: (mL) 47 ± 13
LVM: (g) 128 ± 32
MWTd (mm) 9 ± 1.2
LVEF: (%) 68 ± 6
BSAbody surface area,BMIbody mass index,LVEDVLeft ventricular end diastolic volume,LVESVLeft ventricular end systolic volume,LVM,Left ventricular mass,MWTdMaximum wall thickness in diastole,LVEFleft ventricular ejection fraction
Table 2Regional fractional anisotropy in systole and diastole, mean ± SD
Fractional Anisotropy N= 43 pvalue
Systolic: ANOVA: F = 5.21,p= 0.003
Lateral 0.46 ± 0.05 Reference
Anterior 0.48 ± 0.05 p= 0.017
Inferior 0.48 ± 0.06 p= 0.007
Septal 0.46 ± 0.07 p= 1.0
Diastolic: ANOVA: F = 16.0,p<0.001
Lateral 0.52 ± 0.07 Reference
Anterior 0.59 ± 0.05 p< 0.001
Inferior 0.59 ± 0.05 p< 0.001
Septal 0.54 ± 0.09 p= 0.004
[image:4.595.57.289.544.699.2]inversely related to diastolic MD (−0.37, p= 0.015). There were no significant associations between subject anthropometrics and global systolic MD.
Helix angle gradient Global systolic HAg was directly related to RR interval (Standardised coefficient 0.51,p< 0.001), with a 100 ms increase in RR interval accounting for an increase in HA between the endo and epicardium of 3°. There was also a direct relationship between sys-tolic HAg and LV end diassys-tolic volume (EDV) (Standar-dised coefficient 0.51, p< 0.001), LV end systolic volume (ESV) (Standardised coefficient 0.33, p= 0.033) & LV mass (Standardised coefficient 0.35, p= 0.021). Global diastolic HAg was 0.11°/% greater in male patients, p< 0.001. Global diastolic HAg was also directly related to BSA (Standardised coefficient 0.44, p= 0.003), LVESV (Standardised coefficient 0.33, p= 0.031), LV Mass (Standardised coefficient 0.37, p= 0.015), and maximum wall thickness in diastole (MWTd) (Standar-dised coefficient 0.33,p= 0.029).
[image:5.595.59.538.85.440.2]Fig. 1Example parameter maps of fractional anisotropy and mean diffusivity in systole and diastole. Minor regional heterogeneity is observed in both FA and MD
Table 3Regional mean diffusivity (×103mm2/s) in systole and diastole, mean ± SD
Mean Diffusivity (×103mm2/s) N= 43 pvalue
Systolic: ANOVA: F = 1.50,p= 0.22
Lateral 0.95 ± 0.16
Anterior 0.90 ± 0.18
Inferior 0.93 ± 0.18
Septal 0.94 ± 0.18
Diastolic: ANOVA: F = 14.3,p<0.001
Lateral 1.20 ± 0.24 Reference
Anterior 0.99 ± 0.15 p<0.001
Inferior 1.05 ± 0.18 p= 0.01
Septal 1.20 ± 0.25 p= 1.0
[image:5.595.58.291.562.714.2]Global systolic and diastolic HAG data were also regressed against subject anthropometrics. Systolic HAG was 0.41°/mm less in male patients,p= 0.005. HAG was inversely related to BSA (Standardised coefficient −0.39, p= 0.01), LVEDV (Standardised coefficient −0.36, p= 0.019), LVMass (Standardised coefficient −0.54, p< 0.001), MWTd (Standardised coefficient −0.57, p< 0.001). Global diastolic HAG was inversely related to age (Standardised coefficient−0.50, p= 0.001), EF (Stan-dardised coefficient −0.37, p = 0.014) and MWTd (Stan-dardised coefficient−0.45,p= 0.002).
Secondary eigenvector angle Global systolic E2A was directly related to the RR interval, with an increase in RR of 100 ms associated with an increase in systolic E2A of 1° (p= 0.011). Systolic E2A was also related to BSA (Standar-dised coefficient 0.36, p= 0.019), LV Mass (Standardised coefficient 0. 49, p= 0.001), LVEDV (Standardised coeffi-cient 0.31,p= 0.044) and MWTd (Standardised coefficient 0.48, p= 0.001). There were no associations between subject anthropometrics and global diastolic E2A. E2A mobility was inversely related to both age (Standardised coefficient−0.40,p= 0.008) and ejection fraction (Standar-dised coefficient 0.45,p= 0.002).
Discussion
This work is one of the largest healthy volunteer in vivo cDTI study to date, and the first to study the relation-ship between subject anthropometrics and quantitative cardiac parameters. This is important because without a clear understanding of normal variation and clinical fac-tors that may affect the cDTI measurements, it is not possible to interpret findings in pathological states with any confidence.
Global and regional analysis
[image:6.595.59.539.85.396.2]previously reported by Wu et al. [30]. We suggest that our observations are most likely due to technical factors such as variation in post processing techniques [28] and regional variations in SNR. One other potential cause of similar FA values on the lateral and septal walls but dif-fering from the values in the anterior and inferior walls is the artefacts caused by off-resonant spins. These arte-facts most commonly occur in the phase encoding direc-tion, which is usually most closely aligned with the anterior-posterior direction. However, the orientation of the heart varies on a patient-by-patient basis and similar patterns of heterogeneity would have been present in our previous work if this had been a substantial contributor.
Global phasic results for MD also concur with previ-ous studies adopting this sequence [28, 42]. Regional variation was detected in diastole, with least diffusivity in the anterior wall. Again technical factors are likely to have, in part, contributed to the observed change, in-cluding regional SNR heterogeneity and the limited number pixels across the myocardium in diastole. We observed a regional variation of ~18% in diastolic MD, which is greater than the difference between infarct and remote zone reported by Wu et al.(b= 300 s/mm2) [30, 31], but significantly less than the difference between infarct and remote zone reported by Nyguen et al. (b= 400 s/mm2) [44]. As MD is the least reproducible of the cDTI parameters [27], caution must therefore be taken when interpreting MD results at lower b values. Fig. 3Bullseye plot of the average helix angle per LV regional wall
[image:7.595.57.291.86.435.2]and transmural layer (mean ± SD) in both systole and diastole
Table 4Regional Helix angle gradient (HAg, °/%) in systole and diastole, mean ± SD
Helix Angle Gradient(°/%) N= 43 pvalue
Systolic: ANOVA: F = 24.0,p< 0.001
Lateral 0.90 ± 0.16 Reference
Anterior 0.98 ± 0.21 p= 0.13
Inferior 0.76 ± 0.15 p< 0.001
Septal 1.0 ± 0.12 P= 0.007
Diastolic: ANOVA: F = 51.9,p< 0.001
Lateral 0.58 ± 0.13 Reference
Anterior 0.72 ± 0.12 p<0.001
Inferior 0.61 ± 0.13 p=1.0
Septal 0.83 ± 0.14 p<0.001
[image:7.595.303.540.121.345.2]Values are Bonferroni corrected and therefore a p value ofp< 0.05 was taken as the level of significance
Table 5Regional E2A (°) in systole and diastole and regional secondary eigenvector mobility, mean ± SD. Data is from the mid ventricular slice only
Secondary Eigenvector Angle (°) N= 43 pvalue
Systolic: ANOVA: F = 5.07,p= 0.02
Lateral 55 ± 8 Reference
Anterior 51 ± 8 p= 0.019
Inferior 55 ± 7 p= 1.0
Septal 55 ± 10 p= 1.0
Diastolic: ANOVA: F = 16.8,p< 0.001
Lateral 24 ± 8 Reference
Anterior 22 ± 8 p=1.0
Inferior 30 ± 7 p<0.001
Septal 30 ± 10 p=0.002
Mobility: ANOVA: F = 4.64,p= 0.004
Lateral 31 ± 11 Reference
Anterior 29 ± 11 p= 0.43
Inferior 24 ± 10 p= 0.009
Septal 26 ± 14 p= 0.11
[image:7.595.58.291.562.713.2]There remains a lack of consensus with regard to opti-mal helix angle presentation. In this work, we provide descriptive data of the angle by region and transmural layer, in addition to statistical comparison of regional helix angle gradient (HAg), acquired from best-fit, radial transmural projections. The advantage of the latter reduced sensitivity to ROI variation, but this is at the ex-pense of data smoothing. The systolic obliquity of myo-cyte helices and radial reorientation of sheetlet angles are becoming increasing recognised as important com-ponents of LV shortening and myocardial thickening re-spectively [6, 8–10, 22, 45–47]. This work provides further insights into regional variation of these struc-tures. The observed regional variation in HAg appears, par-tially attributable to the innate heterogeneity of wall thickness, with the steepest gradients observed in the septum. Despite data acquisition from 3 minimally spaced slices, E2A angles, in both cardiac phases, echoed results from Stoeck et al. [9], increasing significantly from the most apical slice to the most basal slice. Minor regional variation of uncertain significance was observed in diastolic E2A and E2A mobility with greatest mobility in the lateral wall.
Relationship between subject anthropometrics and cDTI Parameters
There have been no previous reports relating quantitative measures of cardiac cDTI to patient anthropometrics. This is important to understand, because the complex fac-tors that affect DTI measurements may be affected by simple clinical variables. We observed that, despite apply-ing heart rate correction to the b-value, there was residual heart rate dependent variability within global systolic FA, HAg and E2A measurements. However this effect was clinically small, with variation in parameters over a heart rate range of 60–100 bpm of 14° in epicardial to endocar-dial helix angle, 0.05 in FA, and 4° in systolic E2A. The reason behind this effect is unclear, but may be related to heart rate dependent changes in strain, or shorter mixing times at faster heart rates.
[image:8.595.57.538.87.430.2]myocardial thickness, nor does it have a constant abso-lute gradient in degrees/mm.
Diastolic E2A conformation was independent of sub-ject characteristics, but in systole increasing BSA, LV mass and LV wall thickness was associated with increas-ing radial orientation (an increase in LV mass of 50 g or BSA of 0.5 m2accounting for an increase in E2A of 4° and a 1 mm increment in wall thickness accounting for an increase of 2°). With regards to sheetlet mobility: within this healthy population with normal range ejec-tion fracejec-tions, an increase in EF of 10% was associated with a decrease in E2A mobility of 5°. Initially this seems somewhat counter intuitive as sheetlet mobility is per-ceived to be an integral component of LV function. However, increasing age was also associated with de-creasing E2A mobility and age related changes in LV function and volumes are well documented, with creasing EF and decreasing cardiac volumes with in-creasing age [40, 41]. The inverse relationship between E2A mobility and ejection fraction is therefore likely a reflection of the artificial age related increase in this measurement. Nonetheless, clinically these observations are relatively minor compared to disease related changes; with a difference in E2A mobility on average of 15° be-tween patients with hypertrophic cardiomyopathy and healthy volunteers [8].
Limitations
There are a number of limitations of this work, includ-ing the inherently low SNR and spatial resolution of the STEAM diffusion sequence; the possibly of misregistra-tion of slice averages, which could be age or gender dependent; and the potential for strain artefacts. We did not attempt strain correction of our results as we believe that contemporary strain measures are flawed by the assumption that the myocardium behaves like an isotropic jelly. The true impact of strain on quantitative cDTI parameters is a matter of significant debate in this field [8, 9, 45, 48, 49]. However, it remains that strain may have, in part, contributed to the observed phasic heterogeneity, as well as gender and age related asso-ciations [50, 51].
Conclusion
Quantitative cDTI parameters display anthropometric variation, most notably HAg which increases with cardiac size. The contribution of technical factors to regional par-ameter heterogeneity must be taken into consideration when making clinical interpretations at lower b values.
Abbreviations
bSSFP:balanced steady state free precession; BSA body surface area cDTI: cardiac diffusion tensor imaging; CMR: cardiovascular magnetic resonance; DW STEAM: diffusion weighted stimulated echo sequence; E2A: secondary eigenvector angle; EF ejection fraction EDV: end diastolic
volume; ESV: end systolic volume; FA: fractional anisotropy; GRE: gradient echo; HA: helical angle; HAg (degrees/%depth) HAG: helix angle gradient(degrees/mm); LV: left ventricle; MD: mean diffusivity; MWTd: maximum wall thickness in diastole; SNR: signal to noise ration; SPAMM: spatial modulation of magnetization; STEAM: stimulated echo sequence.
Competing interests
Professor Pennell is a consultant to Siemens and a stockholder and director of Cardiovascular Imaging Solutions. The remaining authors have no competing interests.
Authors’contributions
LAM designed the study, performed the CMR scans, initial processing and statistical analysis and drafted the manuscript. PFF performed the diffusion analysis and produced the graphics. ADS modified the sequence and provided physics support during data acquisition. SNV designed the diffusion STEAM sequence. DJP conceived the study and helped to prepare the manuscript. AG PJK RdS PDG DNF provided intellectual support and edited the manuscript. All authors read and approved the final manuscript.
Funding
This work was performed at the National Institute for Health Research Cardiovascular Biomedical Research Unit at The Royal Brompton Hospital and Imperial College London.
Author details
1NIHR Cardiovascular Biomedical Research Unit, Royal Brompton Hospital,
Sydney Street, London SW3 6NP, UK.2National Heart and Lung Institute,
Imperial College, London, UK.3National Heart, Lung and Blood Institute, National Institutes of Health, Bethesda, MD, USA.
Received: 6 August 2015 Accepted: 3 December 2015
References
1. Streeter DD, Spotnitz HM, Patel DP, Ross J, Sonnenblick EH. Fiber orientation in the canine left ventricle during diastole and systole. Circ Res. 1969;24(3):339–47.
2. Greenbaum RA, Ho SY, GIbson DG, Becker AE, Anderson RH. Left ventricular fibre architecture in man. Br Heart J. 1981;45:248–63.
3. Streeter DD, Hanna WT. Engineering mechanics for successive states in canine left ventricular myocardium: II. Fiber angle and sarcomere length. Circ Res. 1973;33(6):656–64.
4. Sonnenblick EH, Ross Jr J, Covell JW, Spotnitz HM, Spiro D. The ultrastructure of the heart in systole and diastole. Changes in sarcomere length. Circ Res. 1967;21(4):423–31. Epub 1967/10/01.
5. Spotnitz HM, Spotnitz WD, Cottrell TS, Spiro D, Sonnenblick EH. Cellular basis for volume related wall thickness changes in the rat left ventricle. J Mol Cell Cardiol. 1974;6(4):317–31. Epub 1974/08/01.
6. LeGrice IJ, Smaill BH, Chai LZ, Edgar SG, Gavin JB, Hunter PJ. Laminar structure of the heart: ventricular myocyte arrangement and connective tissue architecture in the dog. Am J Physiol. 1995;269(2 Pt 2):H571–82. Epub 1995/08/01.
7. Waldman LK, Nosan D, Villarreal F, Covell JW. Relation between transmural deformation and local myofiber direction in canine left ventricle. Circ Res. 1988;63(3):550–62. Epub 1988/09/01.
8. Ferreira PF, Kilner PJ, McGill LA, Nielles-Vallespin S, Scott AD, Ho SY, et al. In vivo cardiovascular magnetic resonance diffusion tensor imaging shows evidence of abnormal myocardial laminar orientations and mobility in hypertrophic cardiomyopathy. J Cardiovasc Magn Reson. 2014;16:87. Epub 2014/11/13.
9. Stoeck CT, Kalinowska A, von Deuster C, Harmer J, Chan RW, Niemann M, et al. Dual-phase cardiac diffusion tensor imaging with strain correction. PLoS One. 2014;9(9), e107159. Epub 2014/09/06.
11. LeGrice IJ, Takayama Y, Covell JW. Transverse shear along myocardial cleavage planes provides a mechanism for normal systolic wall thickening. Circ Res. 1995;77(1):182–93. Epub 1995/07/01.
12. Moseley ME, Cohen Y, Kucharczyk J, Mintorovitch J, Asgari HS, Wendland MF, et al. Diffusion-weighted MR imaging of anisotropic water diffusion in cat central nervous system. Radiology. 1990;176(2):439–45. Epub 1990/08/01. 13. Basser PJ. Inferring microstructural features and the physiological state of
tissues from diffusion-weighted images. NMR Biomed. 1995;8(7–8):333–44. Epub 1995/11/01.
14. Basser PJ, Pajevic S, Pierpaoli C, Duda J, Aldroubi A. In vivo fiber tractography using DT-MRI data. Magn Reson Med. 2000;44(4):625–32. Epub 2000/10/12. 15. Jones DK, Simmons A, Williams SC, Horsfield MA. Non-invasive assessment
of axonal fiber connectivity in the human brain via diffusion tensor MRI. Magn Reson Med. 1999;42(1):37–41. Epub 1999/07/10.
16. Shimony JS, McKinstry RC, Akbudak E, Aronovitz JA, Snyder AZ, Lori NF, et al. Quantitative diffusion-tensor anisotropy brain MR imaging: normative human data and anatomic analysis. Radiology. 1999;212(3):770–84. Epub 1999/09/09.
17. Setsompop K, Kimmlingen R, Eberlein E, Witzel T, Cohen-Adad J, McNab JA, et al. Pushing the limits of in vivo diffusion MRI for the Human Connectome Project. NeuroImage. 2013;80:220–33. Epub 2013/05/28.
18. Hsu EW, Muzikant AL, Matulevicius SA, Penland RC, Henriquez CS. Magnetic resonance myocardial fiber-orientation mapping with direct histological correlation. Am J Physiol. 1998;274(5 Pt 2):H1627–34. Epub 1998/06/05. 19. Scollan DF, Holmes A, Winslow R, Forder J. Histological validation of
myocardial microstructure obtained from diffusion tensor magnetic resonance imaging. Am J Physiol. 1998;275(6 Pt 2):H2308–18. Epub 1998/12/09. 20. Holmes AA, Scollan DF, Winslow RL. Direct histological validation of
diffusion tensor MRI in formaldehyde-fixed myocardium. Magn Reson Med. 2000;44(1):157–61. Epub 2000/07/14.
21. Lombaert H, Peyrat JM, Croisille P, Rapacchi S, Fanton L, Cheriet F, et al. Human atlas of the cardiac fiber architecture: study on a healthy population. IEEE Trans Med Imaging. 2012;31(7):1436–47. Epub 2012/04/07. 22. Kung GL, Nguyen TC, Itoh A, Skare S, Ingels Jr NB, Miller DC, et al. The
presence of two local myocardial sheet populations confirmed by diffusion tensor MRI and histological validation. J Magn Reson Imaging. 2011;34(5): 1080–91. Epub 2011/09/21.
23. Tseng WY, Wedeen VJ, Reese TG, Smith RN, Halpern EF. Diffusion tensor MRI of myocardial fibers and sheets: correspondence with visible cut-face texture. J Magn Reson Imaging. 2003;17(1):31–42. Epub 2002/12/25. 24. Helm PA, Tseng HJ, Younes L, McVeigh ER, Winslow RL. Ex vivo 3D diffusion
tensor imaging and quantification of cardiac laminar structure. Magn Reson Med. 2005;54(4):850–9. Epub 2005/09/09.
25. Helm P, Beg MF, Miller MI, Winslow RL. Measuring and mapping cardiac fiber and laminar architecture using diffusion tensor MR imaging. Ann N Y Acad Sci. 2005;1047:296–307. Epub 2005/08/12.
26. Nielles-Vallespin S, Mekkaoui C, Gatehouse P, Reese TG, Keegan J, Ferreira PF, et al. In vivo diffusion tensor MRI of the human heart: reproducibility of breath-hold and navigator-based approaches. Magn Reson Med. 2013;70(2): 454–65. Epub 2012/09/25.
27. McGill LA, Ismail TF, Nielles-Vallespin S, Ferreira P, Scott AD, Roughton M, et al. Reproducibility of in-vivo diffusion tensor cardiovascular magnetic resonance in hypertrophic cardiomyopathy. J Cardiovasc Magn Reson. 2012; 14:86. Epub 2012/12/25.
28. Tunnicliffe EM, Scott AD, Ferreira P, Ariga R, McGill LA, Nielles-Vallespin S, et al. Intercentre reproducibility of cardiac apparent diffusion coefficient and fractional anisotropy in healthy volunteers. J Cardiovasc Magn Reson. 2014; 16:31. Epub 2014/06/03.
29. Tseng WY, Dou J, Reese TG, Wedeen VJ. Imaging myocardial fiber disarray and intramural strain hypokinesis in hypertrophic cardiomyopathy with MRI. J Magn Reson Imaging. 2006;23(1):1–8. Epub 2005/12/07.
30. Wu MT, Tseng WY, Su MY, Liu CP, Chiou KR, Wedeen VJ, et al. Diffusion tensor magnetic resonance imaging mapping the fiber architecture remodeling in human myocardium after infarction: correlation with viability and wall motion. Circulation. 2006;114(10):1036–45. Epub 2006/08/31. 31. Wu MT, Su MY, Huang YL, Chiou KR, Yang P, Pan HB, et al. Sequential
changes of myocardial microstructure in patients postmyocardial infarction by diffusion-tensor cardiac MR: correlation with left ventricular structure and function. Circ Cardiovasc Imaging. 2009;2(1):32–40.
32. Abdullah OM, Drakos SG, Diakos NA, Wever-Pinzon O, Kfoury AG, Stehlik J, et al. Characterization of diffuse fibrosis in the failing human heart via
diffusion tensor imaging and quantitative histological validation. NMR Biomed. 2014;27(11):1378–86. Epub 2014/09/10.
33. Helm PA, Younes L, Beg MF, Ennis DB, Leclercq C, Faris OP, et al. Evidence of structural remodeling in the dyssynchronous failing heart. Circ Res. 2006; 98(1):125–32. Epub 2005/12/13.
34. Kramer CM, Barkhausen J, Flamm SD, Kim RJ, Nagel E. Standardized cardiovascular magnetic resonance imaging (CMR) protocols, society for cardiovascular magnetic resonance: board of trustees task force on standardized protocols. J Cardiovasc Magn Reson. 2008;10:35. Epub 2008/07/09.
35. Feinberg DA, Hoenninger JC, Crooks LE, Kaufman L, Watts JC, Arakawa M. Inner volume MR imaging: technical concepts and their application. Radiology. 1985;156(3):743–7. Epub 1985/09/01.
36. Griswold MA, Jakob PM, Heidemann RM, Nittka M, Jellus V, Wang J, et al. Generalized autocalibrating partially parallel acquisitions (GRAPPA). Magn Reson Med. 2002;47(6):1202–10. Epub 2002/07/12.
37. Guizar-Sicairos M, Thurman ST, Fienup JR. Efficient subpixel image registration algorithms. Opt Lett. 2008;33(2):156–8. Epub 2008/01/17. 38. Kinsley PB. Introduction to diffusion tensor imaging mathematics: part III.
Tensor calculation, noise, simulations, and optimization. Concepts Magn Reson Part A Bridg Educ Res. 2006;28A:155–79.
39. Cerqueira MD, Weissman NJ, Dilsizian V, Jacobs AK, Kaul S, Laskey WK, et al. Standardized myocardial segmentation and nomenclature for tomographic imaging of the heart. A statement for healthcare professionals from the cardiac imaging committee of the council on clinical cardiology of the american heart association. Circulation. 2002; 105(4):539–42. Epub 2002/01/30.
40. Maceira AM, Prasad SK, Khan M, Pennell DJ. Reference right ventricular systolic and diastolic function normalized to age, gender and body surface area from steady-state free precession cardiovascular magnetic resonance. Eur Heart J. 2006;27(23):2879–88. Epub 2006/11/08.
41. Maceira AM, Prasad SK, Khan M, Pennell DJ. Normalized left ventricular systolic and diastolic function by steady state free precession cardiovascular magnetic resonance. J Cardiovasc Magn Reson. 2006;8(3):417–26. Epub 2006/06/08.
42. Nielles-Vallespin S, Mekkaoui C, Gatehouse P, Reese TG, Keegan J, Ferreira PF, et al. Erratum to in vivo diffusion tensor MRI of the human heart: reproducibility of breath-hold and navigator based approaches. Magn Reson Med. 2014;72(2):599.
43. McGill LA, Scott AD, Ferreira PF, Nielles-Vallespin S, Ismail T, Kilner PJ, et al. Heterogeneity of fractional anisotropy and mean diffusivity measurements by in vivo diffusion tensor imaging in normal human hearts. PLoS One. 2015;10(7), e0132360. Epub 2015/07/16.
44. Nguyen C, Fan Z, Xie Y, Dawkins J, Tseliou E, Bi X, et al. In vivo contrast free chronic myocardial infarction characterization using diffusion-weighted cardiovascular magnetic resonance. J Cardiovasc Magn Reson. 2014;16:68. Epub 2014/09/19.
45. Dou J, Reese TG, Tseng WY, Wedeen VJ. Cardiac diffusion MRI without motion effects. Magn Reson Med. 2002;48(1):105–14. Epub 2002/07/12. 46. Dou J, Tseng WY, Reese TG, Wedeen VJ. Combined diffusion and strain MRI
reveals structure and function of human myocardial laminar sheets in vivo. Magn Reson Med. 2003;50(1):107–13. Epub 2003/06/20.
47. Mekkaoui C, Nielles-Vallespin S, Gatehouse PD, Jackowski MP, Firmin DN, Sosnovik DE. Diffusion MRI tractography of the human heart in vivo at end-diastole and end-systole. J Cardiovasc Magn Reson. 2012;14 Suppl 1:O49. 48. Axel L, Wedeen VJ, Ennis DB. Probing dynamic myocardial microstructure
with cardiac magnetic resonance diffusion tensor imaging. J Cardiovasc Magn Reson. 2014;16:89. Epub 2014/11/13.
49. Reese TG, Wedeen VJ, Weisskoff RM. Measuring diffusion in the presence of material strain. J Magn Reson B. 1996;112(3):253–8. Epub 1996/09/01. 50. Cheng S, Larson MG, McCabe EL, Osypiuk E, Lehman BT, Stanchev P, et al.
Age- and sex-based reference limits and clinical correlates of myocardial strain and synchrony: the Framingham heart study. J Cardiovasc Magn Reson. 2013;6(5):692–9. Epub 2013/08/07.