REVIEW
mTOR signaling in stem and progenitor cells
Delong Meng1,2,3, Anderson R. Frank1,2,3and Jenna L. Jewell1,2,3,*ABSTRACT
The mammalian target of rapamycin (mTOR) senses nutrients and growth factors to coordinate cell growth, metabolism and autophagy. Extensive research has mapped the signaling pathways regulated by mTOR that are involved in human diseases, such as cancer, and in diabetes and ageing. Recently, however, new studies have demonstrated important roles for mTOR in promoting the differentiation of adult stem cells, driving the growth and proliferation of stem and progenitor cells, and dictating the differentiation program of multipotent stem cell populations. Here, we review these advances, providing an overview of mTOR signaling and its role in murine and human stem and progenitor cells.
KEY WORDS: Amino acids, mTOR, Metabolism, Signaling, Stem cell
Introduction
Rapamycin was first isolated in 1972 from the bacteriumStreptomyces
hygroscopicusobtained from plants and soil collected from Easter Island (Rapa Nui). It was initially identified as an antifungal agent and an immunosuppressant, but was later discovered to possess anti-tumor properties (Eng et al., 1984; Martel et al., 1977; Vezina et al., 1975). Further studies revealed that rapamycin forms a complex with the 12 kDa peptidyl-prolyl cis-trans isomerase FK506-binding protein 12 (FKBP12), and inhibits cell growth and proliferation (Chung et al., 1992). In 1991, Michael Hall and colleagues discovered the protein target of rapamycin (TOR) by performing genetic screens in
Saccharomyces cerevisiae, demonstrating that mutated TOR genes confer rapamycin resistance (Heitman et al., 1991; Kunz et al., 1993). Subsequent studies identified mammalian target of rapamycin (mTOR) as the target of the rapamycin-FKBP12 complex in mammalian cells (Brown et al., 1994; Sabatini et al., 1994; Sabers et al., 1995). Importantly, rapamycin and rapamycin analogs (rapalogs) are currently used in the clinic as cancer therapeutics and as immunosuppressants following organ transplantation.
Since the discovery of mTOR, multiple studies have revealed that mTOR functions as a ‘master regulator’, integrating extracellular and intracellular signals to regulate downstream signaling cascades. Although mTOR regulation in cancer, diabetes and aging is relatively well-studied, the role of mTOR signaling in stem and progenitor cells is less clear. In this review, we discuss recent progress in our understanding of mTOR signaling in stem and progenitor cells, highlighting the role of mTOR in the self-renewal, differentiation, proliferation and fate determination of various human and mouse stem cell populations.
mTOR complexes and downstream targets
mTOR is a conserved protein kinase that belongs to the phosphatidylinositide 3 kinase (PI3K)-related kinase family. Yeast studies revealed that not all TOR functions are sensitive to rapamycin treatment, leading to the identification of two distinct complexes, known as mTORC1 and mTORC2 (Fig. 1) (Loewith et al., 2002). Rapamycin and rapalogs allosterically inhibit mTORC1 activity by interacting with FKBP12 (Jacinto et al., 2004; Loewith et al., 2002; Sarbassov et al., 2004). The rapamycin-FKBP12 complex binds to the FKB-rapamycin-binding (FRB) domain on mTOR, narrowing the catalytic space and blocking some substrates from the active site (Yang et al., 2013). Unlike mTORC1, mTORC2 is insensitive to acute rapamycin treatment. However, prolonged rapamycin treatment can inhibit mTORC2 assembly by sequestering mTOR (Phung et al., 2006; Sarbassov et al., 2006). In addition, new inhibitors that inhibit both mTORC1 and mTORC2, such as the ATP-mimetic Torin1, have been developed (Thoreen et al., 2009).
mTORC1
mTORC1 is made up of five well-characterized components (Fig. 1): mTOR, the catalytic subunit; regulatory-associated protein of mTOR (Raptor), which helps in substrate recognition (Hara et al., 2002; Kim et al., 2002); mammalian lethal with Sec13 protein 8 (mLST8, also known as GβL), a positive regulator of mTOR activity (Kim et al., 2003); and two negative regulators of mTOR activity, proline-rich AKT substrate 40 kDa (PRAS40) (Sancak et al., 2007; Vander Haar et al., 2007; Wang et al., 2007) and DEP-domain-containing mTOR-interacting protein (DEPTOR) (Peterson et al., 2009). Activated mTORC1 phosphorylates PRAS40, decreasing mTORC1-PRAS40 binding and enhancing mTORC1 signaling (Peterson et al., 2009; Wang et al., 2007). mTOR degrades DEPTOR through the E3 ubiquitin ligase SCF (βTrCP) controlling its own activation (Duan et al., 2011; Gao et al., 2011; Zhao et al., 2011). Raptor recruits several mTORC1 substrates, such as ribosomal S6 kinase (S6K) and eIF4E-binding protein (4EBP1 or PHAS-1), through their TOR signaling (TOS) motif (Nojima et al., 2003; Schalm et al., 2003). mTORC1 locates to lysosomes under nutrient-rich conditions; however, its non-lysosomal locations are unknown (Sancak et al., 2008).
mTORC1 signaling controls a number of cellular processes, including protein and lipid synthesis, autophagy and lysosome biogenesis, and growth factor signaling (Fig. 1) (reviewed by Jewell and Guan, 2013; Saxton and Sabatini, 2017). mTORC1 regulates protein synthesis through the phosphorylation of S6K and 4EBP1, which regulate translation initiation (reviewed by Ma and Blenis, 2009).De novo lipid synthesis is promoted by mTORC1 through sterol-responsive element-binding protein (SREBP) transcription factors (Porstmann et al., 2008), which can be activated by S6K or the phosphatidate phosphatase lipin 1, another mTORC1 substrate (Düvel et al., 2010; Peterson et al., 2011). By contrast, lipin 1 inhibits SREBP1 when mTORC1 signaling is inactivated. mTORC1 also suppresses protein catabolism via the process of autophagy. For example, when nutrients are abundant, mTORC1
1Department of Molecular Biology, University of Texas Southwestern Medical Center, Dallas, TX 75390, USA.2Harold C. Simmons Comprehensive Cancer Center, University of Texas Southwestern Medical Center, Dallas, TX 75390, USA. 3Hamon Center for Regenerative Science and Medicine, University of Texas Southwestern Medical Center, Dallas, TX 75390, USA.
*Author for correspondence ( jenna.jewell@utsouthwestern.edu)
J.L.J., 0000-0002-8021-9453
DEVEL
O
phosphorylates Unc-51-like kinase 1 (ULK1), thereby blocking ULK1 activation by 5′adenosine monophosphate-activated protein kinase (AMPK) and preventing autophagy (Kim et al., 2011). Moreover, mTORC1-mediated phosphorylation of transcription factor EB (TFEB), which regulates the expression of genes involved in autophagy and lysosomal biogenesis, inhibits TFEB nuclear translocation (Peterson et al., 2011; Roczniak-Ferguson et al., 2012). mTORC1 also negatively regulates PI3K and mitogen-activated protein kinase (MAPK)-mediated growth factor signaling by phosphorylating and stabilizing growth factor receptor-bound protein 10 (Grb10), a negative regulator of growth factor signaling (Hsu et al., 2011; Yu et al., 2011).
mTORC2
mTORC2 contains six well-characterized components (Fig. 1): mTOR; rapamycin-insensitive companion of mTOR (Rictor) (Jacinto et al., 2004; Sarbassov et al., 2004); the positive regulator mLST8 (GβL) (Kim et al., 2003); the negative regulator DEPTOR (Peterson et al., 2009); the regulatory subunit mammalian stress-activated MAPK-interacting protein 1 (mSin1) (Jacinto et al., 2006; Schroder et al., 2007; Yang et al., 2006); and protein observed with Rictor 1/2 (Protor1/2) (Pearce et al., 2007). mSin1 contains a plekstrin homology (PH) domain that binds to phosphatidylinositol 3,4,5-trisphosphate [PIP3, PtdIns(1,4,5)P3] at the plasma membrane, which is crucial for insulin-dependent activation of mTORC2 (Liu et al., 2015). Recently, mTORC2 was shown to localize to mitochondria and to a subpopulation of endosomal vesicles (Ebner et al., 2017).
mTORC2 phosphorylates several members of the protein kinase A, G and C (AGC) family, affecting ion transport and cell survival, cell growth and proliferation, and cytoskeletal remodeling (Fig. 1). For example, mTORC2 phosphorylates protein kinase C (PKC)α, PKCδ, PKCζ, PKCγand PKCεto regulate cytoskeletal remodeling and cell migration (Ebner et al., 2017; Gan et al., 2012; Li and Gao, 2014; Sarbassov et al., 2004; Thomanetz et al., 2013). A key component in growth factor signaling, RAC-α
serine/threonine-protein kinase (AKT/PKB), is also phosphorylated (at serine 473) and activated by mTORC2 (Sarbassov et al., 2004). AKT promotes cell growth and proliferation through downstream substrates such as Forkhead box O1/3 (FOXO1/3a), glycogen synthase kinase 3 β (GSK3β) and tuberous sclerosis 2 protein (Guertin et al., 2006; Jacinto et al., 2006). mTORC2 also phosphorylates and activates serum/glucocorticoid-regulated kinase 1 (SGK1), which controls ion transport and cell survival (Garcia-Martinez and Alessi, 2008).
Signaling upstream of mTOR
The activation of mTORC1 is controlled by growth factors, stress and nutrients (Fig. 2). Growth factor signaling upstream of PI3K activates mTORC2, which lies upstream of mTORC1. The tuberous sclerosis complex (TSC), which is composed of TSC1, TSC2 and TBC1D7, is a critical regulator of mTOR signaling that inhibits Ras homolog enriched in brain (Rheb), an activator of mTORC1. Mutations in the genes encoding TSC components cause the human diseases tuberous sclerosis or lymphangioleiomyomatosis (LAM), in which mTORC1 is constitutively active (Benvenuto et al., 2000; Chong-Kopera et al., 2006; Dibble et al., 2012; Garcia-Martinez and Alessi, 2008). TSC2 is a GTPase-activating protein (GAP) for Rheb, stimulating the guanosine-5′-triphosphate (GTP) hydrolysis activity of Rheb (Garami et al., 2003; Inoki et al., 2003; Saucedo et al., 2003; Stocker et al., 2003; Tee et al., 2002; Zhang et al., 2003). When Rheb is GTP bound, it and is thought to bind to and activate mTORC1 through an unknown mechanism (Garcia-Martinez and Alessi, 2008; Long et al., 2005; Sancak et al., 2007). Multiple upstream signals filter through TSC to regulate mTORC1 activity. AKT (Inoki et al., 2002; Manning et al., 2002), extracellular signal-regulated kinase (ERK) (Ma et al., 2005), ribosomal S6 kinase 1 (RSK1) (Roux et al., 2004) and IκB kinaseβ(IKKβ) (Lee et al., 2007) all phosphorylate and inhibit TSC, increasing mTORC1 activity. In contrast, TSC2 phosphorylation by glycogen synthase kinase 3β(GSK3β) increases TSC2 GAP activity (Inoki et al., 2006). mTORC1 also promotes a negative-feedback loop by suppressing
Raptor mTOR
PRAS40 DEPTOR mLST8
mTOR Rictor
mLST8 DEPTOR
mSin1 Protor1/2
mTORC1 mTORC2
S6K 4EBP1 Lipin1 ULK1 TFEB Grb10 PKC AKT SGK
Protein synthesisLipid synthesis Autophagy
Lysosome biogenesis
Growth factor signaling Cytoskeletal remodeling
Ion transport and cell survival Cell growth and proliferation
FKBP12
[image:2.612.157.457.57.229.2]Rapamycin
Fig. 1. Components of the mTORC1 and mTORC2 complexes.(Left) mTORC1 consists of the proteins mTOR, Raptor, mLST8, PRAS40 and DEPTOR. It regulates protein synthesis, lipid synthesis, autophagy, lysosome biogenesis and growth factor signaling by phosphorylating its substrates S6K, 4EBP1, lipin 1, ULK1, TFEB and Grb10. (Right) mTORC2 consists of mTOR, Rictor, mLST8, mSin1, DEPTOR and Protor1/2. It regulates cytoskeletal remodeling, cell growth and proliferation, ion transport, and cell survival through its downstream substrates PKC, AKT and SGK. mTORC1 is inhibited by acute rapamycin treatment (indicated by a solid inhibitory line), whereas mTORC2 is not inhibited by acute rapamycin treatment but is inhibited by prolonged rapamycin treatment (indicated by broken inhibitory line). Positive regulators in each complex are shown in green and negative regulators in red. 4EBP1, eIF4E-binding protein; AKT, RAC-α serine/threonine-protein kinase; DEPTOR, DEP-domain-containing mTOR-interacting protein; mLST8, mammalian lethal with Sec13 protein 8; mSin1, mammalian stress-activated MAPK-interacting protein 1; mTOR, mammalian target of rapamycin or mechanistic target of rapamycin; mTORC1, mTOR complex 1; mTORC2, mTOR complex 2; PKC, protein kinase C; PRAS40, proline-rich AKT substrate 40 kDa; Protor1/2, protein observed with Rictor 1 and 2; Raptor, regulatory-associated protein of mTOR; Rictor, rapamycin-insensitive companion of mTOR; S6K, ribosomal S6 kinase; SGK, serum/glucocorticoid-regulated kinase; TFEB, transcription factor EB; ULK1, Unc-51-like kinase 1.
DEVEL
O
PI3K signaling and mTORC2 activation (Saltiel and Kahn, 2001; White, 2002). Activated S6K, an mTORC1 substrate, phosphorylates insulin receptor substrate 1 (IRS1), decreasing its half-life (Harrington et al., 2004; Shah and Hunter, 2006; Shah et al., 2004; Tzatsos and Kandror, 2006; Um et al., 2004).
During nutrient starvation, AMPK phosphorylates numerous substrates to inhibit anabolic and promote catabolic processes (reviewed by Hardie et al., 2016). mTORC1 is directly inhibited by AMPK via Raptor phosphorylation, which increases Raptor-14-3-3 protein binding (Gwinn et al., 2008). AMPK, in turn, is activated by liver kinase B1 (LKB1), which is encoded by a tumor suppressor gene mutated in Peutz-Jeghers syndrome (Woods et al., 2003). In addition, AMPK phosphorylates TSC2, increasing TSC2 GAP activity and inhibiting mTORC1 (Gwinn et al., 2008; Inoki et al., 2006). Elevated expression of the hypoxia-inducible regulated in development and DNA damage response 1 (REDD1;DDIT4) gene can also inhibit mTORC1 signaling in a TSC-dependent manner (Brugarolas et al., 2004; Reiling and Hafen, 2004). In addition, mTORC1 is inhibited by DNA damage through induction of the tumor suppressor protein 53 (TP53) gene, which increases TSC activity (Feng et al., 2007).
Amino acid signaling to mTORC1
The amino acids leucine, arginine and glutamine stimulate mTORC1 activity, but whether other amino acids are able to activate mTORC1 remains unclear (Jewell et al., 2013). How mTORC1 senses amino
acids is a long-standing issue that is only beginning to be understood with the recent identification of two distinct pathways: one used by leucine and arginine to activate mTORC1 through the Rag GTPases (Fig. 3A); the other by glutamine to activate mTORC1 independently of the Rag GTPases (Fig. 3B).
Rag GTPase-dependent mTORC1 activation
Amino acids activate mTORC1 independently of growth factor signaling, as demonstrated by the finding that mTORC1 activity remains sensitive to amino acid starvation inTsc1orTsc2knockout cells (Byfield et al., 2005; Nobukuni et al., 2005; Smith et al., 2005). Subsequent studies identified the Rag GTPases as key mediators of amino acid signaling to mTORC1 (Fig. 3A) (Kim et al., 2008; Sancak et al., 2008). The Rag GTPase protein family in mice and humans consists of RagA, RagB, RagC and RagD (Sekiguchi et al., 2001). RagA and RagB, which are homologous and functionally redundant proteins, form a heterodimer with RagC or RagD, which are also highly similar and functionally redundant. This heterodimer stabilizes the Rag complex; accordingly, deletion of RagA and RagB results in the degradation of RagC and RagD (Jewell et al., 2015). Under amino acid-sufficient conditions, RagA/B is GTP bound and RagC/D is guanosine diphosphate (GDP) bound, forming the active Rag complex that binds to Raptor at the lysosome. A pentameric complex known as the Ragulator complex then anchors the Rag complex and mTORC1 to the lysosomal surface via the N-terminal region of the Ragulator component, p18 (Bar-Peled et al., 2012; Nada et al., 2009).
Lysosome Plasma
membrane Amino acids
Insulin receptor
EGFR
IRS PI3K
PIP2
PIP3
PTEN
mTORC2 Ribosomes
PDK1
AKT
TSC
Rheb
mTORC1
Grb2 SOS Ras
Raf
MEK
ERK
RSK
GSK3 Wnt
IKKβ TNFα
REDD1 Hypoxia
AMPK LKB1
Energy stress
p53
DNA damage
[image:3.612.143.471.59.297.2]Insulin/IGFs Growthfactors
Fig. 2. Pathways that regulate mTORC1 and mTORC2 signaling.A schematic of a cell showing insulin and EGFR receptors at the plasma membrane, and components of the mTOR signaling pathways located near the lysosome. mTORC1 is controlled by growth factors via the PI3K-AKT and Ras-MAPK pathways. PI3K catalyzes the phosphorylation of PIP2to PIP3, which in turn recruits PDK1 and AKT, facilitating the phosphorylation of AKT at T308 by PDK1. mTORC2 also
phosphorylates AKT at S473. Activated AKT then promotes mTORC1 activity by inhibiting the GAP activity of the TSC, thus activating Rheb, a potent mTORC1 activator. The Ras-MAPK pathway regulates mTORC1 through the Ras-Raf-MEK-ERK signaling cascade. ERK or its downstream substrate RSK inhibits TSC by direct phosphorylation. In addition, mTORC1 is controlled by Wnt signaling (through GSK3), by TNFα(through IKKβ), by hypoxia (through REDD1) and by DNA damage (through p53). Energy stress also regulates mTORC1, acting via LKB1 and AMPK. Positive regulators of mTORC1 or mTORC2 are shown in green and negative regulators in red. AMPK, AMP-activated protein kinase; AKT, RAC-αserine/threonine-protein kinase; EGFR, epidermal growth factor receptor; ERK, extracellular signal-regulated kinase; GAP, GTPase activating protein; Grb2, growth factor receptor-bound protein 2; GSK3, glycogen synthase kinase 3; IKKβ, IκB kinaseβ; IRS, insulin receptor substrate; LKB1, liver kinase B1; MAPK, mitogen-activated protein kinase; MEK, MAPK/ERK kinase; mTOR, mammalian target of rapamycin or mechanistic target of rapamycin; mTORC1, mTOR complex 1; mTORC2, mTOR complex 2; p53, protein 53; PDK1, 3′ -phosphoinositide-dependent kinase 1; PI3K, phosphoinositide 3 kinase; PIP2, phosphatidylinositol (4,5) bisphosphate; PIP3, phosphatidylinositol (3,4,5) trisphosphate; PTEN,
phosphatase and tensin homolog; Raf, rapidly accelerated fibrosarcoma; Ras, rat sarcoma; REDD1, DNA damage response 1; Rheb, Ras homolog enriched in brain; RSK, ribosomal S6 kinase; SOS, son of sevenless homolog; TNFα, tumor necrosis factorα; TSC1/2, tuberous sclerosis complex 1/2; Wnt, wingless-type.
DEVEL
O
The activity of the Rag GTPases, like other small GTPases, is modulated by guanine nucleotide exchange factors (GEFs) and GAPs. For example, in addition to its function as a scaffold for the Rags, Ragulator functions as a GEF for RagA/B (Bar-Peled et al.,
2012). Furthermore, the GATOR1 complex functions as a GAP for RagA/B (Bar-Peled et al., 2013), while folliculin (FLCN) and its interacting proteins, folliculin interacting protein 1 and 2 (FNIP1 and FNIP2), act as a GAP for RagC/D (Petit et al., 2013; Tsun et al., 2013). Further regulation of the Rag GTPases lies upstream of GATOR1, whereby the GATOR2 complex binds to and inhibits the activity of GATOR1 through an unknown mechanism (Bar-Peled et al., 2013). Recently, the KICSTOR complex was identified as a tether for GATOR1 at the lysosome, and was shown to be required for amino acid deprivation sensing by mTORC1 (Peng et al., 2017; Wolfson et al., 2017). Together, KICSTOR and GATOR1 form a complex that negatively regulates mTORC1 activity in response to amino acid withdrawal.
Amino acids shuttle mTORC1 to the lysosome through a currently unknown mechanism (Sancak et al., 2008, 2010), although it is known that lysosomal function is crucial for mTORC1 translocation. Indeed, pharmacological inhibition of the vacuolar H+-ATPase (v-ATPase), which pumps protons into the lysosome, or disruption of the lysosomal pH gradient, blocks mTORC1 lysosomal localization and activation (Jewell et al., 2015; Zoncu et al., 2011). Moreover, the v-ATPase binds to Ragulator, and this interaction is regulated by amino acid availability (Zoncu et al., 2011). Interestingly, leucine activates mTORC1 via an ‘inside-out’ mechanism, where the accumulation of leucine within the lysosome is required for mTORC1 activation (Manifava et al., 2016; Zoncu et al., 2011).
Recently, CASTOR1 and solute carrier family 38 member 9 (SLC38A9) (Chantranupong et al., 2016; Jung et al., 2015a; Rebsamen et al., 2015; Saxton et al., 2016a; Wang et al., 2015) were identified as arginine sensors in the mTORC1 pathway, while sestrin 2 (Saxton et al., 2016b; Wolfson et al., 2016) was identified as a leucine sensor. CASTOR1 forms a homodimer or a heterodimer with the related protein, CASTOR2 (Chantranupong et al., 2016). The sestrins are a family of three related proteins (sestrin1, sestrin 2 and sestrin 3) that are negative regulators of mTORC1 (Lee et al., 2010a). Mechanistically, both the CASTOR complexes and sestrin 2 interact with GATOR2, inhibiting mTORC1 activity (Fig. 3A) (Chantranupong et al., 2014, 2016; Wolfson et al., 2016). Arginine binds to CASTOR1 at the interface of two aspartate kinase, chorismate mutase, TyrA (ACT) domains, disrupting the CASTOR1-GATOR2 interaction, thus increasing mTORC1 activity (Chantranupong et al., 2016; Saxton et al., 2016a). Similarly, leucine binds to sestrin 2 through a pocket at the C-terminal domain of sestrin 2, and this binding may cause conformational changes that disrupt the sestrin 2 and GATOR2 association (Saxton et al., 2016b). However, leucine-sensing by sestrin 2 is controversial, as recent studies have demonstrated that sestrin 2 still interacts with GATOR2 when cells are grown in leucine-containing media (Lee et al., 2016c). SLC38A9 is a lysosomal amino acid transporter that interacts with the Rag GTPases and Ragulator; its loss represses mTORC1 activation by amino acids, notably arginine (Jung et al., 2015a,b; Rebsamen et al., 2015; Wang et al., 2015). However, the direction of arginine transport across the lysosomal membrane is unclear, and more data are needed to support the role of SLC38A9 as a direct arginine sensor.
Rag GTPase-independent activation of mTORC1
Recently, glutamine was discovered to activate mTORC1 in a Rag GTPase-independent manner (Jewell et al., 2015; Fig. 3B). Consistent with this, it was shown that the conditional knockout of RagA/B in mouse cardiomyocytes does not drastically reduce mTORC1 activity, indicating the existence of a Rag GTPase-independent amino acid pathway (Kim et al., 2014). In RagA/B-deficient mammalian cells, glutamine stimulation induces the
RagA/B RagC/D
Ragulat or
Lysosome
mTORC1
Rheb
Activate
Growth factors
GATOR1
GATOR2 Sestrin2 CASTOR1
Leucine Arginine
SLC38A9
A Rag GTPase dependent
GTP
GDP TSC
v-ATPase
KICST
O R
Arginine
FLCN-FNIP2
Lysosome
mTORC1
Rheb
Activate
Growth factors B Rag GTPase independent
TSC
v-ATPase
Arf1
Glutamine
Arf1 GEF
GTP GDP
[image:4.612.62.288.64.367.2]GAP
Fig. 3. Amino acid signaling pathways upstream of mTORC1.(A) Model of how leucine and arginine activate mTORC1 through the Rag GTPases. Under amino acid-sufficient conditions, a heterodimer of GTP-bound RagA or RagB and GDP-bound RagC or RagD interacts with mTORC1 at the lysosome, where Rheb resides. Ragulator is a scaffold that anchors the Rag proteins to the lysosome and serves as a GEF for RagA/B. It consists of p18, p14, MP1, C7orf59 and HBXIP. A FLCN-FNIP complex functions as a GAP for RagC/D. The v-ATPase binds to the Ragulator and is required for amino acid signaling to mTORC1. The KICSTOR complex, which contains KPTN, ITFG2, C12orf66 and SZT2, anchors GATOR1 (which consists of DEPDC5, NPRL2 and NPRL3), a GAP for RagA/B, to the lysosome. GATOR2 (which consists of SEC13, SEH1L, WDR24, WDR59 and MIOS) inhibits GATOR1 through an unclear mechanism. Sestrin 2 and CASTOR1 bind to GATOR2 and prevent the inhibitory action of GATOR2 on GATOR1. Leucine and arginine bind to their sensors sestrin 2 and CASTOR1, respectively, blocking sestrin 2-GATOR2 and CASTOR1-GATOR2 interactions. (B) Model of how glutamine activates mTORC1 independently of the Rag GTPases. In this model, the v-ATPase is required, and the cycling of Arf1, between a GTP- and GDP-bound state, promotes glutamine-induced mTORC1 activation and its lysosomal
localization. Positive regulators of mTORC1 are indicated in green and negative regulators are indicated in red. Arf1, adenosine diphosphate ribosylation factor 1; CASTOR1, cytosolic arginine sensor for mTORC1 subunit 1; DEPDC5, DEP domain containing 5; FLCN, folliculin; FNIP, folliculin interacting protein; GATOR1, GTPase-activating protein activity toward Rags; GEF, guanine nucleotide exchange factor; GAP, GTPase activating protein; HBXIP, hepatitis B virus X-interacting protein; ITFG2, integrinαFG-GAP repeat containing 2; KPTN, kaptin (actin binding protein); MIOS, meiosis regulator for oocyte development; MP1, MEK partner 1; mTORC1, mTOR complex 1; NPRL2, NPR2 like, GATOR1 complex subunit; NPRL3, NPR3 like, GATOR1 complex subunit; v-ATPase, vacuolar H+-ATPase; Rheb, Ras homolog enriched in brain;
SEH1L, SEH1-like nucleoporin; SLC38A9, solute carrier family 38 member 9; SZT2, seizure threshold 2; TSC, tuberous sclerosis complex; WDR24, WD repeat-containing protein 24; WDR59, WD repeat-containing protein 59.
DEVEL
O
translocation of mTORC1 to the lysosome and activates mTORC1 through a mechanism that requires the v-ATPase and a small GTPase, adenosine diphosphate ribosylation factor 1 (Arf1) (Jewell et al., 2015). How glutamine is sensed and integrated into the Arf1-dependent pathway remains unknown. Studies in yeast have also demonstrated that glutamine, the preferred nitrogen source for yeast, can sustain TORC1 activity independent of Gtr1, the yeast homolog of mammalian RagA/B (Stracka et al., 2014). Moreover, yeast genetic studies and in vitro TORC1 kinase assays suggest the involvement of the phosphatidylinositol 3-phosphate-binding FYVE domain-containing vacuolar protein Pib2 and the phosphatidylinositol 3-kinase complex Vps34-Vps15 in mediating the Gtr1- and Ego3- (components of a yeast complex with similar function to mammalian Ragulator) independent activation of TORC1 (Kim and Cunningham, 2015; Tanigawa and Maeda, 2017). However, the involvement of Pib2 and Vps34-Vps15 in glutamine signaling to mTORC1 in mammals has not been confirmed. Future studies identifying new components involved in glutamine signaling to mTORC1 will be important for understanding how mTORC1 is differentially regulated by specific amino acids.
mTOR signaling in stem and progenitor cells
Stem cells maintain tissue homeostasis through their ability to self-renew and produce differentiated progenitor cells (Morrison and Spradling, 2008; Wagers, 2004), which can then give rise to distinct cell types with specified functions. The molecular mechanisms that govern stem cell self-renewal and differentiation are thus under intensive investigation, and recent work has sought to understand how cues upstream of mTOR signaling play a role in these processes. Early studies identified a role for mTORC1 in differentiation, revealing that rapamycin treatment inhibits the formation of adipocytes (Yeh et al., 1995). Subsequent work demonstrated that mTOR activity is necessary for embryonic stem cell (ESC) function in mammalian development (Gangloff et al., 2004; Murakami et al., 2004), and that precise regulation of mTOR activity is important for stem cell self-renewal and differentiation (Yilmaz et al., 2006). Although understanding the physiological roles of mTORC1 and mTORC2 in stem cells is important,in vivo studies of mTOR present a challenge due to the requirement of mTOR signaling for growth and development. Despite these challenges, recent biochemical and genetic work has sought to assign functions for mTORC1 and mTORC2 in the development and maintenance of various stem and progenitor cell populations (summarized in Table 1).
Neural stem cells and neural development
mTOR signaling is crucial for the maintenance and differentiation of neural stem cells (NSCs) and for brain development (Lee, 2015). Early studies of Tsc2-mutant mice demonstrated that TSC2 is required for proper neural development, indicating that tight regulation of mTORC1 activity is essential during this process (Rennebeck et al., 1998). More recently, mTORC1 activity has been shown to regulate the function of NSCs, neural progenitor cells (NPCs), neural precursor cells and differentiated cells, such as neurons. For example, mTORC1 activity has been implicated in NSC differentiation, stimulating the generation of dopaminergic neurons (Chinta and Andersen, 2005; Lee et al., 2016a,b). Chemical inhibition of mTORC1 and S6K1 significantly reduces dopaminergic differentiation of human NSCs (hNSCs). However, conflicting results suggest that phosphatase and tensin homolog (PTEN), a negative regulator of PI3K-AKT-mTOR signaling,
promotes dopaminergic neuron differentiation in hNSCs (Lee et al., 2016a). Despite these inconsistent results, mTORC1 activity appears to be important for the development of dopaminergic neurons, although further investigation is clearly required to provide a mechanistic understanding of this process.
In addition to regulating NSC differentiation, mTOR activity is required for dendrite formation – a process that is essential for proper neuronal signaling (Skalecka et al., 2016). Treating rat embryonic neurons with mTOR inhibitors blocks the outgrowth of dendrites in vitro. In addition, short hairpin RNA (shRNA)-mediated knockdown of Raptor (an mTORC1 component) or Rictor (an mTORC2 component) significantly inhibits dendrite formation in cultured rat embryonic neurons. Combined knockdown of Raptor and Rictor results in fewer dendrites than does Raptor or Rictor knockdown alone. This indicates that mTORC1 and mTORC2 have distinct functions during dendrite formation, and these results have been recapitulatedin vivousing NSC-specificMtorknockout mice (Skalecka et al., 2016).
During brain development, the functions of NSCs and NPCs are dynamically regulated. Early murine embryonic NPCs replicate rapidly, whereas NPC proliferation rates decline later in development (He et al., 2009; Salomoni and Calegari, 2010). Previous work has also demonstrated that expression levels of the RNA-binding proteins LIN28A and LIN28B are elevated in mouse embryonic NPCs (Balzer et al., 2010; Cimadamore et al., 2013), while LIN28A/LIN28B expression in the brain decreases significantly by embryonic day (E) 15.5 in mice (Yang et al., 2015b). In line with this, in vivo work in mice has shown that LIN28A/LIN28B regulate mTOR activity via regulation of insulin-like growth factor 2 (IGF2) signaling (Yang et al., 2015b) (Fig. 4A). IGF2 activates PI3K-AKT-mTOR signaling by binding to the IGF1 receptor (IGF1R) (Lehtinen et al., 2011). NPC-specific knockout of
Lin28a/Lin28bin mice decreases mTORC1 and mTORC2 activity, and these mice develop smaller, yet anatomically normal, brains than do wild-type mice (Yang et al., 2015b). Mechanistically, these results might be due to LIN28A/LIN28B proteins binding directly toIgf1randIgf2mRNAs to increase translation ofIgf1randIgf2 (Yang et al., 2015b). Thus, the elevated expression of LIN28A/ LIN28B proteins during early NPC development appears to promote mTOR signaling, which drives NPC proliferation.
A number of other factors also appear to regulate mTOR activity in NSCs and during neural development and ageing. The NSC-specific deletion of F box and leucine-rich repeat protein 5 (Fbxl5), for example, increases mTORC1 activation and impairs NSC differentiation and brain development (Yamauchi et al., 2017) (Fig. 4A). It is known that FBXL5 regulates iron homeostasis by promoting iron uptake in low iron conditions and the degradation of iron response proteins, and that excess cellular iron produces reactive oxygen species (ROS) that inhibit PTEN (Leslie et al., 2003). The oxidation of PTEN and activation of PI3K-AKT signaling inFbxl5-KO mice indicates that ROS-mediated inhibition of PTEN causes mTORC1 activation (Yamauchi et al., 2017). Moreover, this study also reported that the chemical inhibition of AKT and mTORC1 is sufficient to promote NSC differentiationin
vitroandin vivo(Yamauchi et al., 2017). The functions of mTORC1 activity in aging NSC populations have also been investigated. For example, recent work demonstrates that hippocampal NSCs become quiescent during ageing and have lower mTORC1 activity (Romine et al., 2015). In line with this, ketamine, a glutamate N-methyl-D-aspartic acid (NMDA) receptor antagonist that activates mTORC1 via MAPK-AKT signaling (Li et al., 2010), improves hippocampal neuron formation in aged mice (Romine et al., 2015) (Fig. 4A).
DEVEL
O
Additional work is required to understand the differential regulation of mTORC1 activity in NSCs during different stages of life and how these differences support NSC function.
The above studies indicate that mTORC1 activity is associated with NSC differentiation, suggesting that mTORC1 activity could
[image:6.612.46.564.69.665.2]also contribute to a stem cell-like state under pathological conditions. Glioblastoma is the most aggressive of brain cancers, with tumors characterized by undifferentiated morphology and mTORC1 activation (Ferrucci et al., 2017). Increased mTORC1 activity might support the stem-like properties of glioblastoma, as Table 1. Summary of mTOR signaling in stem and progenitor cells
Stem cell type Cellular function
mTOR
complex Role of mTOR signaling References
Neural stem and progenitor cell (NSC and NPC)
Maintenance, differentiation, dendritogenesis and ageing
mTORC1, mTORC2
mTORC1 promotes dopaminergic-neuron differentiation and is required for dendritogenesis in human, mouse and rat models; hyperactivity of mTORC1 leads to increased NSC proliferation and abnormal differentiation in patient-derived cells; reduced mTORC1 and mTORC2 activity is involved in reduced NPC proliferation inLin28knockout mice; mTORC1 activity in NSCs is decreased in the aged mouse brain; activating mTORC1 can restore NSC functions
Lee et al., 2016b; Skalecka et al., 2016; Yang et al., 2015b; Yamauchi et al., 2017; Li et al., 2017; Romine et al., 2015
Germline stem cell (GSC)
Self-renewal and differentiation
mTORC1 mTORC1 hyperactivity promotes differentiation of mouse spermatogonial stem cells at the expense of self-renewal
Hobbs et al., 2010; Hobbs et al., 2015
Mesenchymal stem cell (MSC)
Cell fate decision and proliferation
mTORC1, mTORC2
mTORC1 is required for adipocyte differentiation and inhibits osteoblast differentiation in mouse; mTORC2 promotes osteoblast differentiation and inhibits adipocyte differentiation in mouse
Martin et al., 2015; Lee et al., 2010c
Hair follicle stem cell (HFSC)
Regeneration mTORC1 mTORC1 promotes mouse HFSC activation by suppressing BMP signaling
Deng et al., 2015
Intestinal stem cell (ISC)
Self-renewal and proliferation
mTORC1 Calorie restriction reduces mTORC1 activity in niche cells and promotes ISC proliferation through a paracrine factor, cyclic ADP ribose, in mouse
Yilmaz et al., 2012; Igarashi and Guarente, 2016
Embryonic stem cell (ESC)
Pluripotency and differentiation
mTORC1, mTORC2
mTOR inhibition causes mouse blastocyst diapause and retains pluripotency; LIF withdrawal increases mTORC1 activity and induces differentiation in mouse ESC; decreased mTORC2 activity might contribute to blocked mouse
mesodermal differentiation upon calcineurin Aβ1 knockdown
Bulut-Karslioglu et al., 2016; Cherepkova et al., 2016; Gomez-Salinero et al., 2016
Pluripotent stem cell (PSC)
Differentiation mTORC1 mTORC1 inhibition causes mesendodermal differentiation in human PSCs; decreased mTOR expression and activity might mediate mesendodermal differentiation caused by CXCR2 knockdown in human PSCs
Nazareth et al., 2016; Jung et al., 2016
Mammary stem cell (MaSC)
Stem cell maintenance mTORC1 mTORC1 activation might mediate the stem cell depletion phenotype ofCbl
andCblbdouble-knockout mice
Mohapatra et al., 2017
Hematopoietic stem and progenitor cell (HSC and HPC)
Self-renewal, phenotypic HSC expansion, proliferation,
differentiation and ageing
mTORC1, mTORC2
mTORC1 activity corresponds to mouse HSC senescence, and prevents self-renewal and differentiation;
hyperactivated mTORC1 might mediate phenotypic HSC expansion inWip1or
Itpkbknockout mice; TAL1 knockdown inhibits mTORC1 and proliferation in mouse derived HSCs; mTOR inhibition blocks HPC differentiation, but promotes HSC differentiation in mouse; miRNA-mediated mTORC1
suppression prevents mouse HSC ageing; mTORC2 is required for mouse HSC formation from endothelial cells
Luo et al., 2014; Chen et al., 2015; Siegemund et al., 2015a,b; Benyoucef et al., 2015; Yang et al., 2015a; Qian et al., 2016; Guezguez et al., 2016; Lechman et al., 2016; Ghosh et al., 2016; Selman et al., 2016
DEVEL
O
administration of rapamycin to glioblastoma cell lines induces differentiation (Ferrucci et al., 2017). This effect is likely disease-specific as recent work demonstrates that inhibiting mTORC1 activity does not confer stem-like characteristics to stem cells in individuals with TSC (Li et al., 2017). In particular, it was shown that induced pluripotent stem cell (iPSC)-derived NSCs established from an individual with TSC display multiple abnormalities, including increased proliferation, increased
expression of differentiation markers, and impaired axon and dendrite growth, but that rapamycin treatment only slows the growth of these NSCsin vitro.However, it should be noted that the authors of this study did not investigate whether or not mTORC1 inhibition prevents NSC differentiation and neuronal growth defects, and additional studies are therefore required to determine whether these abnormalities can be attributed solely to mTORC1 hyperactivation.
E Intestinal stem cells
BST1 cADPR
cADPR
SIRT1
S6K1 Calorie
restriction
Ac P
Self-renewal
Niche cell
Stem cell mTORC1
mTORC1 A Neural stem cells
mTORC1
LIN28
IGF2 IGF1R
FBXL5
Iron accumulation
ROS production
AMPAR
Ketamine
BDNF
TrKBR
ERK PTEN
NSC proliferation
NPC proliferation
Dendrite formation
AKT AKT
C Hair follicle stem cells
G Germline stem cells
Catagen
Telogen Anagen
Quiescent HFSCs
Active HFSCs
BMP mTORC1
Plzf
REDD1
mTORC1 AKT
PI3K ATRA
Self-renewal D Mesenchymal stem cells
MSCs
Osteoblasts Adipocytes
R UNX2 PPAR γ
Glutamine anaplerosis
mTORC2 mTORC1
SIRT4 GDH ERRα
GLS
H Pluripotent stem cells
PSCs
Endoderm
Ectoderm Mesoderm Mesendoderm
? mTORC1
CXCR2 LIF
F Mammary stem cells B Hematopoietic stem cells
mTORC1
AKT EGFR Cbl/
Cblb
Self-renewal WIP1
Dlk1-Gtl2
miRNAs
(Raptor) PI3K
AKT TAL1
REDD1
HSC differentiation
HPC proliferation
Phenotypic HSC proliferation
Long-lived HSC maintenance mTORC1
ITPKB
IP4
AKT
NSC differentiation
[image:7.612.56.554.49.625.2]Differentiation
Fig. 4.See next page for legend.
DEVEL
O
Finally, it should be noted that while some of these studies provide conflicting results (e.g. Lee et al., 2016a,b; Yamauchi et al., 2017), the differences between them could be explained by significant differences in methodology, i.e. genetically engineered mouse models compared withex vivoNSC derivation and transplantation. Nonetheless, a unifying model suggests that mTOR activity is suppressed in NSCs to maintain an undifferentiated stem cell pool, and that it is elevated in NPCs to support the expansion of differentiated cells and the formation of neural structures. However, significant work is required to fully understand the regulation of mTOR activity and its effects in different NSC/NPC populations.
Hematopoietic stem cells
Hematopoietic stem cells (HSCs) support organismal survival by generating the different cells of the blood system (Orkin and Zon, 2008). Regulated PI3K-AKT-mTOR signaling is essential for maintaining functional HSCs (Fig. 4B), with elevated mTORC1 activity linked to HSC depletion. For example, mTORC1 hyperactivation in HSCs causes the induction of multiple tumor suppressors, including cyclin-dependent kinase inhibitor 2A (CDKN2A/p16Ink4A) and TP53 (Lee et al., 2010b; Signer and Morrison, 2013; Yilmaz et al., 2006), as well as ROS production and HSC hyperproliferation (Chen et al., 2008), all of which
contribute to HSC depletion. mTOR activity is also necessary for the expansion of hematopoietic progenitor cells (HPCs) (Geest et al., 2009).
Recent studies have also demonstrated that HSC mTORC1 activity increases over time, leading to senescence, again highlighting that mTORC1 activity must be regulated for proper HSC function (Luo et al., 2014). Wild-type p53-induced phosphatase 1 (WIP1) mediates the degradation of the tumor suppressor p53 (Lu et al., 2007) and is highly expressed in HSCs. However, WIP1 expression decreases with age (Chen et al., 2015), and it has been shown that HSCs fromWip1 -KO mice display increased mTORC1 activity, which corresponds with the expansion of differentiated HSCs (a response known as phenotypic HSC expansion) (Fig. 4B). Phenotypic HSC expansion in
Wip1-KO mice is blocked by rapamycin, indicating that HSC proliferation is driven by mTORC1 (Chen et al., 2015). In addition, inositol-trisphosphate 3-kinase B (ITPKB), a lipid kinase that produces inositol (1,3,4,5)-tetrakisphosphate [IP4; Ins(1,3,4,5)P4], is essential for HSC maintenance and acts by limiting AKT-mTORC1 activation (Siegemund et al., 2015); IP4 produced by ITPKB limits the recruitment of AKT to the cell membrane by serving as a PIP3 decoy (Siegemund et al., 2015), resulting in decreased AKT and mTORC1 activation. Itpkb deletion in mice thus causes increased mTORC1 activity and phenotypic HSC expansion, similar toWip1deletion (Chen et al., 2015; Siegemund et al., 2015). Similar to other HSC studies (Chen et al., 2015), rapamycin blocks phenotypic HSC expansion in Itpkb-knockout mice, reinforcing the notion that mTORC1 drives HSC proliferation (Siegemund et al., 2015).
Inhibiting PI3K-AKT-mTOR signaling can also contribute to stem cell maintenance under physiological conditions. Endogenous suppression of mTORC1 and mitochondrial activity by miRNAs from theDlk1-Gtl2locus is necessary for the maintenance of long-lived murine HSCs (Qian et al., 2016) (Fig. 4B). Recent work, however, demonstrates that elevated mTORC1 and mitochondrial activity is necessary for hematopoietic development. Indeed, proteomic and transcriptomic analyses of human HSCs during differentiation show that mTORC1 supports mitochondrial biogenesis during erythropoiesis and is necessary for red blood cell (RBC) development (Liu et al., 2017). These results are consistent with those obtained in mice, where inhibition of mTOR significantly decreases mitochondrial biogenesis and RBC counts (Liu et al., 2017). Coupled with additional work demonstrating that mTOR inhibition has different effects in HSCs and HPCs (Yang et al., 2015a), these contradictory results could be explained by distinct roles for mTOR that vary between the differentiation states of HSCs. Suppression of mTOR signaling is also important in stem cell maintenance during disease. Overexpression of the microRNA miR-126 is common in acute myeloid leukemia (AML) and is associated with poor clinical outcomes (Lechman et al., 2016). miR-126 maintains HSC self-renewal and differentiation by suppressing HSC responses to PI3K-AKT-mTOR signaling (Lechman et al., 2012), and it has been reported that suppressing miR-126 expression slows AML progression (de Leeuw et al., 2014; Dorrance et al., 2015). By contrast, miR-126 overexpression in AML stem cells decreases the abundance of several PI3K-AKT-mTOR pathway components, including mSin1, an important mTORC2 subunit (Lechman et al., 2016). Although this study presents interesting results about how mTOR activity contributes to AML, further studies are required to elucidate how miR-126 regulates mTORC2 complex assembly and how mTORC2 activity affects HSC maintenance.
Although mTORC1 hyperactivity contributes to HSC exhaustion, mTORC1 activity is still required for HSC function.
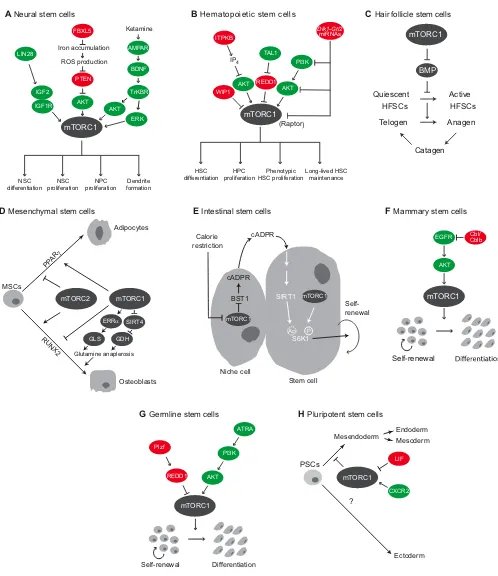
Fig. 4. Regulation of mTOR signaling in stem and progenitor cells.(A) In neural stem cells (NSCs), mTORC1 activity is regulated by upstream regulators, such as LIN28, FBXL5 and ketamine. mTORC1 regulates NSC and neural progenitor cell (NPC) proliferation, differentiation and dendrite formation. (B) In hematopoietic stem cells (HSCs), mTORC1 activity is regulated by WIP1, ITPKB, TAL1 andDlk1-Gtl2microRNAs. mTORC1 activity promotes HSC and hematopoietic progenitor cell (HPC) proliferation, differentiation and long-lived HSC maintenance. (C) mTORC1 signaling is required to suppress BMP signaling and to promote the activation of hair follicle stem cells (HFSCs) during the transition from telogen to anagen during hair growth. (D) In mesenchymal stem cells (MSCs), mTORC1 and mTORC2 have distinct roles in cell fate decisions. mTORC1 facilitates adipocyte
differentiation, while having conflicting roles in osteoblast differentiation. In contrast, mTORC2 inhibits PPARγ-dependent adipocyte differentiation and promotes RUNX2-dependent osteoblast differentiation. (E) Calorie restriction inhibits mTORC1 activity in intestinal niche cells, which stimulates cADPR production. cADPR promotes S6K1 phosphorylation, essentially enhancing mTORC1 activity in intestinal stem cells, which promotes self-renewal. (F) EGFR signaling activates mTORC1 in mammary stem cells (MaSCs), and is inhibited by Cbl ubiquitin ligases. mTORC1 activity promotes MaSC differentiation. (G) mTORC1 promotes germline stem cell (GSC) differentiation at the expense of self-renewal. mTORC1 is activated by ATRA in GSCs and inhibited by Plzf through expression of REDD1. (H) mTORC1 activity is regulated by CXCR2 and LIF signaling in pluripotent stem cell (PSCs). Inhibition of mTORC1 promotes mesendodermal differentiation in PSCs. Ac, acetylation; AKT, RAC-αserine/threonine-protein kinase; AMPAR, AMPA receptor; ATRA, all-trans retinoic acid; BDNF, brain-derived neurotrophic factor; BMP, bone morphogenetic protein; BST1, bone stromal antigen 1; cADPR, cyclic ADP ribose; Cbl, casitas B-lineage lymphoma; CXCR2, chemokine receptor 2;Dlk1-Gtl2, delta homolog 1-gene trap locus 2; EGFR, epidermal growth factor receptor; ERK, extracellular signal-regulated kinase; ERRα, estrogen-related receptorα; FBXL5, F box and leucine-rich repeat protein 5; GDH, glutamate dehydrogenase; GLS, glutaminase; IGF1R, IGF1 receptor; IGF2, insulin-like growth factor 2; IP4, inositol
(1,3,4,5)-tetrakisphosphate; ITPKB, inositol-trisphosphate 3 kinase B; LIF, leukemia inhibitory factor; LIN28, protein lin-28 homolog; mTOR, mammalian target of rapamycin or mechanistic target of rapamycin; mTORC1, mTOR complex 1; mTORC2, mTOR complex 2; P, phosphorylation; PI3K, phosphoinositide 3 kinase; Plzf, promyelocytic leukemia zinc finger; PPARγ, peroxisome-proliferator activated receptor gamma; Raptor, regulatory-associated protein of mTOR; REDD1, DNA damage response 1; ROS, reactive oxygen species; RUNX2, runt-related transcription factor 2; S6K1, ribosomal S6 kinase 1; SIRT1, sirtuin 1; SIRT4, sirtuin 4; TAL1, T-cell acute leukemia 1; TrKBR, tyrosine kinase B receptor; WIP1, wild-type p53-induced phosphatase 1.
DEVEL
O
The regulation of mTORC1 activity by REDD1 in stem cells has been reported (Hobbs et al., 2010), and recent work has demonstrated that T-cell acute leukemia 1 (TAL1), a transcription factor involved in HSC development, regulates REDD1 expression in HSCs (Benyoucef et al., 2015) (Fig. 4B). There are multiple TAL1-binding sites upstream of theREDD1locus, and knockdown of TAL1 causes an increase in REDD1 levels. Increasing REDD1 protein levels decreases mTORC1 activity and inhibits HSC growth, similar to rapamycin treatment (Benyoucef et al., 2015). Downstream effectors of mTORC1, notably S6K1, are also important for HSC maintenance and function. The deletion of
S6k1 (Rps6kb1) impairs HSC self-renewal, as indicated by the reduction of HSCs and HPCs in the bone marrow ofS6K1-KO mice (Ghosh et al., 2016). In addition, the deletion ofS6K1in leukemia stem cells significantly reduces the production of leukemia stem cell-derived leukocytes (Ghosh et al., 2016). Surprisingly, S6K1 deletion reduces the phosphorylation of 4EBP1 and AKT, which is contradictory to previous reports showing that mTORC1 and S6K1 activity promote a negative-feedback loop that inhibits PI3K, mTORC1 and mTORC2 signaling (Harrington et al., 2004; Shah and Hunter, 2006; Shah et al., 2004; Tzatsos and Kandror, 2006). Furthermore, an alternative report suggests that S6K1 deletion improves HSC function, presumably by inducing a quiescent state that favors HSC maintenance (Selman et al., 2016). Given the conflicting evidence, additional research is required to understand the role and regulation of S6K1 activity in HSC maintenance.
Compared with mTORC1, the activity and regulation of mTORC2 in HSCs is under-studied. However, a recent single-cell RNA-sequencing analysis of HSCs during murine embryonic development revealed mTORC2-related signaling pathways to be significantly enriched in these cells (Zhou et al., 2016). In addition, it has been shown thatRictor-KO mice are embryonic lethal, and that the loss of Rictor blocks HSC development, but not HSC differentiation,in vitro(Zhou et al., 2016), highlighting a need to further investigate how mTORC2 regulates the embryonic development of HSCs. mTORC2 is also involved in aberrant HSC function, such as the development of leukemia. For example, GSK3 has been implicated in the development of leukemia, owing to its regulation of key developmental pathways such as the Wnt, Notch and Hedgehog pathways (Guezguez et al., 2016). It has been shown that the deletion of bothGsk3isoforms leads to overactive mTORC2 signaling in HSCs, and that animals transplanted with
Gsk3-deficient HSCs rapidly develop AML (Guezguez et al., 2016). TreatingGsk3-deficient HSCs with rapamycin has little effect on their differentiation, but inhibition of AKT and S6K1 significantly impairs the ability of HSCs to differentiate (Guezguez et al., 2016). The loss of differentiation could be due to hyperactivation of mTORC1, which was previously reported (Huang et al., 2009, 2012); however, the rapamycin-resistant phenotype could be attributed to the deletion of bothGsk3isoforms. Overall, research on mTOR signaling in HSCs points to a model where mTOR signaling is dampened in long-lived HSCs to maintain the capacity for differentiation and self-renewal. However, HPCs and differentiated cells such as erythrocyte progenitors display elevated mTOR signaling, which drives and supports their rapid expansion.
Hair follicle stem cells
The hair follicle is a dynamic organ found in mammalian skin that produces hair. Hair follicles undergo cycles of degeneration (catagen), rest (telogen) and regeneration (anagen) in order to produce new hair (Schneider et al., 2009) (Fig. 4C). Hair follicle
maintenance and hair growth are governed by a specific set of stem cells–hair follicle stem cells (HFSCs). Early work demonstrated that Wnt signaling activates mTOR signaling in HFSCs to maintain a quiescent stem cell population, whereas overactive canonical Wnt/
β-catenin and mTOR signaling causes a loss of HFSC maintenance and impaired hair growth (Castilho et al., 2009). Although overactive Wnt signaling causes HFSC degeneration, canonical Wnt signaling is necessary to initiate anagen (Andl et al., 2002) by overcoming bone morphogenetic protein (BMP) signaling, which inhibits entry into anagen (Plikus et al., 2008). Recent work demonstrates that the activation of mTOR in HFSCs at the telogen-anagen transition promotes telogen-anagen by suppressing BMP signaling (Deng et al., 2015). In particular, knockdown of Raptor (an mTORC1 component) and Rictor (an mTORC2 component) revealed that mTORC1, but not mTORC2 signaling, is necessary to suppress BMP signaling in HFSCs and initiate anagen (Deng et al., 2015). Additional research is required to understand how mTORC1 signaling mechanistically suppresses BMP signaling in HFSCs.
Mesenchymal stem cells
Mesenchymal stem cells (MSCs) are multipotent cells that, in response to environmental cues, differentiate to form various cell types, including adipocytes, chondrocytes and osteoblasts (Phinney and Prockop, 2007). Early work in mouse fibroblasts and primary human pre-adipocytes demonstrated that rapamycin inhibits adipogenic differentiation (Bell et al., 2000; Yeh et al., 1995). More recent biochemical and genetic studies have highlighted the role of mTORC1 in adipogenesis, with clear evidence that insulin-mediated activation of mTORC1 supports adipogenesis through the transcription factor peroxisome proliferator activated receptor gamma (PPARγ) (Cho et al., 2004; El-Chaâr et al., 2004; Zhang et al., 2009) (Fig. 4D). The role of mTOR signaling in osteoblast differentiation, however, has yielded conflicting results (Isomoto et al., 2007; Lee et al., 2010c; Ogawa et al., 1998; Singha et al., 2008). Previous studies relied on the pharmacological inhibition of mTOR and produced conflicting results, but recent genetic studies indicate that mTORC1 prevents osteoblast differentiation by suppressing the expression of osteoblastic transcription factors, including runt-related transcription factor 2 (RUNX2) (Fig. 4D).
Distinct roles for mTORC1 and mTORC2 in MSC lineage commitment have also been revealed using Raptor- and Rictor -knockout MSCs (Martin et al., 2015).Raptor-deficient MSCs have a reduced capacity to form adipocytes, reinforcing the role of mTORC1 in adipocyte differentiation. Raptor-knockout MSCs also display an increased capacity to form a mineralized matrix similar to bone (Martin et al., 2015). Rictor-deficient MSCs displayed a differentiation program that was the inverse ofRaptor -knockout MSCs, i.e. they show increased capacity for adipocyte formation and decreased formation of mineralized matrix. Combined, these results suggest that mTORC1 activity promotes adipocyte differentiation and inhibits osteoblast differentiation, while mTORC2 inhibits adipocyte differentiation and promotes osteoblast differentiation (Fig. 4D). A separate study, however, proposed that mTORC1 is required for osteoblast differentiation (Huang et al., 2017). It is known that mTORC1 regulates glutamine anaplerosis, the breakdown of glutamine to provide intermediates for the tricarboxylic acid (TCA) cycle, by blocking transcription of sirtuin 4 (Sirt4) (Csibi et al., 2013). SIRT4 is a mitochondria-localized ADP-ribosyl transferase that mediates the breakdown of glutamate dehydrogenase, a key enzyme in glutamine anaplerosis. The expression of glutaminase, which is also involved in glutamine
DEVEL
O
anaplerosis, declines with age and correlates with decreased osteogenesis (Huang et al., 2017) (Fig. 4D). Restoring glutamine anaplerosis promotes osteoblast differentiation in MSCs in long-term culture and in MSCs treated with rapamycin. Thus, although it is clear that mTORC1 promotes adipogenic differentiation, recent conflicting studies (Huang et al., 2017; Martin et al., 2015) indicate that more work is required to understand the role of mTORC1 and mTORC2 in osteogenic differentiation.
Intestinal stem cells
Intestinal homeostasis is maintained by a population of intestinal stem cells (ISCs) that are found within intestinal crypts (Clevers, 2013). Intestinal crypts also contain Paneth cells, which produce bactericidal proteins and direct ISC maintenance (Clevers, 2013; Sato et al., 2011). Recent work on calorie restriction and ISC function provides a link between mTOR signaling and ISC maintenance.
During caloric restriction, mTORC1 activity in Paneth cells is reduced, causing the production and activation of bone stromal antigen 1 (Bst1) – a lipid-anchored ectoenzyme that converts nicotinamide adenine dinucleotide (NAD+) to cyclic ADP ribose (cADPR) (Yilmaz et al., 2012). cADPR activates calcium signaling in ISCs adjacent to Paneth cells in the intestinal crypt, which promotes ISC proliferation (Yilmaz et al., 2012) (Fig. 4E). Additional work provides evidence for how the production of cADPR by intestinal niche cells enhances ISC mTORC1 activity during calorie restriction (Igarashi and Guarente, 2016); cADPR produced by intestinal niche cells activates sirtuin 1 (SIRT1), a NAD-dependent protein deacetelyase, in neighboring ISCs (Fig. 4E). Activation of SIRT1 enhances mTORC1-mediated phosphorylation of its substrate S6K1. Previous studies have demonstrated that S6K1 acetylation blocks its phosphorylation on residues that are crucial for its activation, and that this acetylation is regulated by sirtuins (Hong et al., 2014). Consistent with these results, intestinal deletion of SIRT1 reduces the phosphorylation of S6K1 in ISCs, and decreases the formation of intestinal organoidsin vitro, indicating impaired ISC function (Igarashi and Guarente, 2016). In contrast to previous reports (Yilmaz et al., 2012), treatment with rapamycin blocks ISC expansion during calorie restriction, likely because mTORC1 activity is necessary for ISC proliferation (Igarashi and Guarente, 2016). This mechanism of calorie restriction-induced ISC expansion could serve as a protective mechanism for the gut, and might be essential for maintaining intestinal homeostasis (Igarashi and Guarente, 2016; Simons and Clevers, 2011).
Additional work has shown that mTOR signaling has an important role in gut homeostasis following acute stress. Fasting, an acute gut stress, induces the inactivation of PTEN in dormant ISCs (d-ISCs) (Richmond et al., 2015). Activation of PI3K-AKT-mTOR signaling downstream of PTEN inactivation in d-ISCs allows for their rapid expansion and repopulation of the gut following acute stresses (Richmond et al., 2015). Together, these studies support a model where the inactivation of mTORC1 in Paneth cells supports long-term adaptation to calorie restriction, while mTORC1 activation in d-ISCs is important for maintaining gut homeostasis following acute insults. Future work in the intestine, and in other tissues, should focus on understanding the role of mTORC1 in the interplay between niche cells and tissue stem cells, and how mTORC1 activity in these cells is regulated in response to environmental changes.
Mammary stem cells
The mammary gland is a dynamic tissue that undergoes multiple changes in response to physiological events such as puberty and
pregnancy (Visvader and Stingl, 2014). Epithelial cells within the mammary gland form ductal structures composed of luminal cells and myoepithelial cells. Recent research has demonstrated the existence of mammary stem cells (MaSCs)–defined by their ability to generate a functional mammary gland duct–and has identified important signaling and transcriptional networks, such as Wnt, Notch and Slug/Sox9, that are involved in MaSC maintenance and function (Bouras et al., 2008; Chakrabarti et al., 2014; Guo et al., 2012; Joshi et al., 2010; Sotgia et al., 2005; Visvader and Stingl, 2014). However, despite our growing understanding of MaSCs, relatively little is known about mTOR in these cells. Recent work has demonstrated that deletion of the E3 ubiquitin ligasesCbland
Cblb impairs mouse mammary gland development in vivo, and abrogates MaSC function in vitro (Mohapatra et al., 2017). Cbl ubiquitin ligases limit receptor tyrosine kinase (RTK) signaling by mediating the proteosomal degradation of RTKs (Petrelli et al., 2002; Soubeyran et al., 2002). Notably, the deletion ofCblandCblb increases EGFR activation and mTOR activity in MaSC organoids, and impairs organoid formation (Mohapatra et al., 2017) (Fig. 4F). Organoid formation could be rescued by administration of an AKT inhibitor or rapamycin, indicating restoration of MaSC function (Mohapatra et al., 2017). More work is required to fully understand the role of mTOR signaling in MaSCs, but this initial report indicates that mTOR regulates a switch between MaSC self-renewal and differentiation, and that mTORC1 activity must be tightly regulated to prevent MaSC exhaustion.
Germline stem cells
Germline stem cells (GSCs) maintain the germline by coordinating self-renewal and the production of differentiated progenitors (Spradling et al., 2011). The role of mTOR signaling in murine male GSCs was recently reported, demonstrating that hyperactivated mTORC1 leads to male GSC differentiation and loss of self-renewal (Hobbs et al., 2010) (Fig. 4G). mTORC1 activity is limited in male GSCs and in spermatogonial stem/progenitor cells (SPCs), through the transcription factor promyelocytic leukemia zinc finger (Plzf). Plzf induces expression of the endogenous mTORC1 inhibitor REDD1 (Hobbs et al., 2010). Consistent with the idea that tissue stem cell populations consist of distinct cell types (Barker et al., 2007; Mascre et al., 2012; Sangiorgi and Capecchi, 2008), recent evidence suggests that there are different SPC populations within the testis (Hobbs et al., 2015). In particular, the germline-specific deletion of
Tsc2in mice identified two subsets of SPCs with different responses to elevated mTORC1 activity. In one subset, elevated mTORC1 activity causes SPC differentiation and depletion, whereas these processes remain unaffected in the other subset. The SPC population affected by mTORC1 hyperactivation consists of early SPCs, which have low mTORC1 activity, whereas the unaffected population constitutes committed progenitor cells with intrinsically higher mTORC1 activity (Hobbs et al., 2015).
Additional work has focused on exogenous factors that direct SPC differentiation and self-renewal, such as the morphogen all-trans retinoic acid (ATRA), which drives SPC differentiation (Bowles and Koopman, 2007). The effects of ATRA on murine SPC differentiation can be attributed to improved translation of the RTK Kit (Busada et al., 2015a), which supports cell survival and proliferation during SPC development (Kissel et al., 2000). Subsequent studies have demonstrated that mTORC1 activity is required for murine SPC differentiation in vivoby mediating the effects of ATRA signaling (Busada et al., 2015b). mTORC1 is activated downstream of ATRA via PI3K-AKT signaling, and mTORC1-dependent translation ofKitmRNA increases Kit protein
DEVEL
O
expression (Busada et al., 2015b) (Fig. 4G). In summary, and consistent with studies of progenitor cells from other tissues, mTORC1 activity supports the expansion of differentiated germline progenitors. Regulated mTORC1 activity is thus necessary for GSC maintenance, and unregulated mTORC1 activity can cause germline degeneration.
Pluripotent stem cells
Embryonic stem cells (ESCs) and pluripotent stem cells (PSCs) are able to differentiate into the three embryonic germ layers (endoderm, ectoderm and mesoderm) and to divide indefinitely (Takahashi and Yamanaka, 2006). A number of studies have revealed that mTOR signaling is essential for embryonic development and ESC survival; mTOR deletion or the disruption of mTOR kinase activity in mice, for example, prevents trophoblast and inner cell mass growth (Gangloff et al., 2004; Murakami et al., 2004). Recent work has also highlighted the importance of mTOR activity in the maintenance of pluripotency and cell fate. For example, mTOR inhibition contributes to diapause, the pausing of embryonic development in unfavorable conditions (Bulut-Karslioglu et al., 2016; Fenelon et al., 2014). Treatment with the mTOR inhibitors INK128 and RapaLink-1 induces a paused pluripotent state in mouse ESCs (mESCs) that mimics hormonally induced diapause (Bulut-Karslioglu et al., 2016). This pausing relies on inhibition of both mTOR complexes, as treatment with rapamycin does not induce pausing. In addition, inhibiting protein translation, a major mTORC1 output, does not induce diapause (Bulut-Karslioglu et al., 2016). mTOR-inhibited and naturally diapaused mESCs exhibit major downregulations in transcription and translation, indicating that the inhibition of multiple mTOR-mediated pathways is necessary for diapause (Bulut-Karslioglu et al., 2016). Previous reports have also demonstrated that DEPTOR is required for pluripotency in mESCs (Agrawal et al., 2014), highlighting the importance of inhibiting mTOR activity to maintain pluripotency.
The activities of both mTORC1 and mTORC2 are involved in mESC differentiation (Cherepkova et al., 2016; Gomez-Salinero et al., 2016), although different mechanisms have been proposed. The cytokine leukemia inhibitory factor (LIF) is necessary for embryonic implantation and for mESC maintenancein vitro(Smith et al., 1988; Stewart et al., 1992; Williams et al., 1988), and its removal from mESC culture media induces mESC differentiation (Smith et al., 1988; Williams et al., 1988). Recent work has shown that LIF withdrawal from mESC culture also increases mTOR activity (Cherepkova et al., 2016) (Fig. 4H); however, more work is required to see if inhibiting mTOR blocks mESC differentiation upon LIF withdrawal. In addition, it appears that mTORC2 activity is necessary for mESC differentiation (Gomez-Salinero et al., 2016). Knockdown of the calcineurin (a calcium- and calmodulin-dependent phosphatase) isoform calcineurin Aβ1 in mESCs causes mTORC2 to translocate from membranes to the cytosol, with a corresponding decrease in mTORC2 activity. As a result, decreased AKT–GSK3β–
β-catenin signaling impairs mesoderm differentiation (Gomez-Salinero et al., 2016).
The requirements for mTOR in human PSCs (hPSCs) are different from those in mESCs, with recent research indicating that mTOR inhibition promotes hPSC differentiation. The mesendoderm is a bipotent germ layer that gives rise to the endoderm and the mesoderm (Tada et al., 2005). High-throughput chemical screens have identified several mTOR inhibitors as drivers of mesendoderm differentiation in hPSCs (Nazareth et al., 2016). The knockdown of Raptor in hPSCs, but not of Rictor, induces
mesendoderm differentiation, indicating that mTORC1, but not mTORC2 inhibition promotes mesendodermal differentiation (Fig. 4H). Endodermal and mesodermal differentiation, however, are differentially regulated by mTORC1; mTORC1 inhibition in hPSCs promotes mesodermal differentiation, but not endodermal differentiation (Nazareth et al., 2016). Chemokine signaling has also been implicated in preventing hPSC differentiation (Jung et al., 2015a,b), and subsequent studies have linked chemokine receptor 2 (CXCR2) signaling to mTOR expression in hPSCs (Jung et al., 2016). Specifically, the knockdown of CXCR2 in hPSCs decreases mTORC1 activity and promotes mesendoderm differentiation (Fig. 4H), whereas the treatment of hPSCs with rapamycin also induces mesendoderm differentiation (Jung et al., 2016). The observation that mTORC1 inhibition decreases CXCR2 expression indicates that a feedback loop exists between mTORC1 and CXCR2 in hPSCs, but more work is needed to identify the regulatory mechanisms involved. Evidence thus far suggests that mTOR inhibition is necessary for the maintenance of pluripotency in mESCs, but that mTOR activity is required to maintain pluripotency in hPSCs. Additional studies are necessary to understand why this difference exists between these otherwise similar cell populations.
Conclusions
mTOR signaling is crucial for the regulation of stem cell self-renewal, proliferation and differentiation. Although the role of mTORC1 has been a focus of stem cell-related research, a growing body of evidence suggests that mTORC2 is also important for stem cell self-renewal and differentiation. Together, these studies highlight that both complexes must be tightly regulated in stem and progenitor cells, as their aberrant activity can lead to impaired stem cell function and, in some cases, to human disease (Guezguez et al., 2016; Lechman et al., 2016; Li et al., 2017).
There is a growing appreciation that stem cells exist within complex environments composed of distinct cell populations (Scadden, 2014), and with that has come the realization that mTOR activity within these populations is different. Indeed, although stem cells require restrained mTORC1 activity to maintain the capacity for self-renewal and differentiation (Lee et al., 2010b, 2017; Hobbs et al., 2010, 2015; Mohapatra et al., 2017), many progenitor cells require elevated mTORC1 activity to support their expansion and differentiation (Hobbs et al., 2015; Liu et al., 2017; Yang et al., 2015b). Continued work on the heterogeneity of stem cell niches will likely reveal that distinct stem and progenitor cell populations have unique mTOR signaling requirements. However, it is clear that the proper tools must be used in order to analyze mTOR activity in distinct populations. For example, the use of different promoters to drive Cre recombinase expression can produce markedly different results (Hobbs et al., 2015), and the correct use of such lines is essential for accurate assessments of mTOR activity in niche and stem cells. In addition, future work needs to focus on the role of mTOR signaling in different stem and progenitor cells. Although different requirements for survival and proliferation will be reflected in relative levels of mTOR activity, evidence from embryonic and pluripotent stem cells indicates that mTORC1 and mTORC2 have distinct roles in fate specification (Gomez-Salinero et al., 2016; Nazareth et al., 2016) and stem cell development (Zhou et al., 2016), which future work should seek to understand.
The well-established role of mTOR in integrating multiple stimuli is also evident in stem cell maintenance and function. There are multiple examples of mTOR involvement in stem cell self-renewal, differentiation and progenitor cell maintenance. Despite these recent advances, further investigation is required to understand