BIROn - Birkbeck Institutional Research Online
Thomas, J.A. and Tan, M.S.Y. and Bisson, C. and Borg, A. and Umrekar,
T.R. and Hackett, F. and Hale, V.L. and Vizcay-Barrena, G. and Fleck, R.A.
and Snijders, A. and Saibil, Helen R. and Blackman, M.J. (2018) A protease
cascade regulates release of the human malaria parasite Plasmodium
falciparum from host red blood cells. Nature Microbiology 3 , pp. 447-455.
ISSN 2058-5276.
Downloaded from:
Usage Guidelines:
1 Supplementary data
A protease cascade regulates release of the human malaria parasite Plasmodium falciparum from
host red blood cells
James A Thomas1,6, Michele S Y Tan1,6, Claudine Bisson2, Aaron Borg3, Trishant R Umrekar2, Fiona
Hackett1, Victoria L Hale2§, Gema Vizcay-Barrena4, Roland A Fleck4, Ambrosius P Snijders3, Helen R
Saibil2 and Michael J Blackman1,5*
1Malaria Biochemistry Laboratory, The Francis Crick Institute, 1 Midland Rd, London NW1 1AT, UK
2Crystallography, Institute of Structural and Molecular Biology, Birkbeck College, London, WC1E 7HX,
UK
3Protein Analysis and Proteomics Platform, The Francis Crick Institute, 1 Midland Rd, London NW1
1AT, UK
4Centre for Ultrastructural Imaging, Kings College London, London, SE1 9RT, UK
5Faculty of Infectious and Tropical Diseases, London School of Hygiene & Tropical Medicine, London,
WC1E 7HT, UK
6These authors contributed equally
§Current address: MRC Laboratory of Molecular Biology, Cambridge Biomedical Campus, Francis Crick
Ave, Cambridge CB2 OQH, UK
2
Supplementary Figure 1. Conditional disruption of SUB1 expression. Western blot showing
expression of SUB1 in SUB1HA3:loxP schizonts ~44 h following treatment of synchronous ring-stage
parasites with rapamycin (RAP) to induce gene disruption (+RAP), or mock treatment (-RAP). Schizont
extracts were probed with a polyclonal antiserum specific for the catalytic domain of SUB11. The major
signal in the control -RAP lane corresponds to the accumulated mature form of SUB1 (p47) that results
from proteolytic maturation during trafficking to exonemes2. The faint signal in the +RAP lane
(arrowed) likely represents truncated full-length SUB1 that has not undergone maturation due to the
removal of key catalytic residues (see Fig. 1 of the main manuscript). Blot taken from a single
3
Supplementary Figure 2. Disruption of the SUB1 gene is lethal. Diagnostic PCR analysis of the
SUB1HA3:loxP population immediately following RAP-treatment (+RAP) or mock treatment (-RAP) and
before plaque assay (Starting bulk cultures), or of parasite clones expanded from plaques produced
by the RAP-treated sample. RAP-treatment significantly reduced the PCR signal diagnostic of the intact
(non-excised) SUB1 locus in the starting parasite population and resulted in appearance of a signal
diagnostic of the excised locus. In contrast, parasites rescued from plaques produced by the
RAP-treated parasites displayed a non-excised genomic architecture, indicating that only the minor
population of non-excised parasites were capable of growth. Primers used for PCR analysis are
indicated (see Supplementary Table 1 for primer sequences), as are expected sizes of the PCR
4
Supplementary Figure 3. Viability of SUB1 and SERA6 parasites requires genetic
complementation by the respective wild-type gene. Diagnostic PCR analysis of parasite clones
(Complemented clones) obtained by expansion of individual wells containing plaques selected
following RAP-treatment of: a, SUB1HA3:loxP parasites transfected with the WT SUB1 expression
vector (6 independent clones); or b, SERA6:loxP parasites transfected with the WT SERA6 expression
vector (5 independent clones). Identities of primer pairs used for each set of PCR reactions are
indicated (see Fig. 1 of the main manuscript for positions of hybridisation of primers, and
Supplementary Table 1 for primer sequences). All isolated parasite clones examined were found to
possess the respective complementing plasmid and displayed a genomic architecture consistent with
excision of the floxed genomic sequence. No viable excised clones were identified that did not harbour
the complementing plasmid. Control tracks (labelled ‘C’ in panel b) show the sizes of the indicated
amplicons from mock-treated SUB1HA3:loxP parasites or complementing WT SUB1 vector only (a), or
5
Supplementary Figure 4. Fluorescent labelling of the P. falciparum parasitophorous vacuole
membrane (PVM). Indirect immunofluorescence analysis of the SERA6:loxP parasite line transfected
with plasmid pDC2-EXP1-mCherry for constitutive expression of the parasitophorous vacuole
membrane (PVM) protein EXP1 fused to mCherry. Shown are a uninuclear trophozoite (top) and a
multinucleated schizont stage (bottom) parasite probed with the anti-mCherry polyclonal antibody
ab167453 (Abcam) as well as monoclonal antibody 7.7 (http://www.malariaresearch.eu/) specific for
the distinct endogenous PVM protein EXP2 (PlasmoDB ID PF3D7_1471100). The signals closely
overlap, consistent with correct trafficking of the transgenic EXP1mCherry fusion protein to the PVM.
6
Supplementary Figure 5. Electron tomography shows that the SUB1 phenotype is indistinguishable
from arrest by compound 2 (C2), whilst the SERA6 phenotype mimics inhibition of egress by the
cysteine protease inhibitor E64. Each image is an average of 20 slices from a dual-axis tomogram of
high-pressure frozen, freeze substituted segmented schizonts. In both the top panels the PVM
(highlighted in purple) is intact, surrounding the mature merozoites, whilst in both lower panels the
PVM has ruptured and the majority of the surrounding haemoglobin has leaked out, probably due to
poration of the red blood cell membrane (RBCM). Knobs identifying the bounding RBCM are indicated
(black arrow heads). The RBCM (red), merozoite plasma membrane (cyan), rhoptry organelles
(orange) and merozoite nuclear membrane (green) are also highlighted. In the C2-arrested WT
7
Supplementary Figure 6. Egress is associated with appearance of low molecular mass cleavage
product(s) derived from the N-terminal region of -spectrin. Mock- or RAP-treated SERA6:loxP
schizonts were incubated for ~4 h with C2, then the egress block released by washing and further
incubation for 20 minutes in protein-free medium lacking C2. Soluble fractions of the entire
preparations were then subjected to SDS PAGE on a 4-12% linear gradient gel, and slices processed
for tryptic digestion and LC-MS/MS. Shown are fragmentation spectra of two -spectrin-derived
semi-tryptic peptides that were enriched in the mock-treated sample in digests corresponding to the
molecular mass range ~15-20 kDa, and so likely form the C-termini of the cleavage product(s). The two
peptides overlap by 2 residues, suggesting that cleavage to produce the polypeptide(s) occurs at two
closely-spaced sites between Gln167-Glu168 and between Gln165-Thr166. Numbering is based on the
8
Supplementary Figure 7. RBCM rupture is associated with cleavage of the RBC cytoskeletal protein
-spectrin at 2 closely-spaced sites between the N-terminal CH1 and CH2 domains. Shown are
Skyline ion chromatograms of selected -spectrin peptides identified by LC-MS/MS of tryptic digests
of species present in pull-downs shown in Fig. 4d of the main manuscript (a relevant section of the gel
is shown; the Coomassie-stained profile is representative of 4 completely independent pull-down
experiments in which the results were fully reproducible). Left, Digests of full-length -spectrin were
found to contain peptides from both CH1 and CH2 domains, as expected. In contrast, digests of the
truncated high molecular mass -spectrin cleavage product contained CH2 domain peptides but not
CH1 domain peptides, indicating loss of its N-terminal segment, whilst digests of the ~17 kDa cleavage
product contained only CH1 domain peptides, showing it represents an N-terminal fragment. Right,
ion chromatograms of peptides 157FQIQDIVVQTQEGR170, 157FQIQDIVVQTQ167, and
157FQIQDIVVQ165, which lie between the CH1 and the CH2 domains (numbering based on the
complete sequence of human -spectrin; UniprotKB P11277). Tryptic peptide
157FQIQDIVVQTQEGR170 was present in digests of full length -spectrin but absent from both high
and low molecular mass cleavage products, consistent with proteolytic processing occurring within
this sequence. Semi-tryptic peptides 157FQIQDIVVQTQ167 and 157FQIQDIVVQ165 were detected
only in digests of the ~17 kDa fragment (see also Supplementary Fig. 6) indicating that they represent
10
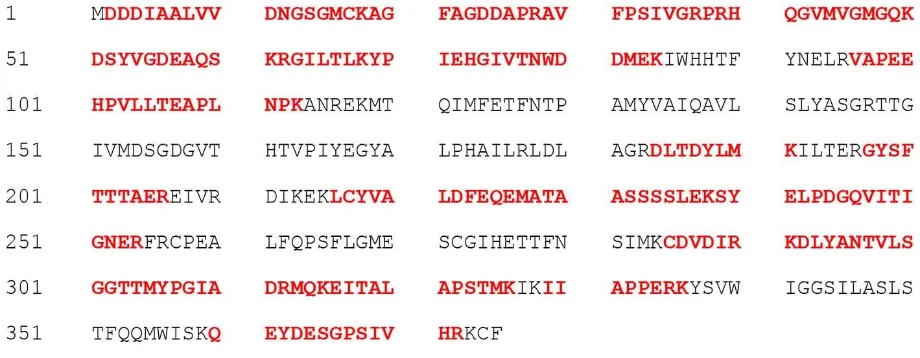
Supplementary Figure 8. Human -actin co-purifies with the cleaved ~17 kDa CH1 domain of
-spectrin. Peptide coverage obtained by LC-MS/MS analysis of tryptic digests of the ~45 kDa
co-precipitating protein present in pull-downs performed with anti--spectrin mAb B-2 from soluble
[image:11.595.71.531.262.441.2]extracts of mock-treated SERA6:loxP schizonts allowed to proceed to egress for just 20 minutes (see
Fig. 4d of the main manuscript). Identified sequences are highlighted in bold red text and comprise
11
Supplementary Figure 9. The RBC cytoskeletal protein ankyrin undergoes limited SERA6-dependent
proteolysis at egress. Western blots showing analysis of compound 2 (C2)-arrested SERA6:loxP
schizonts or parallel cultures extracted just 20 minutes following washing away the C2 in order to
allow progress to egress. The parasite extracts were probed with the indicated monoclonal antibodies
(mAbs). Egress-associated truncation of -spectrin was readily detectable in the control (-RAP)
SERA6:loxP schizonts that were allowed to proceed to egress, and limited cleavage of ankyrin was also
noted (cleavage products indicated with red arrowheads). However, no SERA6-dependent cleavage of
the other cytoskeletal components -spectrin or protein 4.1R was observed. Each Western was
performed using two different SDS PAGE gel systems in order to aid detection of both high and low
molecular mass proteins. The data shown are representative of 2 fully independent experiments with
12
Supplementary Figure 10. Gating strategy for measurement of P. falciparum parasitaemia levels by
flow cytometry (FACS). This method relies on the fact that uninfected mature erythrocytes do not
possess a nucleus and so do not label with the DNA stain Hoechst 33342. Parasitised cells, in contrast,
stain strongly. a, Cells to be counted were initially screened using forward (FSC-A) and side scatter
(SSC-A) areas to gate for all erythrocytes. b, The selected population was subsequently gated to
remove doublets (adherent cell clusters) by gating on plots of forward scatter width (FSC-W) against
forward scatter height (FSC-H). c, A second round of doublet discrimination was then performed by
gating on plots of side scatter width (SSC-W) and side scatter height (SSC-H). d, Finally,
parasite-infected erythrocytes (iRBCs) were gated as positive for the DNA stain by plotting forward scatter area
(FSC-A) against 450_50 UV-A fluorescence. Note that the iRBCs fall into populations with distinct levels
of staining intensity depending on the extent to which nuclear division has taken place. In this case
the great majority were ring-stage (mononuclear). uRBCs, uninfected erythrocytes. In each dot plot,
13
Supplementary Figure 11. Unedited full-length gels/blots used in main text figures. Shown are
unmanipulated (raw) versions of the images shown in Figure 1a, 1b, and 1e; The images have been
edited only to include boxes (red) that highlight which parts of the full gels/blots are reproduced in
the corresponding figures. Note that the pre-stained molecular weight markers (ladder) were imaged
separately from the corresponding chemiluminescent Western blot images, and so are displayed
14
Supplementary Figure 12. Unedited full-length blots used in main text figures. Shown are
unmanipulated (raw) versions of the images shown in Figure 2b and 2g; The images have been edited
only to include boxes (red) that highlight which parts of the full gels/blots are reproduced in the
corresponding figures. Note that the pre-stained molecular weight markers (ladder) were imaged
separately from the corresponding chemiluminescent Western blot images, and so are displayed
15
Supplementary Figure 13. Unedited full-length gels/blots used in main text. Shown are
unmanipulated (raw) versions of the images shown in Figure 4a-c. The images have been edited only
to include boxes (red) that highlight which parts of the full gels/blots are reproduced in the
corresponding figures. Note that the pre-stained molecular weight markers (ladder) were imaged
separately from the corresponding chemiluminescent Western blot images, and so are displayed
16
Supplementary Figure 14. Unedited full-length gels/blots used in main text and Supplementary
figures. Shown are unmanipulated (raw) versions of the images shown in Figure 4d-e and
Supplementary Figure 7 (top). The images have been edited only to include boxes (red) that highlight
which parts of the full gels/blots are reproduced in the corresponding figures. Note that the
pre-stained molecular weight markers (ladder) were imaged separately from the corresponding
17
Supplementary Figure 15. Unedited full-length gels/blots used in Supplementary figures. Shown are
unmanipulated (raw) versions of the images shown in Supplementary Figures 1, 2 and 3. The images
have been edited only to include boxes (red) that highlight which parts of the full gels/blots are
reproduced in the corresponding figures. Note that the pre-stained molecular weight markers (ladder)
were imaged separately from the corresponding chemiluminescent Western blot images, and so are
18
Supplementary Figure 16. Unedited full-length gels/blots used in Supplementary figures. Shown are
unmanipulated (raw) versions of the images shown in Supplementary Figure 9. The images have been
edited only to include boxes (red) that highlight which parts of the full gels/blots are reproduced in
the corresponding figures. Note that the pre-stained molecular weight markers (ladder) were imaged
separately from the corresponding chemiluminescent Western blot images, and so are displayed
19
Supplementary Table 1. Oligonucleotide primers used in this study.
Primer name Primer sequence (5’ – 3’)
SERA6-34 (4a) GTCCTGGAAGAAGAACGTTGCCGCCGCGAGACACAACACTGACTTCATG
S65’UTRb-2 CAGAAAAAGTAAAAGACCAAATGATA
S6EndoEx2Rev CTTCAGAACATTTATTTTGAAGTTCC
SERA6-37 AAGTAGGAGTCGGACTTAGAA
JTS5synthF (3a) GAATGCTATTTCTGCTACGTG
JTPbDT3’R (2a) TTACAGTTATAAATACAATCAATTGG
JT111-6p (1a) GAGTACCTGCAAAGAAAGGGTATCTTG
hsp863’R1 (5a) GACTTTACTGAGACATG
JTPrA1 (6a) GGTTACGGGATCATGTGGG
S6synthRev2 (7a) GTTCAAAACGTTGTGAGTGATG
JT-S1CO-F GAATATAGTGGTATTTTTAATTCTTCTGTCGAGTACCTGCAAAGAAAGGG
JT-S1syth-R AGTCTAACTAGTCTCGAGGTGCAGGTATCTGGACTTCTTCTT
JT-S1endo-F TAAGTTCCATGGGTTAACAACATAGGAGGGAATGAGGTAGATGC
JT-S1CO-R CCCTTTCTTTGCAGGTACTCGACAGAAGAATTAAAAATACCACTATATTC
S65’UTRb-2 CAGAAAAAGTAAAAGACCAAATGATA
S6EndoEx2Rev CTTCAGAACATTTATTTTGAAGTTCC
SERA6-5’UTRb AAAAGTAAAAGACCAAATGATA
SERA6-37 AAGTAGGAGTCGGACTTAGAA
JT111-1p GATTGTTAGCGAATTACGATTCCTAG
JT111-2p GAACAGTTCGACGCAGACACGAAGAAC
JT111-3p GATGACTACAATTACTTGCAGATAC
PfSUB1-synth-for-infu CGGCTAGCCGATTACTGCATGGCCATATAAATGTTACAAATTC
PfSUB1-synth-rev-infu GGCATCTACCTCATTCCCTCCTATG
PbDT3UTR-for_infu GAGGGATATGGCAGCTTAATGTTC
PbDT3UTR-rev_infu CCCCCGGGTCGATACGCCTACCCTGAAGAAGAAAAGTCC
aNumerical codes as used in Fig. 1 of the main manuscript as well as Supplementary Fig. 2 and
20 Supplementary References
1 Blackman, M. J. et al. A subtilisin-like protein in secretory organelles of Plasmodium falciparum
merozoites. J Biol Chem 273, 23398-23409 (1998).
2 Sajid, M., Withers-Martinez, C. & Blackman, M. J. Maturation and specificity of Plasmodium
falciparum subtilisin-like protease-1, a malaria merozoite subtilisin-like serine protease. J Biol Chem