Identification of an obesity quantitative trait
locus on mouse chromosome 2 and evidence of
linkage to body fat and insulin on the human
homologous region 20q.
A V Lembertas, … , A J Lusis, C Bouchard
J Clin Invest.
1997;
100(5)
:1240-1247.
https://doi.org/10.1172/JCI119637
.
Chromosomal synteny between the mouse model and humans was used to map a gene for
the complex trait of obesity. Analysis of NZB/BINJ x SM/J intercross mice located a
quantitative trait locus (QTL) for obesity on distal mouse chromosome 2, in a region syntenic
with a large region of human chromosome 20, showing linkage to percent body fat
(likelihood of the odds [LOD] score 3.6) and fat mass (LOD score 4.3). The QTL was
confirmed in a congenic mouse strain. To test whether the QTL contributes to human
obesity, we studied linkage between markers located within a 52-cM region extending from
20p12 to 20q13.3 and measures of obesity in 650 French Canadian subjects from 152
pedigrees participating in the Quebec Family Study. Sib-pair analysis based on a maximum
of 258 sib pairs revealed suggestive linkages between the percentage of body fat (P <
0.004), body mass index (P < 0.008), and fasting insulin (P < 0.0005) and a locus extending
approximately from ADA (the adenosine deaminase gene) to MC3R (the melanocortin 3
receptor gene). These data provide evidence that a locus on human chromosome 20q
contributes to body fat and insulin in a human population, and demonstrate the utility of
using interspecies syntenic relationships to find relevant disease loci in humans.
Research Article
Find the latest version:
J. Clin. Invest.
© The American Society for Clinical Investigation, Inc. 0021-9738/97/09/1240/08 $2.00
Volume 100, Number 5, September 1997, 1240–1247 http://www.jci.org
Identification of an Obesity Quantitative Trait Locus on Mouse Chromosome 2
and Evidence of Linkage to Body Fat and Insulin on the Human Homologous
Region 20q
Audra V. Lembertas,* Louis Pérusse,‡ Yvon C. Chagnon,‡ Janis S. Fisler,* Craig H. Warden,* Deborah A. Purcell-Huynh,*
France T. Dionne,‡ Jacques Gagnon,‡ André Nadeau,§ Aldons J. Lusis,* and Claude Bouchard‡
*Department of Medicine, Department of Microbiology and Molecular Genetics, and Molecular Biology Institute, University of California, Los Angeles, California 90095-1679; and ‡Physical Activity Sciences Laboratory and §Diabetes Research Unit, Laval
University, Ste-Foy, Quebec G1K 7P4, Canada
Abstract
Chromosomal synteny between the mouse model and hu-mans was used to map a gene for the complex trait of obe-sity. Analysis of NZB/BINJ 3 SM/J intercross mice located a quantitative trait locus (QTL) for obesity on distal mouse chromosome 2, in a region syntenic with a large region of human chromosome 20, showing linkage to percent body fat (likelihood of the odds [LOD] score 3.6) and fat mass (LOD score 4.3). The QTL was confirmed in a congenic mouse strain. To test whether the QTL contributes to human obe-sity, we studied linkage between markers located within a 52-cM region extending from 20p12 to 20q13.3 and mea-sures of obesity in 650 French Canadian subjects from 152 pedigrees participating in the Quebec Family Study. Sib-pair analysis based on a maximum of 258 sib Sib-pairs revealed suggestive linkages between the percentage of body fat (P,
0.004), body mass index (P , 0.008), and fasting insulin (P ,
0.0005) and a locus extending approximately from ADA (the adenosine deaminase gene)to MC3R (the melanocortin 3 receptor gene). These data provide evidence that a locus on human chromosome 20q contributes to body fat and in-sulin in a human population, and demonstrate the utility of using interspecies syntenic relationships to find relevant disease loci in humans. (J. Clin. Invest. 1997. 100:1240– 1247.) Key words: body mass index • ADA• ASP• MC3R
Introduction
Approximately one-third of the adult population in the United States is now overweight or obese (1), and obesity is associated with increased risk for many diseases, including heart disease, diabetes, hypertension, and cancer. The evidence for a genetic basis for obesity is compelling (2–7), and an understanding of
the pathways regulating body mass and body composition is beginning to emerge. Single gene mutation mouse models of obesity have been particularly informative and have led to the identification of leptin and other proteins controlling body fat stores (8–13). Nevertheless, the genetic factors contributing to differences in susceptibility to obesity in human populations remain largely unknown. Human obesity is multifactorial, with important environmental influences as well as multiple genetic factors, making analysis of the genetic contributions difficult.
The dissection of complex traits into their underlying ge-netic elements has begun for a number of diseases, using both human and animal populations (14–17). One method for iden-tifying genetic loci that contribute to complex traits in animals is quantitative trait locus (QTL)1 mapping, which involves
in-terbreeding two strains of mice which differ in the phenotype of interest for two generations to produce F2 mice. Each of these F2 mice represents a genetically unique combination of parental genes and phenotypes. The genome is then tested for the parental origin of the genetic elements, using polymorphic genetic markers in a whole-genome scan. Finally, statistical as-sociation of the inheritance of particular parental traits with unique genetic elements identifies loci which contain genes af-fecting these traits. These loci are broad, encompassing dis-tances of 15–30 cM. Resolution is limited by the number of ge-netic recombinations represented in the population examined, and, unlike simple Mendelian traits, a multigenic phenotype may require the coinheritance of minor genetic elements for the effect of the major locus to be seen.
A genetic locus can be isolated from other genes control-ling the trait by incorporating a small chromosomal segment containing the gene of interest from one mouse strain onto the genome of a second mouse strain by selective breeding to cre-ate a congenic strain (18–21). Thus, comparison of a pheno-type of a congenic strain with the phenopheno-type of its background strain allows study of the effects of single genes derived from the donor strain, isolated from the effects of other donor strain genes. The isolation of more than 40 minor histocompatibility genes (22) and the recent production of congenic mouse strains isolating epilepsy QTLs (23), nonobese diabetic mouse– derived diabetogenic genetic intervals (20), and SLE-suscepti-bility genes (21) demonstrate the feasiSLE-suscepti-bility of using congenic strains to dissect the complex pathogenic mechanisms of poly-genic disease.
Because of the evolutionary relationship between mice and humans, many ancestral chromosomal segments have been Reprint requests to A.J. Lusis, Ph.D., Division of Cardiology, 47-123
CHS, UCLA Medical Center, Los Angeles, CA 90095-1679. Phone: 310-825-1359; FAX: 310-794-7345; E-mail: jlusis@medicine.mcdsch. ucla.edu
Address correspondence to Janis S. Fisler, Ph.D., Research Car-diologist, UCLA, 2023 E. Sims Way #245, Port Townsend, WA 98368. Phone: 360-385-2089; FAX: 360-385-7546; E-mail: jfisler@ ucla.edu C.H. Warden’s current address is Med:Rowe Program, Uni-versity of California, Davis, CA 95616.
Received for publication 30 December 1996 and accepted in re-vised form 2 June 1997.
conserved, where the same genes occur in the same order within discrete regions. Chromosomal rearrangements have placed these syntenic regions on different chromosomes; how-ever, maps of linkage and synteny homologies between mice and humans (24) make it relatively straightforward to test in humans the candidate loci found in mouse studies. Mouse/hu-man synteny relationships have been recently summarized by DeBry and Seldin (25) (http://www.ncbi.nlm.nih.gov/Omim/ Homology/). Homologues of single genes that cause obesity in rodents were examined in several human populations with both positive (26, 27) and negative (28–30) results.
We report here the use of a whole-genome search in a mouse cross to identify a gene contributing to multigenic obe-sity on distal mouse chromosome 2. This locus was subse-quently confirmed in a congenic mouse strain. Examination of the homologous region in adult sibships from the Quebec Family Study shows that a locus on human chromosome 20q contributes to body fat and insulin in a human population, and demonstrates the utility of using interspecies syntenic relation-ships to find relevant disease loci in humans.
Methods
Mouse studies. NZB/BINJ and SM/J mice were purchased from The Jackson Laboratory (Bar Harbor, ME). NZB/BINJ females were mated with SM/J males to produce F1 progeny, which were brother– sister mated to produce F2 intercross mice. The NZB/BINJ 3 SM/J cross was initially set up to study genetic factors in lipoprotein metab-olism, and a complete description of the cross and the lipoproteins in these mice was reported previously (31). 84 female 21-d-old F2 mice were weaned onto rodent chow containing 12% calories as fat (Pu-rina 5001; Ralston Pu(Pu-rina, St. Louis, MO), then at 3–5 mo were fed an atherogenic diet containing 30% calories as fat (Teklad 90221; Teklad Premier Laboratory Diets, Madison, WI) for 15 wk. Chromosome 2 congenic mice, B10.LP/SnJ (H3, H13), and the corresponding back-ground strain, C57BL/10SnJ, were also purchased from The Jackson Laboratory. The congenic and background mice (n5 5 mice per group) were fed rodent chow (Purina 5001; Ralston Purina) until time of killing at 8 mo. The mice were housed and cared for under condi-tions meeting AAALAC accreditation standards. All mice were caged individually and given free access to food and water. A 12-h light–dark cycle was maintained throughout the experiment.
Quantitative phenotyping and genotyping of microsatellite mark-ers were done as previously described (31, 32). Mice were fasted z 15 h
before collection of blood and time of killing at 3 h into the light phase of the diurnal cycle. The mice were anesthetized using isoflurane and killed by cervical dislocation. Blood samples were collected from the retroorbital sinus in plasma separator tubes containing EDTA, placed on ice, and centrifuged to prepare plasma. Plasma insulin was deter-mined in congenic and background mice by RIA using a kit incorpo-rating a rat insulin standard (ICN Biomedicals, Inc., Costa Mesa, CA). Kidneys, liver, and spleen were collected for DNA isolation. In con-genic and background mice, four fat pads consisting of three intraab-dominal fat pads, the retroperitoneal, mesenteric, and gonadal fat pads, and the femoral fat pad, which is a subcutaneous fat pad on the outer thigh, were dissected, weighed, and returned to the carcass. Body composition was based on the carcass remaining after removal of the liver, kidneys, and spleen. The carcass was dried to constant weight at 908C, homogenized, and aliquots taken for extraction of lipid in a Soxhlet apparatus. Carcass water and lipid were determined gravimetrically. 84 female mice were analyzed in the F2 intercross. Five female congenic mice and five female background mice were an-alyzed in the congenic test.
All genotyping proceeded by PCR amplification of microsatellite markers. PCR primers for microsatellite markers were purchased
from Research Genetics (Huntsville, AL), and are listed in the fig-ures according to their commercial names. PCR was performed using mouse DNA at a concentration of 2 ng/ml in a volume of 10 ml. The
32P-labeled primers were allowed to anneal at 538C and extend at
728C for 25 cycles. The PCR products were visualized by running them on 5% acrylamide denaturing gels, and exposing the dried gels to x-ray film.
ANOVA and regression analysis were done using the Statview 4 statistical program for the Macintosh computer (Abacus Concepts, Inc., Berkeley, CA), while the linkage map and likelihood of the odds (LOD) scores for QTL mapping of the intercross were calculated us-ing the MAPMAKER/QTL program (provided by S. Lincoln and E. Lander, Whitehead Institute for Biomedical Research, Cambridge, MA). An LOD score of 4.3 or greater was considered statistically sig-nificant evidence of association in intercross mice (33). The data were adjusted for the effects of age by regression analysis.
Human studies. Selection criteria and the phenotypes measured in the Quebec Family Study have been described previously (34). Quantitation of various measures pertaining to obesity was per-formed in 650 individuals (351 females and 299 males) from 152 pedi-grees during a 1-d visit of the families to the laboratory. Measures in-cluded body mass index (BMI 5 weight in kilograms divided by height in squared meters), percent fat, and subcutaneous fat. Body density was measured by the underwater weighing procedure, and percentage of body fat was computed from the estimate of body den-sity using the Siri equation (35). Fat mass and fat-free mass were com-puted from percent body fat and body mass. The amount of subcutane-ous fat was assessed by summing skinfold thickness (in millimeters) measured at six sites (abdominal, suprailiac, subscapular, medial calf, tri-cep, and bicep) on the left side of the body with a Harpenden skinfold caliper (Quinton #03496-001; Quinton Instrument Co., Seattle, WA 98121-2791), following the procedures recommended by the Interna-tional Biological Programme (36). Serum insulin was determined by RIA (37) in fasting subjects. These quantitative traits were adjusted by multiple regression procedures for the effects of age and sex, and standardized. Informed consent was obtained from all subjects after the nature and possible consequences of the study were explained.
All genotyping, with the exception of the melanocortin receptor 3 gene (MC3R) marker, was performed by PCR amplification of microsat-ellite markers, which are listed in the figures and tables according to their commercial names. PCR primers were obtained from Research Genetics except for the marker for the adenosine deaminase gene (ADA), which was constructed as described (38). PCR was performed using human DNA at a concentration of 10 ng/ml in a volume of 5 ml. The 32P-labeled
primers were allowed to anneal at 588C and extend at 728C for 25 cy-cles. The PCR products were visualized by running them on 5% acryl-amide denaturing gels, and exposing the dried gels to x-ray film. The alleles were numbered and identified consistently across families.
RFLP typing of MC3R was performed using PstI digestion of 5 mg DNA (New England Biolabs Ltd., Mississiauga, Ontario, Canada). The sizes of the resultant allelic fragments were 4.4 and 3.3 kb, measured by electrophoresis using lDNA digested with EcoRI and HindIII as standards. The alleles were detected by Southern blot analysis, using a 1.1-kb MC3R probe labeled with 32P by random priming, and
expos-ing the blots to Kodak XAR-5 film (Eastman Kodak Co., Rochester, NY) with intensifying screens for 72–120 h at 2708C.
from the S.A.G.E. genetic statistical software package (S.A.G.E., 1994. Statistical Analysis for Genetic Epidemiology, Release 2.2., avail-able from the Department of Epidemiology and Biostatistics, Case Western Reserve University, Cleveland, OH).
Results
Linkage analysis in mice. 84 female F2 mice from a cross be-tween NZB/BINJ and SM/J (31) were typed for measures of obesity and 126 genetic markers on all chromosomes except Y, with an average spacing of , 15 cM. Because the number of loci contributing to the variation in obesity in this cross is un-known, we chose to construct a map in which any gene would on average lie within 10 cM of a typed marker, so the power of detection of linkage would be maximized. The F2 mice ranged from 17.2 to 38.6 g (mean 24.2, SD 4.0) in weight, from 1.12 to 14.82 g (mean 4.48, SD 2.63) in fat mass, and from 6.0 to 38.4 (mean 17.6, SD 7.1) in percentage of body fat. We used the MAPMAKER/QTL program to find genetic loci (QTLs) un-derlying these traits. The distribution of these traits showed a right-sided skew towards higher values, and, although the un-transformed data gave LOD scores of 3.5 or greater, a log transformation normalized the data and was used for subse-quent analysis. The only locus in this cross showing significant linkage with obesity-related traits was found on mouse chromo-some 2, bordered by markers D2Mit28 and D2Mit22. This locus showed linkage to percent body fat (LOD score 3.6), fat mass (LOD score 4.3), and body weight (LOD score 4.8) (Fig. 1). Variation at this locus explained 36% of the phenotypic varia-tion in percent body fat in the NZB/BINJ 3 SM/J cross. At this locus, no QTLs . 3 were found for triglycerides or FFA. As this cross was not constructed to study obesity, plasma insulin was not measured in the NZB/BINJ 3 SM/J cross.
We reasoned that the genetic variations influencing obesity in the NZB/BINJ and SM/J cross may be relatively common, since many inbred strains of laboratory mice vary in body fat content and other traits related to obesity (40). Therefore, we examined a previously constructed congenic strain to deter-mine the effect of this chromosomal locus on obesity in mice in the absence of the contributing effects of other genes. The con-genic genome consists of DNA which is z 98% identical to the
background strain, with a small chromosomal segment do-nated by selective breeding from a second strain. Congenic strain B10.LP/SnJ consists of background strain C57BL/10SnJ, with a region containing the H3 and H13 histocompatibility loci on mouse chromosome 2 donated from strain LP/J. The borders of the donated region were mapped and lie z 2 cM
distal to Ada and 2 cM proximal to H3 (Fig. 2 A). When com-pared to the background strain, the congenic strain had a 7% decrease in body weight [congenic, 20.6560.56 (standard er-ror), background, 22.2160.36, P, 0.0478], a 66% decrease in retroperitoneal fat pad weight (0.03660.01, 0.10660.01, P,
0.0019), a 35% lower percent body fat (9.7361.0, 15.0260.93,
P, 0.0066), and 27% lower fasting plasma insulin (6.9660.92, 9.5661.59, P, 0.19) (Fig. 2 B). Plasma triglycerides did not differ in congenic and background mice. FFA were not mea-sured. Together, analysis of the NZB/BINJ 3 SM/J cross and comparison of the background and congenic strains demon-strate that distal mouse chromosome 2 contains a genetic locus with a substantial influence on body fat.
Linkage analysis in humans. To test whether the corre-sponding human chromosomal region contributes to multi-genic obesity, subjects from the Quebec Family Study were ex-amined. All of human chromosome 20 is homologous to the region of distal mouse chromosome 2 beginning with the gene
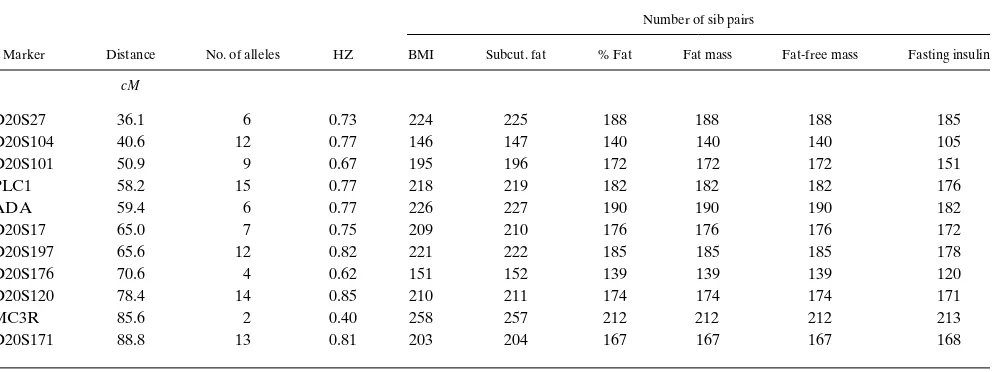
Snrbp at 72 cM and extending to the gene Acra4 at 108 cM (25). 11 markers within this region of chromosome 20 spanning a 52-cM region extending from approximately 20p12 to 20q13.3 were typed. Since earlier data from The Quebec Fam-ily Study indicated linkage of obesity to ADA isoforms (41), typing began with a marker within ADA and expanded in ei-ther direction. A maximum of 258 sib pairs (Table I), of which 130 pairs (78 female, 52 male) were of the same sex and 128 pairs were of opposite sex, were studied. This population was characterized for the obesity-related phenotypes listed in Ta-ble II. The subjects varied from 18 to 94 yr in age and from 4 to 60% body fat.
Results of linkage analysis are presented in Fig. 3. Sugges-tive evidence of linkage was observed between the percentage of body fat and the markers PLC1 (phospholipaseC gene) (P,
0.013), ADA (P, 0.0079), D20S17 (P, 0.0078), D20S120 (P,
0.004), and MC3R (P, 0.037). These results suggest the pres-ence of two linkage peaks for percent body fat, one between
PLC1 and D20S17, and another z 20–25 cM telomeric at D20S120 and MC3R (Fig. 3). The reason for the absence of linkage at D20S197 and D20S176 is unclear, given the compa-rable heterozygosity of these markers. One possibility is that these peaks are not part of the same linkage group. We tested this possibility by using the proportion of alleles shared i.b.d. among siblings to determine linkage groups and to order loci (42). This analysis indicated that these two peaks are actually part of the same linkage group. Another explanation is that there are two closely mapping genes which underlie percent-age of body fat, although a total absence of linkpercent-age at markers between genes in close proximity is unlikely. Another
[image:4.612.58.297.440.631.2]ity is that a small chromosomal inversion has occured within this population that has placed these two markers at the outer perimeter of the linkage group. Peak linkages for BMI, fat mass, and subcutaneous fat occurred at MC3R, with signifi-cance of P, 0.008, 0.011, and 0.017, respectively. The stron-gest linkage observed was to fasting insulin at MC3R (P,
0.0005). Plasma triglycerides and FFA were not examined. It is noteworthy that this region of chromosome 20 does not exert any influence on lean body mass (fat-free mass) and appears to be specifically involved in determining adiposity and fasting in-sulin levels.
To remove the influence of outliers on the results, the dis-tribution of standardized phenotypes was examined. Individu-als with phenotype values beyond 3 SD from the mean were identified and set aside. There were eight outliers for BMI and
subcutaneous fat, seven outliers for fasting insulin, six outliers for fat-free mass, five outliers for fat mass, and only one outlier for percent body fat. Linkage analyses were repeated without these individuals, and the results remained largely unchanged for percent body fat. For BMI and subcutaneous fat, the P val-ues were slightly reduced but remained significant (P, 0.05). The linkage for fat mass shifted slightly distally (MC3RP,
0.046, D20S120P, 0.016, D20S104P, 0.011), but removal of outliers did not affect the linkage results in this region. How-ever, the P value for linkage observed between fasting insulin and the MC3R marker went from 0.0005 to 0.03. Because the seven outliers for insulin could contribute to a real linkage with the marker for MC3R, we repeated the analysis for this phenotype by using a log10 transformation of the data to
[image:5.612.59.429.62.251.2]re-duce skewness, and kept the outliers in the analysis. With this
Figure 2. (A) The boundaries of the congenic region in B10.LP/SnJ mice: the shaded area represents DNA do-nated by the C57BL/10SnJ mouse and the open area represents DNA donated by the LP/J mouse. The boundaries were determined by genotyping all in-dicated markers except for H3, H13,
Agouti, and Ada. Map distances from the top of the chromosome are indi-cated. (B) Percent differences between the congenic mice (B10.LP/SnJ) and the background strain (C57BL/10SnJ) for percent body fat (Lipid), live body weight, retroperitoneal fat pad weight, and fasting insulin. Congenic mice, n5
5, and background mice, n5 5, were maintained under standard vivarium conditions (chow diet and water ad libi-tum, 12-h light–dark cycle) before time of killing at 5 mo. The congenic strain was significantly different from the background strain in percent body fat (P, 0.0066), body weight (P,
0.0478), and retroperitoneal fat pad weight (P, 0.0019), but not in insulin (P, 0.19).
Table I. Linkage Distances, Observed Allele Number, Heterozygosity Index, and Number of Sib Pairs Examined for Six Traits at 11 Markers on Chromosome 20
Marker Distance No. of alleles HZ
Number of sib pairs
BMI Subcut. fat % Fat Fat mass Fat-free mass Fasting insulin
cM
D20S27 36.1 6 0.73 224 225 188 188 188 185
D20S104 40.6 12 0.77 146 147 140 140 140 105
D20S101 50.9 9 0.67 195 196 172 172 172 151
PLC1 58.2 15 0.77 218 219 182 182 182 176
ADA 59.4 6 0.77 226 227 190 190 190 182
D20S17 65.0 7 0.75 209 210 176 176 176 172
D20S197 65.6 12 0.82 221 222 185 185 185 178
D20S176 70.6 4 0.62 151 152 139 139 139 120
D20S120 78.4 14 0.85 210 211 174 174 174 171
MC3R 85.6 2 0.40 258 257 212 212 212 213
D20S171 88.8 13 0.81 203 204 167 167 167 168
[image:5.612.61.557.519.705.2]transformation, the linkage observed remained significant (P, 0.0008). Therefore, we are confident that the linkages re-ported in Fig. 3 are not caused by extreme phenotypic values.
Discussion
This study used chromosomal synteny between the mouse model and humans to map a gene for obesity on human chro-mosome 20q. An initial whole-genome scan of the NZB/BINJ 3
SM/J intercross progeny identified a single significant locus on distal mouse chromosome 2. The presence of an obesity gene on distal mouse chromosome 2 was confirmed using an unre-lated congenic strain. As this region of mouse chromosome 2 is syntenic to human chromosome 20, we examined linkage be-tween markers located within a 52-cM region extending from
20p12 to 20q13.3 and measures of obesity in French Canadian subjects. Sib-pair analysis of participants in the Quebec Family Study revealed suggestive linkages between percentage of body fat (P, 0.004) and fasting insulin (P, 0.0005), and a locus en-compassing markers from ADA through MC3R. Suggestive linkages were also found for BMI (P, 0.008), subcutaneous fat (P, 0.017), and fat mass (P, 0.011), at MC3R. Although the mouse data predicted a locus affecting body composition in this region, the difference in fasting insulin in the congenic and background mice did not anticipate the very strong link-age seen in the humans. Because no insulin measurements were obtained in the intercross mice, it is unknown whether the chromosome 2 locus influenced insulin levels in these mice. Arguments have been made against the significance of re-ported linkages of the order of P5 0.05 arising from a high-density whole-genome scan (33). Thus, P value thresholds of 7.4 3 1024 have been recommended for suggestive linkage,
and 2.2 3 1025 for significant linkage, in humans using sib-pair
analysis (33). However, these guidelines may be too stringent when applied to the present data. In this study, both the QTL in the mouse cross and the difference between congenic and background strains suggested that the search be restricted to a 50-cM region of linked markers on human chromosome 20. Therefore, linkage at this site can be considered a true single-point test of significance rather than the result of a genome-wide search. However, as the number of markers tested in-creases, the likelihood that linkage will be found purely by chance also increases. If the critical P value for 11 random marker tests is P5 0.05/n, where n is the number of tests, then percentage of body fat at D20S120 and fasting insulin at
MC3R still meet the critical cutoff of P5 0.0045. Linkage with percentage of body fat at D20S120 remains even after the re-moval of outliers beyond 3 SDs. To further establish the stabil-ity of these results, we calculated the 95% confidence interval of the regression coefficient for the significant linkages, and found that for P values , 0.017, the coefficient of regression remains negative, suggesting that most of the linkages re-ported in Fig. 3 are significant. However, it is important to con-firm these results in additional population samples.
Measurement of multiple phenotypes likewise may require adjustment of the significance level (33). The Quebec Family Study data suggest that BMI and percent body fat likely share common genetic effects (i.e., pleiotropy), and that the bivariate heritability or common heritability between the two pheno-types is 10% (43). Thus, it is likely that one gene or a set of genes influences all of the obesity phenotypes. Although BMI and percent body fat were well correlated within individuals, the covariation between these traits is not necessarily attribut-able to common genetic factors and may be rather the result of environmental factors specific to each individual. However, un-der the pleiotropy hypothesis, we assume that the correlation between BMI and percent fat is at least partly accounted for by genetic factors. Therefore, no Bonferroni correction of the P
[image:6.612.57.298.73.180.2]values to adjust for multiple obesity phenotypes was made (33). A complete linkage map of the mouse and human chromo-somal regions examined is shown in Fig. 4, where the intro-gressed region of the congenic mouse model as well as the 90% confidence interval for the mouse QTL are indicated. Given that the confidence interval for the QTL is not precise, the possible genes in the syntenic human region range from the agouti signaling protein gene (ASP) to the phospho-enolpyruvate carboxykinase gene (PCK1). There are several
Table II. Phenotype Measurements of Subjects
Variable No. Mean SD Min. Max.
Age (yr) 650 43.2 17.6 18.2 93.5 BMI (kg/m2) 645 26.4 6.2 16.8 64.9
Subcutaneous fat (mm) 614 115.5 62.2 24 448 Body fat (%) 535 28.2 10.7 4 60 Fat mass (kg) 535 21.3 12.1 2.1 109.3 Fat-free mass (kg) 535 51.3 10.7 29.3 83.4 Fasting insulin (pmol/liter) 475 68.7 56.1 1 588
Min., minimum. Max., maximum.
[image:6.612.59.295.398.692.2]attractive candidate genes at this locus. Linkage for percent body fat occurred in the region of ADA (Fig. 3), which has been suggested to be a possible candidate gene for obesity (41). ADA is an a-adrenergic agonist with potent lipolytic and vasodilator effects which regulates both lipolysis and insulin sensitivity in human adipose tissue (44–46). Thus, variations in ADA could theoretically explain the effects of this locus on both energy balance and insulin levels. Another candidate at this locus is the agouti gene, mutations of which result in ec-topic expression of the normal agouti protein, resulting in yel-low fur, obesity, and diabetes in mice (8, 11). However, mark-ers linked to the human homolog ASP showed no linkage to obesity in two prior studies (see below) (28, 29). An attractive candidate for the human locus is MC3R, which is located on human chromosome 20q (47), 8 cM telomeric to D20S120, and is linked with percent fat, fat mass, subcutaneous fat, and plasma insulin in this study. MC3R is expressed in the hypo-thalamus, which is involved in neuroendocrine and autonomic control (48). Melanocortin-3 receptors can be activated well by all members of the melanocortin family, including a–, b– and
g–melanocyte-stimulating hormone and ACTH (49). Since
MC3R has been mapped in mice to z 2 cM distal to D2Mit52
(50), which maps distal to D2Mit227, MC3R appears to lie out-side the congenic region of the B10.LP/SnJ mouse (see Fig. 2
A). However, MC3R remains a candidate for the QTL in the NZB/BINJ 3 SM/J cross and in the human population. An-other candidate, mapping to 20q13.3, is cytosolic PCK1 (51). When the murine homologue of PCK1 is slightly overex-pressed in transgenic rats, it leads to glucose intolerance and an increase in visceral adipose tissue in females (52). It is possi-ble that the locus represents an unknown gene.
Evidence of linkage between various genetic markers and the amount of body fat in humans has been reviewed recently (53). Only a few loci, identified by the use of the single locus sib-pair linkage method with a large number of sib pairs, show moderate to strong linkage (P, 0.005) with direct measures of body fat. One of them is the Kell blood group locus (7q33), which showed a strong linkage (P, 0.0001) with the amount of subcutaneous fat in 402 sib pairs from the Quebec Family Study (41). More recently, another study on z 250 sib pairs
from the Quebec Family Study showed linkage between markers
D1S200 and D1S476 on 1p32-p22, and fat mass (0.009 ,P,
0.02) and subcutaneous fat (P, 0.02 at D1S476) (54). In a dif-ferent population, a marker (Tnfir24) located near TNF-a
(6p21.3) was shown to be linked (P, 0.002) to percent body fat measured by underwater weighing in Pima Indians (55). A single polymorphism was located in the promoter region of
TNF-a, but association could not be demonstrated between al-leles at the polymorphism and percent body fat by these inves-tigators.
Several studies have examined linkage of obesity to the genes which cause monogenic obesity in mice. Positive linkage of obesity measures to the obese gene was observed in French obese families (BMI . 35, P, 0.002) (26), Mexican Ameri-cans (BMI, P, 0.003, trunkal skinfold thickness, P, 0.003, extremity skinfolds, P , 0.00014, waist circumference, P ,
0.00063) (27), and an American population of extremely obese individuals (BMI . 40, P , 0.04) (56). However, the obese
gene was not linked to obesity, measured as BMI . 30, in a second population of Mexican Americans (30), nor to mea-sures of obesity and energy metabolism in Pima Indians (29). The single gene mutation, diabetes, and a QTL, dietary obese 1,
map to the mid-portion of mouse chromosome 4, a region syn-tenic to human 1p31 and 1p35–p31. In adult sibships from the Quebec Family Study, suggestive linkages between markers on human 1p32–p22, and body fat and insulin have been reported recently with the strongest association found with fat mass (P5 0.009) (54). Also in the Quebec Family Study, positive linkage of BMI (P, 0.001) and skinfold thickness (P, 0.016) was found with plasma isoforms of the enzyme ADA (41), the gene for which maps to distal mouse chromosome 2, an area which shows striking linkage conservation with human chro-mosome 20, with identical gene order but expanded length in the human genome (25). The agouti gene, several mutations of which cause obesity in mice (57), maps to this same region, al-though subsequent studies in other human populations did not find linkage of obesity and polymorphic DNA markers flank-ing the agouti locus (28, 29). The linkage analyses in these dif-ferent populations do not necessarily need to be consistent. It is possible for one population to have alleles of a gene at a lo-cus which promote obesity, whereas those alleles could be too rare or too prevalent in a second population for detection of significant linkage. This may be the case in one population re-porting negative results (29).
[image:7.612.317.554.56.309.2]Loci contributing to multigenic obesity, in addition to the one reported here, have been identified recently in humans through wide-genome searches for obesity genes. In one of these studies based on 660 markers spaced at an average of 8 cM and typed in 874 Pima Indians, two loci located on
11q21–q22 and 3p24.2–p22 showed significant linkage (P 5
0.001) with percent body fat (58). In another study, 169 mark-ers spaced at z 20 cM were typed in 458 Mexican Americans,
and a locus located on 2p21 showed evidence of linkage (LOD score 2.7) with fat mass (59).
Results of this study based on syntenic mouse models dem-onstrate for the first time that a QTL on mouse chromosome 2/human chromosome 20 influences adiposity in humans. Sev-eral loci contributing to multigenic obesity, in addition to the one reported here, have been identified in various mouse mod-els (32, 60–63). We chose to examine the human chromosome 20 locus, since the evidence in mice was particularly convinc-ing, the region of synteny was clear, and since we previously found linkage of BMI and skinfold thickness with plasma iso-forms of ADA, the gene for which maps to this region. It will be important to study in a similar manner additional loci iden-tified in animal models. An earlier attempt to use this ap-proach to identify the human homologue of an insulin-depen-dent diabetes mellitus–susceptibility gene first iinsulin-depen-dentified in the nonobese diabetic mouse model was not successful (64). It has been argued that the ability of this method to detect human loci depends on the frequency of the alleles conferring suscep-tibility to a trait in the human population examined (65). How-ever, more recently, using mouse/human synteny relationships to find linkage to obesity with the human homologue of the mouse
diabetes gene (54), and the mouse obese gene has been more successful (26, 27, 56). In the appropriate population, such coor-dinated studies of the genetic control of obesity in both mice and humans should provide a powerful strategy for identifying the underlying causes of this significant public health problem.
Acknowledgments
The authors thank Dr. Ping-Zi Wen, Ms. Lara Accad, and Mr. Mat-thew Thimgan for genotyping assistance, and Mr. Mark Cuevas for assistance with mouse phenotyping. Gratitude is also expressed to Monique Chagnon and Anne-Marie Bricault for the MC3R typing. The authors would like to acknowledge Dr. William O. Wilkison from the Glaxo Research Institute who made the MC3R probe avail-able to us. Some of the results presented herein were obtained with the program S.A.G.E., which is supported by a U.S. Public Health Service Resource Grant (1P41 RR03655) from the National Center for Research Resources.
This work was supported by grants from the National Institutes of Health (DK-45066 and HL-42488), and from the Medical Research Council of Canada (PG-11811). A.V. Lembertas was supported by National Institutes of Health training grant DK07685, and L. Pérusse was supported by a research scholarship from Fonds de la Recherche en Sante du Québec (FRSQ)-Québec.
References
1. Kuczmarski, R.S., K.M. Flegal, S.M. Campbell, and C.L. Johnson. 1994. Increasing prevalence of overweight among U.S. adults. The National Health and Nutrition Examination Surveys, 1960 to 1991. JAMA (J. Am. Med. Assoc.). 272:205–211.
2. Vogler, G.P., T.I.A. Sorensen, A.J. Stunkard, M.R. Srinivasan, and D.C. Rao. 1995. Influences of genes and shared environment on adult body mass in-dex assessed in an adoption study by a comprehensive path model. Int. J. Obes. 19:40–45.
3. Stunkard, A.J., J.R. Harris, N.L. Pedersen, and G.E. McClearn. 1990. The body-mass index of twins who have been reared apart. N. Engl. J. Med. 322:1483–1487.
4. Tambs, K., T. Moum, L. Eaves, M. Neale, K. Midthjell, P.G. Lund-Larsen, S. Naess, and J. Holmen. 1991. Genetic and environmental contribu-tions to the variance on the body mass index in a Norwegian sample of first- and
second-degree relatives. Am. J. Hum. Biol. 3:257–267.
5. Price, R.A., R. Ness, and P. Laskarzewski. 1990. Common major gene in-heritance of extreme overweight. Hum. Biol. 62:747–765.
6. Rice, T., I.B. Borecki, C. Bouchard, and D.C. Rao. 1993. Segregation analysis of fat mass and other body composition measures derived from under-water weighing. Am. J. Hum. Genet. 52:967–973.
7. Bouchard, C., A. Tremblay, J.-P. Després, A. Nadeau, P.J. Lupien, G. Théri-ault, J. DussThéri-ault, S. Moorjani, S. PineThéri-ault, and G. Fournier. 1990. The response to long-term overfeeding in identical twins. N. Engl. J. Med. 322:1477–1482.
8. Bultman, S.J., E.J. Michaud, and R.P. Woychik. 1992. Molecular charac-terization of the mouse agouti locus. Cell. 71:1195–1204.
9. Zhang, Y., R. Proenca, M. Maffel, M. Barone, L. Leopold, and J.M. Friedman. 1994. Positional cloning of the mouse obese gene and its human ho-mologue. Nature (Lond.). 372:425–432.
10. Naggert, J.K., L.D. Fricker, O. Varlamov, P.M. Nishina, Y. Rouille, D.F. Steiner, R.J. Carroll, B.J. Paigen, and E.H. Leiter. 1995. Hyperproinsu-linaemia in obese fat/fat mice associated with a carboxypeptidase E mutation which reduces enzyme activity. Nat. Genet. 10:135–141.
11. Miller, M.W., D.M.J. Duhl, H. Vrieling, S.P. Cordes, M.M. Ollmann, B.M. Winkes, and G.S. Barsh. 1993. Cloning of the mouse agouti gene predicts a secreted protein ubiquitously expressed in mice carrying the lethal yellow mu-tation. Genes Dev. 7:454–467.
12. Tartaglia, L.A., M. Dembski, X. Weng, N. Deng, J. Culpepper, R. De-vos, G.J. Richards, L.A. Campfield, F.T. Clark, J. Deeds, et al. 1995. Identifica-tion and expression cloning of a leptin receptor, OB-R. Cell. 83:1263–1271.
13. Chen, H., O. Charlat, L.A. Tartaglia, E.A. Woolf, X. Weng, S.J. Ellis, N.D. Lakey, J. Culpepper, K.J. Moore, R.E. Breitbart, et al. 1996. Evidence that the diabetes gene encodes the leptin receptor: identification of a mutation in the leptin receptor gene in db/db mice. Cell. 84:491–495.
14. Lander, E.S., and N.J. Schork. 1994. Genetic dissection of complex traits. Science (Wash. DC). 265:2037–2048.
15. Jacob, H.J., K. Lindpaintner, S.E. Lincoln, K. Kusumi, R.K. Bunker, Y.P. Mao, D. Ganten, V.J. Dzau, and E.S. Lander. 1991. Genetic mapping of a gene causing hypertension in the stroke-prone spontaneously hypertensive rat. Cell. 67:213–224.
16. Todd, J.A., T.J. Aitman, R.J. Cornall, S. Ghosh, J. Hall, C.M. Hearne, A. Knight, J. Love, M.A. McAleer, J.B. Prins, et al. 1991. Genetic analysis of a complex, multifactorial disease, autoimmune type 1 (insulin-dependent) diabe-tes. Res. Immunol. 142:483.
17. Ghosh, S., S.M. Palmer, N.R. Rodrigues, H.J. Cordell, C.M. Hearne, R.J. Cornall, J.-B. Prins, P. McShane, G.M. Lathrop, L.B. Peterson, et al. 1993. Polygenic control of autoimmune diabetes in nonobese diabetic mice. Nat. Genet. 4:404–409.
18. Snell, G.D. 1948. Methods for the study of histocompatibility genes. J. Genet. 49:87–108.
19. Snell, G.D. 1958. Histocompatibility genes of the mouse. I. Demonstra-tion of weak histocompatibility differences by immunizaDemonstra-tion and controlled tu-mor dose. J. Natl. Cancer Inst. 20:787–824.
20. Yui, M.A., K. Muralidharan, B. Moreno-Altamirano, G. Perrin, K. Chestnut, and E.K. Wakeland. 1996. Production of congenic mouse strains car-rying NOD-derived diabetogenic genetic intervals: an approach for the genetic dissection of complex traits. Mamm. Genome. 7:331–334.
21. Morel, L., Y. Yu, K.R. Blenman, R.A. Caldwell, and E.K. Wakeland. 1996. Production of congenic mouse strains carrying genomic intervals contain-ing SLE-susceptibility genes derived from the SLE-prone NZM2410 strain. Mamm. Genome. 7:335–339.
22. Graff, R.J., and G.D. Snell. 1968. Histocompatibility genes of mice. 8. The alleles of the H-1 locus. Transplantation (Baltimore). 6:598–617.
23. Frankel, W.N., E.W. Johnson, and C.M. Lutz. 1995. Congenic strains re-veal effects of the epilepsy quantitative trait locus, El2, separate from other El loci. Mamm. Genome. 6:839–843.
24. Nadeau, J.H. 1989. Maps of linkage and synteny homologies between mouse and man. Trends Genet. 5:82–86.
25. DeBry, R.W., and M.F. Seldin. 1996. Human/mouse homology relation-ships. Genomics. 33:337–351.
26. Clement, K., C. Garner, J. Hager, A. Philippi, C. LeDuc, A. Carey, T.J.R. Harris, C. Jury, L.R. Cardon, A. Basdevant, et al. 1996. Indication for linkage of the human OB gene region with extreme obesity. Diabetes. 45:687–690. 27. Duggirala, R., M. Stern, B. Mitchell, L. Reinhart, P. Shipman, O. Ure-sandi, W. Chung, R. Leibel, C. Hales, P. O’Connell, and J. Blangero. 1996. Quantitative variation in obesity-related traits and insulin precursors linked to the OB gene region on human chromosome 7. Am. J. Hum. Genet. 59:694–703.
28. Xu, W., D.R. Reed, Y. Ding, and R.A. Price. 1995. Absence of linkage between human obesity and the mouse agouti homologous region (20q11.2) or other markers spanning chromosome 20q. Obes. Res. 3:559–562.
29. Norman, R.A., R.L. Leibel, W.K. Chung, L. Power-Kehoe, S.C. Chua, Jr., W.C. Knowler, D.B. Thompson, C. Bogardus, and E. Ravussin. 1996. Ab-sence of linkage of obesity and energy metabolism to markers flanking homo-logues of rodent obesity genes in Pima Indians. Diabetes. 45:1229–1232.
31. Purcell-Huynh, D.A., A. Weinreb, L.W. Castellani, M. Mehrabian, M.K. Doolittle, and A.J. Lusis. 1995. Genetic factors in lipoprotein metabolism: analysis of a genetic cross between inbred mouse strains NZB/B1NJ and SM/J using a complete linkage map approach. J. Clin. Invest. 96:1845–1858.
32. Warden, C.H., J.S. Fisler, S.M. Shoemaker, P.-Z. Wen, K.L. Svenson, M.J. Pace, and A.J. Lusis. 1995. Identification of four chromosomal loci deter-mining obesity in a multifactorial mouse model. J. Clin. Invest. 95:1545–1552.
33. Lander, E.S., and L. Kruglyak. 1995. Genetic dissection of complex traits: guidelines for interpreting and reporting linkage results. Nat. Genet. 11: 241–247.
34. Bouchard, C. 1996. Genetic epidemiology, association, and sib-pair link-age: results from the Québec Family Study. In Molecular and Genetic Aspects of Obesity. Vol. 5, Pennington Center Nutrition Series. G.A. Bray and D.H. Ryan, editors. Louisiana State University Press, Baton Rouge. 470–481.
35. Siri, W.E. 1956. The gross composition of the body. Adv. Biol. Med. Phys. IV:239–280.
36. Weiner, J.S., and J.A. Lourie. 1969. Human Biology: A Guide to Field Methods. Blackwell Publishers, Oxford.
37. Desbuquois, B., and G.D. Aurbach. 1971. Use of polyethylene glycol to separate free and antibody-bound peptide hormones in radioimmunoassays. J. Clin. Endocrinol. Metab. 37:732–738.
38. Patel, P., Y.-M.D. Lo, A. Hattersley, G.I. Bell, A. Tybjaerg-Hansen, J. Nerup, R.C. Turner, and J.S. Wainscoat. 1992. Linkage analysis of maturity-onset diabetes of the young with microsatellite polymorphisms: no linkage to ADA or GLUT2 genes in two families. Diabetes. 41:962–967.
39. Haseman, J.K., and R.C. Elston. 1972. The investigation of linkage be-tween a quantitative trait and a marker locus. Behav. Genet. 2:3–19.
40. West, D.B., C.N. Boozer, D.L. Moody, and R.L. Atkinson. 1992. Di-etary obesity in nine inbred mouse strains. Am. J. Physiol. 262:R1025–R1032.
41. Borecki, I.B., T. Rice, L. Pérusse, C. Bouchard, and D.C. Rao. 1994. An exploratory investigation of genetic linkage with body composition and fatness phenotypes: the Québec family study. Obes. Res. 2:213–219.
42. Elston, R.C., and B.J. Keats. 1985. Sib pair analyses to determine link-age groups and to order loci. Genet. Epidemiol. 2:211–213.
43. Rice, T., A. Tremblay, O. Dériaz, L. Pérusse, D.C. Rao, and C. Bou-chard. 1996. Genetic pleiotropy for resting metabolic rate with fat-free mass and fat mass: the Québec Family Study. Obes. Res. 4:125–131.
44. Schwabe, U., R. Ebert, and H.C. Erbler. 1973. Adenosine release from isolated fat cells and its significance for the effects of hormones on cyclic 39,59 -AMP levels and lipolysis. Naunyn-Schmiedeberg’s Arch. Pharmacol. 278:247–259. 45. Ohisalo, J.J., S. Ranta, and I.T. Huhtaniemi. 1984. Inhibition of adeno-sine 39,59-monophosphate accumulation and lipolysis by adenosine analogs in human subcutaneous adipocytes. J. Clin. Endocrinol. Metab. 58:32–35.
46. Kern, P.A., J.M. Ong, J.W.F. Goers, and M.E. Pedersen. 1988. Regula-tion of lipoprotein lipase immunoreactive mass in isolated human adipocytes. J. Clin. Invest. 81:398–406.
47. Gantz, I., T. Tashiro, C. Barcroft, Y. Konda, Y. Shimoto, H. Miwa, T. Glover, G. Munzert, and T. Yamada. 1993. Localization of the genes encoding the melanocortin-2 (adrenocorticotropic hormone) and melanocortin-3 recep-tors to chromosomes 10p11.2 and 20q13.2-q13.3 by fluorescent in situ hybrid-ization. Genomics. 18:166–167.
48. Roselli-Rehfuss, L., K.G. Mountjoy, L.S. Robbins, M.T. Mortrud, M.J. Low, J.B. Tatro, M.L. Entwistle, R.B. Simerly, and R.D. Cone. 1993. Identifica-tion of a receptor for g-melanotropin and other proopionmelanocortin peptides in the hypothalamus and limbic system. Proc. Natl. Acad. Sci. USA. 90:8856–8860. 49. Miwa, H., I. Gantz, Y. Konda, Y. Simoto, and T. Yamada. 1995. Struc-tural determinants of the melanocortin peptides required for activation of mela-nocortin-3 and melanocortin-4 receptors. J. Pharmacol. Exp. Ther. 273:367–372.
50. Malas, S., J. Peters, and C. Abbott. 1994. The genes for endothelin 3, vi-tamin D 24-hydroxylase, and melanocortin 3 receptor map to distal mouse chromosome 2, in the region of conserved synteny with human chromosome 20. Mamm. Genome. 5:557–579.
51. Stoffel, M., K. Xiang, R. Espinosa, N.J. Cox, M.M. Le Beau, and B.I. Bell. 1993. cDNA sequence and localization of polymorphic human cytosolic phosphoenolpyruvate carboxykinase gene (PCK1) to chromosome 20, band q13.31: PCK1 is not tightly linked to maturity-onset diabetes of the young. Hum. Mol. Genet. 1:1–4.
52. Valera, A., A. Pujol, M. Pelegrin, and F. Bosch. 1994. Transgenic mice overexpressing phosphoenolpyruvate carboxykinase develop non-insulin de-pendent diabetes mellitus. Proc. Natl. Acad. Sci. USA. 91:9151–9154.
53. Pérusse, L., Y.C. Chagnon, F.T. Dionne, and C. Bouchard. 1997. The human obesity gene map: the 1996 update. Obes. Res. 5:49–61.
54. Chagnon, Y.C., L. Pérusse, M. Lamothe, M. Chagnon, A. Nadeau, F.T. Dionne, J. Gagnon, W.K. Chung, R.L. Leibel, and C. Bouchard. 1997. Sugges-tive linkages between markers on human 1p32-p22 and body fat and insulin lev-els in the Quebec Family Study. Obes. Res. 5:115–121.
55. Norman, R.A., C. Bogardus, and E. Ravussin. 1995. Linkage between obesity and a marker near the tumor necrosis-alpha locus in Pima Indians. J. Clin. Invest. 96:158–162.
56. Reed, D.R., Y. Ding, W. Xu, C. Cather, E.D. Green, and R.A. Price. 1996. Extreme obesity may be linked to markers flanking the human OB gene. Diabetes. 45:691–694.
57. Wilson, B.D., M.M. Ollmann, L. Kang, M. Stoffel, G.I. Bell, and G.S. Barsh. 1995. Structure and function of ASP, the human homolog of the mouse agouti gene. Hum. Mol. Genet. 4:223–230.
58. Norman, R., D. Thompson, T. Foroud, W. Garvey, P. Bennett, C. Bo-gardus, and E. Ravussin. 1997. Genomewide search for genes influencing per-cent body fat in Pima Indians: suggestive linkage at chromosome 11q21-q22. Pima Diabetes Gene Group. Am. J. Hum. Genet. 60:166–173.
59. Comuzzie, A., J. Hixson, L. Almasy, B. Mitchell, M. Mahaney, T. Dyer, M. Stern, J. MacCluer, and J. Blangero. 1997. A major quantitative trait locus determining serum leptin levels and fat mass is located on human chromosome 2. Nat. Genet. 15:273–276.
60. Warden, C.H., J.S. Fisler, M.J. Pace, K.L. Svenson, and A.J. Lusis. 1993. Coincidence of genetic loci for plasma cholesterol levels and obesity in a multi-factorial mouse model. J. Clin. Invest. 92:773–779.
61. West, D.B., J. Waguespack, B. York, J. Goudey-Lefevre, and R.A. Price. 1994. Genetics of dietary obesity in AKR/J 3 SWR/J mice: segregation of the trait and identification of a linked locus on chromosome 4. Mamm. Ge-nome. 5:546–552.
62. Pomp, D., M.A. Cushman, S.C. Foster, D.K. Drudik, M. Fortman, and E.J. Eisen. 1994. Identification of quantitative trait loci for body weight and body fat in mice. In 5th World Congress on Genetics Applied to Livestock Pro-duction. C. Smith, J.S. Gavora, B. Benkel, J. Chesnais, W. Fairfull, J.P. Gibson, B.W. Kennedy, and E.B. Burnside, editors. University of Guelph, Guelph, On-tario, Canada. 21:209–212.
63. West, D.B., J. Goudey-Lefevre, B. York, and G.E. Truett. 1994. Dietary obesity linked to genetic loci on chromosomes 9 and 15 in a polygenic mouse model. J. Clin. Invest. 94:1410–1416.
64. Hyer, R.N., C. Julier, J.D. Buckley, M. Trucco, J. Rotter, R. Spielman, A. Barnett, S. Bain, C. Boitard, I. Deschamps, et al. 1991. High-resolution link-age mapping for susceptibility genes in human polygenic disease: insulin-depen-dent diabetes mellitus and chromosome 11q. Am. J. Hum. Genet. 48:243–257.
65. Risch, N., S. Ghosh, and J.A. Todd. 1993. Statistical evaluation of multi-ple-locus linkage data in experimental species and its relevance to human stud-ies: application to nonobese diabetic (NOD) mouse and human insulin-depen-dent diabetes mellitus (IDDM). Am. J. Hum. Genet. 53:702–714.
66. Morton, N.E., A. Collins, S. Lawrence, and D.C. Shields. 1992. Algo-rithms for a location database. Ann. Hum. Genet. 56:223–232.