Copyright © 1998, American Society for Microbiology
Computerized Analysis of Restriction Fragment Length
Polymorphism Patterns: Comparative Evaluation
of Two Commercial Software Packages
P. GERNER-SMIDT,1* L. M. GRAVES,2SUSAN HUNTER,2ANDB. SWAMINATHAN2
Department of Gastrointestinal Infections, Statens Seruminstitut, Copenhagen, Denmark,1and
Foodborne and Diarrheal Diseases Branch, Division of Bacterial and Mycotic Diseases, Centers for Disease Control and Prevention, Atlanta, Georgia2
Received 15 July 1997/Returned for modification 14 January 1998/Accepted 13 February 1998
Two computerized restriction fragment length polymorphism pattern analysis systems, the BioImage system and the GelCompar system (Molecular Analyst Fingerprinting Plus in the United States), were compared. The two systems use different approaches to compare patterns from different gels. In GelCompar, a standard reference pattern in one gel is used to normalize subsequent gels containing lanes with the same reference pattern. In BioImage, the molecular sizes of the fragments are calculated from size standards present in each
gel. The molecular size estimates obtained with the two systems for 12 restriction fragments of phagelwere
between 97 and 101% of their actual sizes, with a standard deviation of less than 1% of the average estimated size for most fragments. At the window sizes used for analysis, the GelCompar system performed somewhat better than BioImage in identifying visually identical patterns generated by electrophoretic separation of
HhaI-restricted DNA of Listeria monocytogenes. Both systems require the user to make critical decisions in the
analysis. It is very important to visually verify that the systems are finding all bands in each lane and that no artifacts are being detected; both systems allow manual editing. It is also important to verify results obtained in the pattern matching or clustering portions of the analysis.
Electrophoresis-based fingerprinting methods are now rou-tinely used for epidemiological typing of bacteria and fungi. The first methods used included analysis of whole-cell or cell envelope protein patterns and classical DNA fingerprinting methods such as restriction enzyme analysis (REA), ribotyp-ing, and insertion sequence fingerprinting. Later, macrorestric-tion analysis of genomic DNA by the use of low-frequency-cutting restriction enzymes and pulsed-field gel electrophoresis was introduced. Most recently, PCR-based methods such as random amplification of polymorphic DNA, typing by ampli-fication of genomic DNA between repetitive extragenetic pal-indromic sequences, and amplified DNA restriction analysis have been described (6). These electrophoretic methods have mostly been used to compare results obtained within one ex-periment on the same gel. Recent efforts to standardize the methods and the development of computer-based pattern analysis methods have made it possible to compare large num-bers of patterns generated in the same or different laborato-ries.
With these computer-based pattern analysis programs, it is possible to build up databases of DNA restriction fragment length polymorphism (RFLP) patterns and perform identity searches of new patterns in these databases. In addition, the software packages can perform more sophisticated similarity calculations and cluster analyses of the patterns in the data-bases. They are now increasingly being used (3–5, 7, 8) for epidemiological typing, but to our knowledge different soft-ware packages have not been compared.
In the present study, we compared two such systems, the GelCompar (Applied Maths, Kortrijk, Belgium; sold as
Mo-lecular Analyst Fingerprinting Plus by Bio-Rad Laboratories, Hercules, Calif.) and the BioImage system (BioImage Corpo-ration, Ann Arbor, Mich.), to determine if results generated by the two programs were comparable. These two systems were chosen for the comparison because they use different ap-proaches to the analysis of the banding patterns. Both systems have automatic band-finding options as well as molecular size estimation, similarity calculation, and cluster analysis features.
MATERIALS AND METHODS
Image analysis systems.The GelCompar program (version 3.1) program runs
under Microsoft Windows (version 3.1 or higher). The suggested minimum hardware configuration is a personal computer with an Intel 386 processor, 4 megabytes of random-access memory, 10 megabytes of free space on the hard disk, and a color monitor and a videocard with a minimum resolution of 256 colors. The program runs very slowly with this configuration, and in the present study it was installed on a Hewlett-Packard Vectra computer equipped with a 66-MHz 486 processor and 12 megabytes of random-access memory. A complete system, consisting of the software program, an image acquisition camera, UV and white light sources, a computer, and a printer, is available from Bio-Rad under the names Gel Doc 1000 and Molecular Analyst Fingerprinting Plus.
The BioImage system (version 3.2) runs on a Sun microcomputer equipped with a UNIX operating system. This system can be purchased complete with the software, an image acquisition camera, UV and white light sources, a computer, and a printer.
Experimental setup. A mixture of adenovirus type 2 BamHI-EcoRI DNA
fragments and StuI fragments of phagelwas used as a reference standard and molecular size marker throughout the study. The mixture was prepared as fol-lows. An adenovirus DNA fragment suspension was made by mixing 2.6ml of adenovirus BamHI-EcoRI fragments (ca. 0.9mg; IBI, New Haven, Conn.) with 22ml of gel loading buffer (50% sucrose and 0.25% bromophenol blue in 100 mM Tris–90 mM boric acid–1 mM EDTA, pH 8.0 [TBE]) and 75.4ml of 10 mM Tris–1 mM EDTA buffer, pH 8.0. The phagelfragment stock solution was prepared by digesting 1mg of phagel(Boehringer Mannheim, Indianapolis, Ind.) with StuI (Gibco/BRL, Gaithersburg, Md.) in a 20-ml volume in accordance with the instructions of the manufacturer of the restriction enzyme before adding 22ml of gel loading buffer and 58ml of 10 mM Tris–1 mM EDTA buffer, pH 8.0. The final adenovirus-lfragment solution was prepared by mixing 70ml of the adenovirus DNA with 56ml of the StuIlfragment solution. Eighteen microliters of this mixture was loaded onto the gel in each standard lane.
In the first part of the study, EcoRI (Gibco/BRL) and StyI (Gibco/BRL) * Corresponding author. Mailing address: Department of
Gastroin-testinal Infections, Statens Seruminstitut, Artillerivej 5, DK-2300 Copenhagen S, Denmark. Phone: (45) 32 68 37 98. Fax: (45) 32 68 38 73. E-mail: [email protected].
1318
on May 15, 2020 by guest
http://jcm.asm.org/
digests of phagelwere placed between the standards in two gels (gels I and II) to test the accuracy of the molecular size determinations of the systems. The solutions of theselfragments were prepared by digesting 2-mg amounts of phage
lDNA separately with each enzyme, in accordance with the manufacturer’s instructions, in a volume of 40ml. After digestion, 44ml of gel loading buffer and 116ml of 10 mM Tris–1 mM EDTA buffer, pH 8.0, were added to each digestion tube. Ten microliters of each solution was applied to each lane. In one of the gels (gel II), a heavy load of HindIII (Gibco/BRL) phagelfragments was placed in two lanes instead of the EcoRI fragments to create distortion of the migration of the fragments in the adjacent tracks in the gel. This solution was threefold more concentrated than the solutions with the EcoRI and StyI fragments. In the second part of the study, the abilities of the software programs to analyze the more complex restriction patterns of DNA from 18 isolates of Listeria monocytogenes were determined (Table 1). For this REA typing procedure, genomic DNA was purified by the method of Graves and Swaminathan (2). It was digested with HhaI (Gibco/BRL) in accordance with the manufacturer’s instructions and elec-trophoresed in two gels (gels III and IV) with a reference standard in every third or fourth lane. The DNA of five isolates was run in both gels.
Electrophoresis was done in 0.65% SeaKem agarose (FMC BioProducts, Rockland, Maine) or ultrapure agarose (Gibco/BRL) in 13TBE buffer, pH 8.0, in a Horizon 20.25 electrophoresis chamber (Gibco/BRL) at approximately 2 V/cm overnight in TBE at ambient temperature. In the experiment with L. monocytogenes DNA, the electrophoresis was done with circulation of the elec-trophoresis buffer. After elecelec-trophoresis, the gels were stained with ethidium bromide (10 mg/liter) and photographed on a UV table, using a Polaroid camera and Polaroid negative black and white film 667. For computer analysis, all images were scanned on a light table, using a BioImage camera and an earlier version of BioImage software (3.0). In contrast to BioImage version 3.2, the older version generates uncompressed TIFF files that may be read by the GelCompar soft-ware. The images in TIFF format were transferred to an MS-DOS-formatted diskette for analysis by the GelCompar program. A resolution of 1,024 by 1,024 pixels was used for image acquisition. The normalization settings in GelCompar were as follows: a resolution of 400 points, a smoothing factor of 3 (each data point was averaged with one point on each side), and background subtraction by the rolling disc method with a setting of 12 as recommended by the manufacturer of RFLP gels. Bands were identified by the band search features of both systems. The sensitivity of the band search feature was set so that all bands present were identified by both systems. With these settings, some artifacts on the images were identified as bands; these were manually deleted. In the pattern recognition part of the study, only bands in the size range between 3.5 and 14.3 kb were analyzed. No strain’s DNA contained a band larger than 8.4 kb. The positions of bands smaller than 3.5 kb could not be reliably ascertained because the bands in this region were not completely resolved. All molecular size marker bands in the reference lanes were included in the calculation of the sizes of the bands in the test lanes. This was done to determine the sizes of the bands in the test lanes by interpolation from the reference lane data. The “robust” method in BioImage and the “spline fitting” method in GelCompar were used for interpolation in the molecular size determination procedure. Neither of these methods produces reliable results if the sizes of bands in the test lanes are outside the range of the bands in the reference lanes; i.e., the methods do not work well with
extrapola-tion. For pattern recognition, the optimization feature, a track-to-track align-ment feature that recognizes small global shifts (up to 4% migration differences) in similar normalized patterns that are not perfectly aligned, was enabled in GelCompar. A similar feature is not present in BioImage. Similarities between patterns were determined by generating dendrograms. The Dice similarity coefficient (similarity coefficient 2 in BioImage) (1) was used, and the pat-terns were clustered by the unweighted pair group method using arithmetic averages (UPGMA). The influence of using different numbers of lanes contain-ing molecular size markers on a gel was ascertained by comparcontain-ing the gels on which all marker lanes were used with the same gels on which the two outermost marker lanes only were used.
RESULTS
A gel with reference molecular size standards as well as
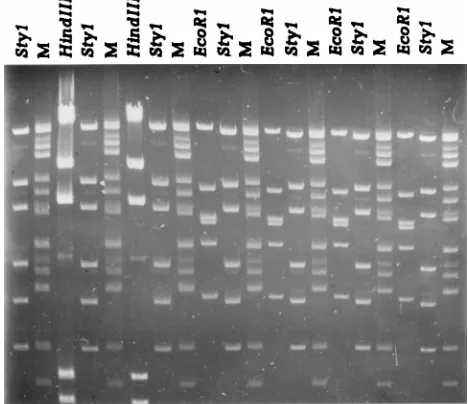
EcoRI, StyI, and HindIII phagelfragments is shown in Fig. 1. The average molecular sizes (both the observed values and their percentages of the expected values) and the associated standard deviations (both the determined values and their per-centages of the observed average molecular sizes) for the StyI and EcoRI lfragments are shown in Table 2. The two pro-grams estimated the molecular sizes with nearly the same pre-cision. The average size calculated for each fragment was within 2% of the actual size of the fragment, except for the largest StyI fragment, which by BioImage was estimated to have a size 2.9% smaller than expected. The standard devia-tions for fragments of less than 7,743 bp were less than 1% of the calculated average sizes, except for the two smallest StyI fragments, which by BioImage were 1.1 and 2.5%, respectively, of the calculated average molecular sizes. By both systems, the standard deviations for the two largest fragments were be-tween 1.7 and 3.2% of their calculated average sizes. Because of this, the position tolerance (the maximum positional devia-tion between two identical fragments run in different lanes) was set to 0.5% with an increase of 1.75% in GelCompar, corresponding to a 3% deviation in molecular weight through-out the gel for the pattern comparison portion of the study. Likewise, the deviation in BioImage was set at 3% throughout the gel.
[image:2.612.310.544.73.275.2]FIG. 1. A distorted gel (gel II) containing molecular size markers (M) and EcoRI, StyI, and HindIII fragments of phagel. The distortion was created by overloading the lanes with the HindIII phagelfragments and by electrophores-ing without recirculation of the buffer. The molecular size standard is a mixture of adenovirus type 2 BamHI-EcoRI fragments and StuI phagelfragments. From the top, the sizes of the fragments are 21.4, 19.0, 14.3, 12.4, 10.7, 7.9, 7.0, 6.2, 5.9, 4.7, 4.3, 4.0, 3.7, and 2.7 kb.
TABLE 1. Information on the clinical isolates of L. monocytogenes whose DNA was used in the pattern recognition portion of the study
Isolate no. Epidemiologicalorigin Serotype REA pattern
1 Sporadic 1/2b F
2 Outbreak 1 1/2b A
3 Outbreak 1 1/2b A
4 Outbreak 2 1/2b G
5 Outbreak 2 1/2b G
6 Outbreak 2 1/2b G
7 Outbreak 2 1/2b G
8 Outbreak 2 1/2b G
9 Outbreak 2 1/2b G
10 Outbreak 2 1/2b G
11 Outbreak 2 1/2b G
12 Outbreak 2 1/2b G
13 Sporadic 1/2b B
14 Outbreak 2? 1/2b G
15 Cluster 1a 1/2a D
16 Cluster 1 1/2a C
17 Cluster 1 1/2a E
18 Cluster 1 1/2a E
aSuspected to be part of an outbreak based on demographic epidemiological data.
on May 15, 2020 by guest
http://jcm.asm.org/
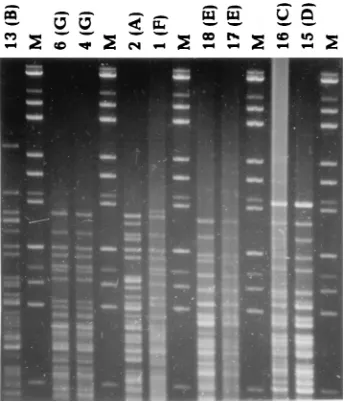
The results of the pattern recognition study are shown in Fig. 2 to 5. Figure 2 shows HhaI-digested genomic DNA of strains of L. monocytogenes. The effect of circulation of the electrophoresis buffer can be judged by comparing this figure with Fig. 1. There is no “smiling” effect in the gel run with circulation of the buffer (Fig. 2), while there is a pronounced smiling in the gel run without buffer circulation (Fig. 1). The molecular size standards also show better separation in Fig. 2 than in Fig. 1. In Fig. 3, the clustering of the RFLP patterns of the bacterial isolates, thelfragments, and the molecular size marker fragments by GelCompar is shown. All marker lanes were used for normalization in this experiment. One of the marker lanes in one of the gels with the clinical-strain DNA was used as a reference standard in the normalization proce-dure. All patterns were correctly identified in this figure. The corresponding dendrogram generated by BioImage for the same patterns is shown in Fig. 4. The clustering of patterns by BioImage was less satisfactory than that obtained with GelCompar. The BioImage software matched the l -frag-ment patterns with the 3% deviation window setting. When rerun on gel IV, isolates 6 and 2 were not clustered with 100% similarity to their run on gel III. The patterns of isolates 15 and 16 were falsely judged to be identical; they differ in the position of a single band in the region between 3.6 and 4 kb (Fig. 3). However, the overall clustering was similar in BioImage and GelCompar. Figure 5 shows the clustering of the RFLP patterns of all isolates studied, alllfragments, and the molecular weight marker fragments by GelCompar after nor-malization had been performed with only the outermost mo-lecular size marker lanes. Compared to Fig. 3, for which nor-malization was optimal, the dendrogram in Fig. 5 is much more branched. This effect is seen only in the patterns in the gels with the most pronounced smiling effect, i.e., the two gels with the EcoRI, StyI, and HindIIIlfragments. Inclusion of a third molecular weight marker lane in the middle of the smiling gels improved the results substantially but without reaching the level of perfection attained when all marker lanes were included in the calculation (data not shown). Similar results were found when only the two outermost standards in each gel were used for analysis of the data by BioImage (data not shown).
DISCUSSION
RFLP pattern analysis software programs enable investiga-tors to compare large numbers of complex patterns in a short period of time. The programs in this study use different ap-proaches to compensate for differences in run length and smil-ing of the gels. Before analysis can be performed with GelCompar, the patterns have to be normalized. In this pro-cess, a lane containing a standard profile is selected as a ref-erence. This standard should also be present in all other gels. The standards are then compressed or stretched to match the profile in the reference lane as closely as possible. The test profiles in between are normalized by interpolation to the nearest standard lanes. The normalized profiles are saved and used for future analyses; information on the sizes of the bands in the standards is not required. With BioImage, all patterns are compared as molecular sizes based on molecular size
mark-FIG. 2. HhaI restriction fragments of DNA from isolates of L. monocytogenes (gel IV). The molecular size standards are as described in the legend to Fig. 1. The identification numbers of the L. monocytogenes isolates are indicated at the top with their REA pattern designations in the parentheses. The gel was elec-trophoresed with recirculation of the running buffer.
TABLE 2. Sizes of EcoRI and StyI fragments of phagelcalculated by BioImage and GelCompara
Actual fragment size (bp)
BioImage data GelCompar data
Fragment generated by: Average size
observedb SDc Average sizeobservedb SDc
21,226 20,968 (98.8) 530 (2.53) 20,928 (98.6) 356 (1.70) EcoRI
19,329 18,771 (97.1) 597 (3.18) 19,378 (100.3) 519 (2.68) StyI
7,743 7,655 (98.9) 43 (0.56) 7,707 (99.5) 46 (0.60) StyI
7,421 7,375 (99.4) 26 (0.36) 7,414 (99.9) 34 (0.46) EcoRI
6,223 6,138 (98.6) 41 (0.67) 6,142 (98.7) 19 (0.31) StyI
5,804 5,763 (99.3) 28 (0.48) 5,767 (99.4) 20 (0.34) EcoRI
5,643 5,561 (98.6) 19 (0.34) 5,585 (99.0) 22 (0.39) EcoRI
4,878 4,788 (98.2) 16 (0.33) 4,805 (98.5) 18 (0.38) EcoRI
4,254 4,177 (98.2) 14 (0.34) 4,195 (98.6) 21 (0.49) StyI
3,530 3,482 (98.6) 14 (0.40) 3,536 (100.2) 16 (0.44) EcoRI
3,472 3,404 (98.0) 37 (1.09) 3,435 (98.9) 16 (0.45) StyI
2,690 2,714 (100.9) 68 (2.50) 2,672 (99.3) 8 (0.30) StyI
aThe EcoRI fragments were run 11 times, and the StyI fragments were run 13 times.
bThe numbers in parentheses denote the observed sizes as percentages of the actual sizes of the fragments. cThe numbers in parentheses denote the standard deviations as percentages of the average observed sizes.
on May 15, 2020 by guest
http://jcm.asm.org/
[image:3.612.342.515.482.683.2]ers in each gel. A process like the normalization procedure in GelCompar is not needed with BioImage. Thus, GelCompar compares differences in positions, i.e., run lengths, on the gels rather than differences in molecular sizes, the approach used by BioImage.
Both software programs allow storage of the patterns in one or more databases in a computer so that a new pattern can be compared with existing patterns in the database(s). This is particularly useful for tracking specific subtypes of bacteria in epidemiological studies. The two software programs evaluated in this study have several features (e.g., band finding, lane comparison, etc.) that allow many of the tedious and time-consuming steps in pattern analysis to be automatically per-formed with one or a few keystrokes. Also, they have powerful built-in data analysis features and can generate reports in sev-eral formats. Both programs have lane-matching features that will report the total number of bands as well as the number of
matched and unmatched bands. This feature is useful for dis-criminating between unrelated strains; however, the analyst should visually confirm the band-matching results from the programs. Both programs require the analyst to make critical decisions during the various steps in pattern normalization and in selecting the parameters used for analysis and matching of patterns. The analyst needs to become familiar with various features of each program before he or she can obtain the best results. The GelCompar program has several methods of align-ing positions on the reference patterns (identified by the op-erator) within a gel with each other and with a previously chosen reference standard. In our experience, the automatic association methods often produce incorrect alignments and require operator input to make corrections and to align posi-tions appropriately. The BioImage system also has an auto-matic alignment feature to align identical fragments of refer-ence standards in different lanes on a gel. This alignment feature may not perform satisfactorily if the rates of migration of fragments in different lanes are significantly different (smil-ing effect). The program draws a horizontal line through iden-tical bands in the reference lanes. These lines can be adjusted manually by the operator as needed to improve the alignments. These adjustments must be made correctly or molecular sizes will not be determined accurately. The BioImage software pattern matches are determined on the basis of molecular size values. The GelCompar program does not use computed mo-lecular sizes of bands for matching but rather uses normalized positions. The normalization process in GelCompar is quite time-consuming for the newcomer, whereas the molecular size estimation by BioImage is straightforward.
With both of these software programs, the molecular size estimates for the majority of the test fragments were within 98% of their actual sizes. The standard deviations for the molecular weights of the large fragments were larger than those for the smaller fragments. This was to be expected be-cause the bands from the larger fragments were broader than the bands from the smaller fragments. Both software programs choose the most intense point in each band as the position of the band.
[image:4.612.96.499.68.214.2]Many scientists routinely place molecular weight standards in only the outermost lanes in their gels. Based on the results of the present study, this practice needs to be reevaluated since it is very difficult to avoid smiling or other types of distortion in every gel. More highly branched dendrograms were obtained
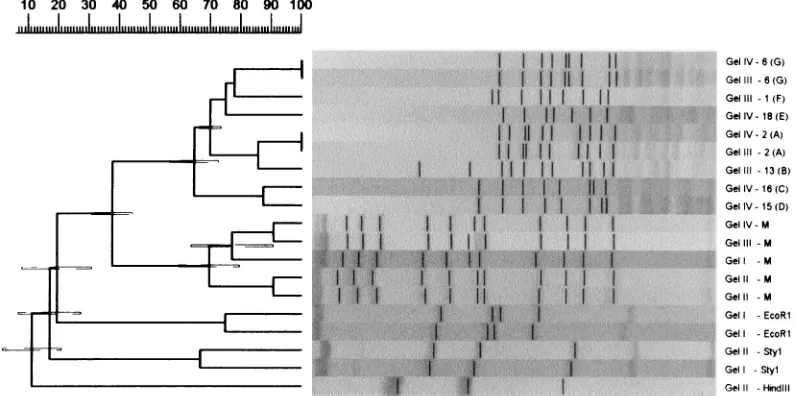
FIG. 3. A GelCompar-generated UPGMA clustering dendrogram with error flags and corresponding normalized restriction profiles. Only visually unique patterns and patterns identified as being different by BioImage (Fig. 4) are shown. Normalization was done using all molecular standards in all gels. The clustering was based on the bands enhanced in the figure. The Dice similarity coefficient was used, and the optimization feature was enabled. On the right, the gel numbers and the sources of the profiles are indicated. The pattern designations of the Listeria restriction profiles are indicated in the parentheses. The scale at the top of the figure shows percent similarity. M, molecular size markers.
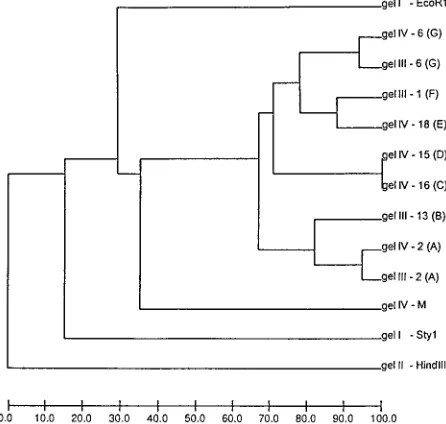
FIG. 4. The BioImage-generated UPGMA clustering dendrogram corre-sponding to the GelCompar dendrogram shown in Fig. 3. The scale at the bottom of the figure shows percent similarity. M, molecular size markers.
on May 15, 2020 by guest
http://jcm.asm.org/
[image:4.612.58.281.486.698.2]with both software programs when only outer-lane standards were used. Somewhat less branching was seen when three lanes were used for standards. Smiling may be partly avoided if the buffer is recirculated during electrophoresis. However, it is very difficult to avoid gel distortion caused by small differences in the amount of DNA loaded in each lane. The normalization process may be improved by placing the same strain (“stan-dard” strain) in different positions on each gel. An ideal frag-ment analysis system generates variable as well as invariant bands. Invariant bands may serve as internal controls and help correct for gel distortions.
In this study, with the deviation percentage used, the Bio-Image software did not cluster isolates 6 and 2 with 100% similarity when they were run on two different gels. Two iso-lates, 15 and 16, which differed from each other in the position of a single band in the 3.6- to 4.0-kb range, were falsely judged to be identical. BioImage does some proofreading of the band matching if the bands compared are within the size deviation set by the user. This did not work with the size deviation chosen in this study (3%). Deviations of 2.5, 3.5, and 4% gave similar results (data not shown). If the deviation was set to 2%, BioImage correctly judged the profiles of strains 15 and 16 to be different. However, the profiles of the aforementioned two strains (6 and 2) run on different gels were still misinterpreted as being different when this setting was used (data not shown). These problems were not seen with GelCompar when the optimization feature was enabled. If this feature was disabled, a dendrogram similar to the BioImage dendrogram was ob-tained (data not shown). The overall relationships of the pat-terns analyzed were identical for the two programs and similar to the one expected from visual inspection of the gels. In GelCompar, dendrograms with error flags at the branchings (standard deviations with respect to the similar-ity matrix for each branch) may be produced (Fig. 3 and 5). This feature is not present in BioImage. The two RFLP pattern analysis software programs performed almost equally well in determining molecular weights from stan-dards present in each gel and in recognizing relationships between banding patterns.
The development of computer programs for automated
analysis of DNA RFLP patterns has made it possible to per-form sophisticated comparisons of a large number of complex patterns. However, the programs are not completely automatic but require the user to make critical decisions that affect the way in which the analysis is done and the final results. Simi-larly, the results of a very distorted gel cannot be corrected by any computer program. It is extremely important to verify the results of all computerized RFLP pattern analyses. This in-cludes visual comparisons of the number of bands in a lane with the bands found automatically by the software programs. It may be useful to include DNA from at least two identical strains on each gel to verify the ability of the software to recognize identical patterns at the chosen settings. It should be stressed that computer programs may be used as an aid in the analysis of complex banding patterns; they do not provide an undisputably correct analysis.
In conclusion, the two programs evaluated in this study per-formed well. Of the two programs evaluated, BioImage was the easier to use. The version of BioImage evaluated in this study was written for UNIX-based computers; since this study was undertaken, BioImage Corporation has released a version of its software that is designed for Microsoft Windows (3.1 and later versions). This version is reported to have most of the features of the UNIX-based software. The GelCompar pro-gram software is designed for Microsoft Windows (3.1 and later versions) and has some useful features, like optimization of profiles and error flags on the similarity dendrograms, not present in BioImage. GelCompar is not as easy to work with as BioImage, but it performed slightly better than the latter pro-gram in the present study.
[image:5.612.100.499.72.270.2]In the present paper, we have considered a few important features that are common to most image analysis systems. When considering the purchase of such a program, additional features may be important. These include statistical, combin-ing, printcombin-ing, exportcombin-ing, and program linkage capabilities. The two image analysis programs we have tested will not fulfill the requirements of all laboratories. These software packages are usually priced at approximately $6,000 (U.S.) for a single-user version. Thus, before you decide on a purchase, insist
FIG. 5. A GelCompar-generated UPGMA clustering dendrogram with error flags and corresponding normalized restriction profiles. Normalization was done with only the outermost standards in each gel, and only profiles identified by the software as being different are shown. All parameters and designations used are as described in the legend to Fig. 3. The scale at the top of the figure shows percent similarity. M, molecular size markers.
on May 15, 2020 by guest
http://jcm.asm.org/
on a free trial period to test the system thoroughly before you buy it.
REFERENCES
1. Dice, L. R. 1945. Measures of the amount of ecologic association between species. Ecology 26:297–302.
2. Graves, L. M., and B. Swaminathan. 1993. Universal bacterial DNA isolation procedure, p. 617–621. In D. H. Persing, T. F. Smith, F. C. Tenover, and T. J. White (ed.), Diagnostic molecular microbiology: principles and applications. American Society for Microbiology, Washington, D.C.
3. Graves, L. M., B. Swaminathan, M. W. Reeves, S. B. Hunter, R. E. Weaver,
B. D. Plikaytis, and A. Schuchat.1994. Comparison of ribotyping and
mul-tilocus enzyme electrophoresis for subtyping of Listeria monocytogenes iso-lates. J. Clin. Microbiol. 32:2936–2943.
4. Martin, C., M. A. Ichou, P. Massicot, A. Goudeau, and R. Quentin. 1995. Genetic diversity of Pseudomonas aeroginosa strains isolated from patients with cystic fibrosis revealed by restriction fragment length polymorphism of the rRNA gene region. J. Clin. Microbiol. 33:1461–1466.
5. Schmid, J., Y. P. Tay, L. Wan, M. Carr, D. Parr, and W. McKinney. 1995. Evidence for nosocomial transmission of Candida albicans obtained by Ca3 fingerprinting. J. Clin. Microbiol. 33:1223–1230.
6. Swaminathan, B., and G. M. Matar. 1993. Molecular typing methods, p. 26–50. In D. H. Persing, T. F. Smith, F. C. Tenover, and T. J. White (ed.), Diagnostic molecular microbiology: principles and applications. American Society for Microbiology, Washington, D.C.
7. van Belkum, A., J. Kluytmans, W. van Leeuwen, R. Bax, W. Quint, E. Peters,
A. Fluit, C. Vandenbroucke-Grauls, A. van den Brule, H. Koeleman, W. Melchers, J. Meis, A. Elaichouni, M. Vaneechoutte, F. Moonens, N. Maes, M.
Struelens, F. Tenover, and H. Verbrugh. 1995. Multicenter evaluation of
arbitrarily primed PCR for typing of Staphylococcus aureus strains. J. Clin. Microbiol. 33:1537–1547.
8. Yang, Z. H., I. Mtoni, M. Chonde, M. Mwasekaga, K. Fuursted, D. S.
Askgård, J. Bennedsen, P. E. W. de Haas, D. van Soolingen, J. D. A. van
Embden, and Å. B. Andersen.1995. DNA fingerprinting and phenotyping of
Mycobacterium tuberculosis isolates from human immunodeficiency virus (HIV)-seropositive and HIV-seronegative patients in Tanzania. J. Clin. Mi-crobiol. 33:1064–1069.