© 2015, IRJET.NET- All Rights Reserved
Page 715
ANALYZING GUIDANCE INFORMATION USING RANDOM FORESTS FOR
THERAPEUTIC IMAGE SEGMENTATION PROCESS
*1
Mrs. Indumathi D , *
2Ms. Shahin A
*1
M.Phil Research Scholar, Department of Computer Science Auxilium College (Autonomous), Vellore,
TamilNadu, India
*2
Assisant Professor, Department of Computer Science Auxilium College (Autonomous), Vellore,
TamilNadu, India
---***---Abstract
- Labeled training data be used forchallenging medical image segmentation problems to learn different characteristics of the relevant domain. The Random Forest (RF) classifiers and their learned knowledge during training and ways to exploit it for improved image segmentation. Apart early learning discriminative features, RFs also quantify their importance in classification. Feature importance is use to design a feature selection strategy critical for high segmentation and classification accuracy, and also to propose a efficiency cost in a second-order MRF framework for graph cut segmentation. The cost function combines the contribution of different image skin texture like intensity, texture, and curving information. Experimental outcome on medical images show that this strategy leads to better segmentation accuracy than conventional graph cut algorithms that use only intensity information in the smoothness cost.
Key Words:
Medical image segmentation, ActiveAppearance Models, Random Forest (RF) classifiers Texture, Curvature.
I. INTRODUCTION
Medical image segmentation is challenging due to image modality, organ type and segmentation framework. The task is further complicated by varying scanner parameters from different modalities, low resolution, and image noise in many cases poor contrast. Two very popular approaches for medical image segmentation are active contour, and graph cuts. Initial works using these methods primarily relied on low level image information like intensity, texture and edge information to segment the target organ. However, image features alone were not sufficient for an accurate segmentation which fostered the
exploration of ways to include prior knowledge from training datasets. Subsequently many works started incorporating prior shapes and statistical information into level sets and graph cut segmentation.
Another approach of exploiting training data is to learn image features that distinguish between organ and background structures as in Active Appearance Models (AAMs) and Active Shape Models (ASMs). In this work we propose a method that analyses the training process of Random Forest (RF) classifiers, and uses the learned knowledge to devise feature selection strategies and in segmenting medical images. Most methods for RF based segmentation use only the probability maps to segment the desired organ. Further, while imposing smoothness constraints they use only intensity information. However, RFs can provide much more knowledge from the training procedure. RFs allow us to examine the training procedure and quantify the importance of different features to the classification task. This knowledge is useful in many ways like designing an appropriate smoothness cost, or improved feature selection that could lead to higher segmentation accuracy.
© 2015, IRJET.NET- All Rights Reserved
Page 716
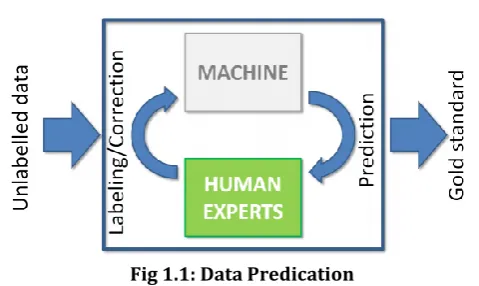
Fig 1.1: Data PredicationSince medical imaging became digital, machine learning can play a crucial role to support early diagnosis of cancer. The last decade, a lot of learning-based techniques have emerged, most of them based on a two-phases framework (1) Detection and/or segmentation of abnormalities, (2) Classification of the detected abnormality into benign or malignant.
II. Related work
To Shape prior segmentation method using graph cuts capable of segmenting multiple objects. The shape prior energy is based on a shape distance popular with level set approaches. We also present a multiphase graph cut framework to simultaneously segment multiple, possibly overlapping objects [3]. The multiphase formulation differs from multi way cuts in that the former can account for object overlaps by allowing a pixel to have multiple labels. We then extend the shape prior energy to encompass multiple shape priors. Unlike variation methods, a major advantage of our approach is that the segmentation energy is minimized directly without having to compute its gradient, which can be a cumbersome task and often relies on approximations. Experiments demonstrate that our algorithm[1], The Mumford-Shah functional and its cartoon limit which facilitates the incorporation of a statistical prior on the shape of the segmenting contour. By minimizing a single energy functional, we obtain a segmentation process which maximizes both the grey value homogeneity in the separated regions and the similarity of the contour with respect to a set of training shapes[1]. We propose closedForm, parameter-resolution for incorporating invariance with respect to similarity transformations in the variation framework. We show segmentation results on artificial and real-world images with and without prior shape information. In the cases of noise, occlusion or strongly cluttered background the shape prior significantly improves segmentation [2].
2.1.Profile Based Personalization
Previous works on profile-based PEL mainly focus on improving the search utility. The basic idea of these works is to tailor the search results by referring to, often implicitly, a user profile that reveals an individual information goal. In the remainder of this section, we review the previous solutions to PEL on two aspects, namely the representation of profiles, and the measure of the effectiveness of personalization.
Many profile representations are available in the literature to facilitate different personalization strategies. Earlier techniques utilize term lists/vectors or bag of words to represent their profile. However, most recent works build profiles in hierarchical structures due to their stronger descriptive ability, better scalability, and higher access efficiency.
2.1. Variation Integration of Shape Statistics and Segmentation
The combine image information and previously acquired shape information in one variation framework. For a given contour C we define energy. The functional Ei measures how well the contour and the associated segmentation u approximate the input grey value information. Ec favors contours which are familiar from a learning process. The parameter α allows to define the relative weight of the
prior. In the propose for Ei a modification of the Mumford-Shah functional and its cartoon limit, which facilitates a parameterization of the contour as a closed spine curve. Shape learning and shape statistics are then conveniently defined on the distribution of spline control points.
2.2. Interactive Graph Cut Based Segmentation with Shape Priors
© 2015, IRJET.NET- All Rights Reserved
Page 717
shape priors within this framework mitigates theseproblems.
III. PREVIOUS IMPLEMENTATIONS
Random Forests are an ensemble learning method (also thought of as a form of nearest neighbor predictor) for classification and regression that construct a number of decision trees at training time and outputting the class that is the mode of the classes output by individual trees (Random Forests is a trademark of Leo Bremen and Adele Cutler for an ensemble of decision trees). Random Forests are a combination of tree predictors where each tree depends on the values of a random vector sampled independently with the same distribution for all trees in the forest. The basic principle is that a group of “weak learners” can come together to form a “strong learner”. Random Forests are a wonderful tool for making predictions considering they do not over fit because of the law of large numbers. Introducing the right kind of randomness makes them accurate classifiers and repressors.
The Random Forests algorithm was developed by Leo Bremen and Adele Cutler
1. If the number of cases in the training set is N, sample N cases at random but with replacement, from the original data. This sample will be the training set for growing the tree.
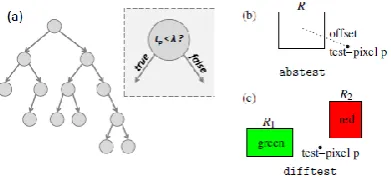
[image:3.595.60.256.606.702.2]2. If there are M input variables, a number M is specified such that at each node, m variable are selected at random out of the M and the best split on these m is used to split the node. The value of m is held constant during the forest growing. Each tree is grown to the largest extent possible. There is no pruning..
Fig 1.2 Decision Tree
IV. SYSTEM IMPLEMETNATION
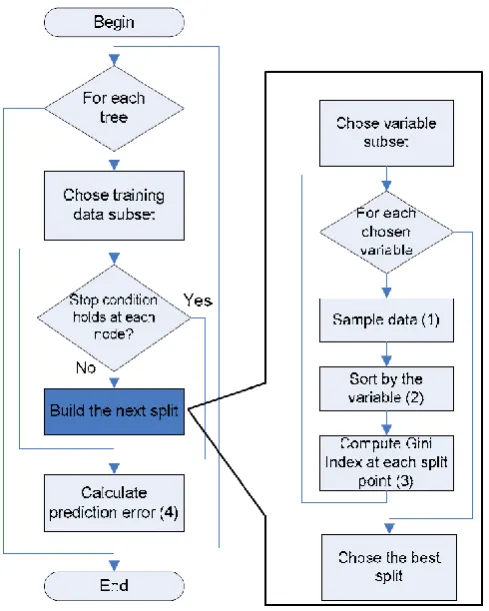
At each node N l of the tree Ft, a splitting function fl permits to split the subset S l of the training set arriving in this node. As detailed in the previous section, the goal of node optimization is to find the best splitting function according to a predefined objective function. In classification tasks, several objective functions have been proposed that mostly aim at reducing the class uncertainty. In the following, we will define the most popular which the Information Gain is and a variant based on the Gain impurity. Information gain measures the difference between the class uncertainty before and after the splitting. A common measure of uncertainty is the so-called Shannon’s entropy which is defined for discrete random variables as follows:
The random forests algorithm (for both classification and regression) is as follows:
1. Draw tree bootstrap samples from the original data.
2. For each of the bootstrap samples, grow an un pruned classification or regression tree, with the following modification: at each node, rather than choosing the best split among all predictors, randomly sample m try of the predictors and choose the best split from among those variables. (Bagging can be thought of as the special case of random forests obtained when m try = p, the number of predictors).
3. Predict new data by aggregating the predictions of the n tree trees (i.e., majority votes for classification, average for regression). An estimate of the error rate can be obtained, based on the training data, by the following:
1. At each bootstrap iteration, predict the data not in the bootstrap sample (what Breiman calls “out-of-bag”, or OOB, data) using the tree grown with the bootstrap sample.
© 2015, IRJET.NET- All Rights Reserved
Page 718
Fig 1.3: Random Forest Algorithm4.1 Image Features
This section describes the features used in our method - intensity statistics, texture and curvature anisotropy, and spatial context features. Context features are a combination of intensity, texture and curvature values sampled using a template. ROI identification requires classification of super pixels for which we use intensity, texture and curvature features, (excluding context information) to ensure fast feature extraction and subsequent classification, as well as good generalization of the classifier. For generating ROI probability maps we employ the complete set of features (including context information).
4.2 Intensity Statistics
It is not always easy to identify the edges of the RV blood pool and surrounding myocardium wall. Psychophysical experiments have established that the human visual system (HVS) is sensitive only to image features of the first and second order (mean and variance). However, MR images commonly contain regions that do not form distinct spatial patterns but differ in their higher order statistics, e.g. boundaries of some malignant tumors are diffuse and invisible to the naked eye. we propose to
investigate features that are not discernible by the human eye but may provide discriminating information for our task. For every sub-region (super pixel or pixel neighborhood) we calculate the mean, variance, skewness and kurtosis of the intensity values.
4.3 Texture Anisotropy
Texture is modeled as patterns distinguished by a high concentration of localized spatial frequencies. 2-D Gabor filter banks are used to generate texture maps for each image. Gabor filters have optimal joint localization in the spatial and frequency domains. Their multi-scale and multi orientation structure conforms to the receptive field profiles of simple cortical cells, and captures rich visual properties such as spatial localization, orientation selection and spatial frequency characteristics. Since Gabor filters incorporate Gaussian smoothing they are robust to noise.
Texture maps are partitioned into 9 equal parts corresponding to 9 sectors of a circle, and the entropy of texture values is calculated for each sector. More sectors led to fewer samples per sector which jeopardizes estimation of stable higher order statistics. Too few
4.4 Region of Interest Identification
ROI identification is an important part of our method because:
1) It reduces the total computation time since we need not classify each pixel; and
2) The ROI gives an initial selection of likely RV pixels and reduces false positives in subsequent analysis. Intensity in homogeneity correction was performed using the nonparametric non uniform intensity normalization (N3) method.
Denotes the probability distribution of curvature values in sector r, 0 denotes the curvature values. Similar to texture anisotropy, the curvature asymmetry measure is also a 9 dimensional feature vector for a region.
© 2015, IRJET.NET- All Rights Reserved
Page 719
4.5 Algorithm ImplementationAlgorithmic Analysis:
Generate the initial population of individuals
Calculate the fitness value for each individual in that population
Repeat on this generation until stop condition is met: (time limit, sufficient fitness achieved, etc.)
Select the best-fit individuals for reproduction
2Create new individuals by applying crossover and mutation operations
Evaluate the individual fitness of new individuals
Spatial Context Features:
Since the human anatomy displays a high degree of regularity with only moderate variations, presence of one organ provides a strong cue about the presence of another organ in medical images. Through appropriately designed features we aim to capture the contextual relationship between RV and other tissues in the image. Context features have been used to segment brain structures in MRI.
Fig1.4 (a) Sectors of circle for calculating texture and curvature anisotropy; (b) Sample locations for deriving context information
Prostate from CT and MR images, cardiac structures from MRI, localizing anatomical structures and segmenting the cardiac chamber. Basically context features derive information of one set of objects from another set of objects. Since contextual information depends on relative orientation and distance we sample regions at fixed positions from a pixel the circle center is the pixel in question and the sampled points are identified by a red ‘X’. At each point corresponding to a ‘X’ we extract a 5×5 region and calculate the mean intensity, texture and curvature values. The texture values were derived from the texture maps at 90◦ orientation and scale 1.
EVALUATION RESULT:
Probability maps and Graph Cut Segmentation
Probability maps are generated for all ROI pixels using a second set of RF classifiers. Approximately equal number of samples from RV and background pixels is taken from the training datasets. Intensity, texture, curvature and context features derived from these samples were used to train a RF classifier (different from the one trained on super-pixel features). The features were extracted from a 31 × 31 neighborhood of each pixel. The training set varies with each round of cross validation. The trained classifier is used to generate probability maps for every pixel within the identified ROI. Each pixel has 3 probability values corresponding to the blood pool, myocardium and background. The probability maps serve as penalty costs in a second order MRF cost function.
Figure 1.4: VOI Detection
© 2015, IRJET.NET- All Rights Reserved
Page 720
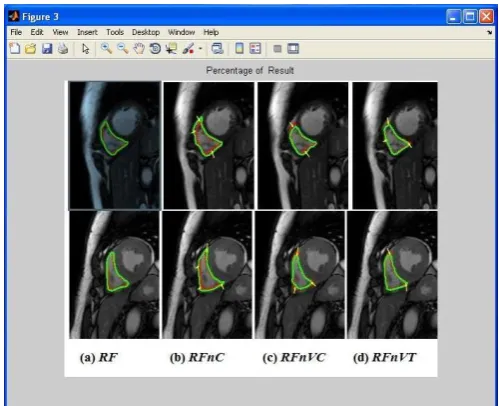
and curvature features. Note that context features were [image:6.595.267.557.81.402.2]not derived from super pixels.
Fig 1.5: RV Segmentation results (a) RF;(b) RFnC; (c)RFnVC ; and (d) RFnVT
EXPERIMENTS AND RESULTS
Cardiac MR Examinations were performed at 1.5T (Symphony Tim, Siemens Medical Systems, Erlangen, Germany) using a eight-element phased-array cardiac coil and repeated breath-holds of 10 − 15 s. A total of 8 − 12 contiguous cine short axis slices were performed. Sequence parameters were as follows: TR = 50 ms; TE = 1.7 ms; flip angle = 55; slice thickness = 7 mm; matrix size = 256×216; Field of view = 360−420 mm; 20 images per cardiac cycle; spatial resolution of 0.75mm/pixel. There were 32 datasets and we use a leave-one-out strategy to evaluate our method.
λ 10 5 1 0.5 0.1 0.0
1
0.0 2
0.00 1
D M
74. 2
74. 8
77. 2
80. 8
83. 7
84. 6
89. 6
89.7
Table 2 Change in segmentation accuracy with different values of λ (Eqn. 3).
N 300-600 600-900 900-1200
AccBP (%) 77.9±1.6 89.8±2.9 83.5±2.7
AccMyo (%) 75.1±2.8 88.5±2.3 80.8±3.2
[image:6.595.34.284.138.341.2]AccB (%) 74.7±2.8 89.3±2.8 80.0±2.7
Figure 6.4 Liver Segmentation Results
Figure 6.5 Performance of Random Forest
CONCLUSION
[image:6.595.306.557.448.637.2] [image:6.595.31.298.594.684.2]© 2015, IRJET.NET- All Rights Reserved
Page 721
classification accuracy. Hence we are able to quantify theimportance of different features to the classification task. These importance measures are used to design a smoothness cost for graph cut segmentation by weighing different features like intensity, texture and curvature according to their importance in classification. This strategy allows us to segment challenging cases where the desired organ in MR images has similar appearance to its surrounding regions. It results in higher segmentation accuracy than conventional graph cut approaches that use only intensity information in the smoothness cost. Thus we are able to weight different features automatically and avoid the shortcomings of ad-hoc weighting strategies. This knowledge is particularly useful when the number of samples is low when compared with the number of feature elements. In such a case the trained RF may not generalize well to novel samples. We can choose to discard those feature elements that have minimal influence on the classification performance. In doing so we can achieve better generalization of the RF in spite of very few samples.
REFERENCES:
1. M. Kass, A. Witkin, and D. Terzolpopulos, “Snakes: Active contour models,” Int. J. Comput. Vis., 1988. 2. Y. Boykov and G. Funka-Lea, “Graph cuts and
efficient N-D image segmentation,” Int. J. Comput. Vis., 2006.
3. M. Leventon, E. Grimson, and O. Faugeras, “Statistical shape influence in geodesic active contours,” in Proc. IEEE CVPR, Jun. 2000.
4. D. Cremers, F. Tischhauser, J. Weickert, and C. Schnorr, “Diffusion snakes: Introducing statistical
shape knowledge into the Mumford-Shah
functional,” Int. J. Comput. Vis. 2002.
5. N. Paragios, “A variation approach for the segmentation of the left ventricle in cardiac image analysis,” Int. J. Comput. Vis., 2002.
6. G. Slabaugh and G. Unal, “Graph cuts segmentation using an elliptical shape prior,” in Proc. IEEE ICIP, Sep. 2005,
7. D. Freedman and T. Zhang, “Interactive graph cut based segmentation with shape priors,” in Proc. IEEE CVPR, Jun. 2005.