© 2015, IRJET ISO 9001:2008 Certified Journal
Page 16
Aspects Regarding the Elastic Properties of Silicon and Its Influence on
the Behavior of Micro-Mechanical Components
Georgeta Ionascu
1, Adriana Sandu
2, Elena Manea
3, Lucian Bogatu
41
Professor, Mechatronics & Precision Mechanics Dpt., Politehnica University of Bucharest, Romania
2Professor, Strength Materials Dpt., Politehnica University of Bucharest, Romania
3
Dr., National Institute for Research & Development in Microtechnology of Bucharest, Romania
4Lecturer, Mechatronics & Precision Mechanics Dpt., Politehnica University of Bucharest, Romania
---***---Abstract -
A numerical simulation using FiniteElement Method (FEM) of the behavior of micro-beams from MEMS sensors is presented in this paper, in order to determine the natural frequencies and the vibration eigen modes. Multiple possibilities of modeling the elastic properties of silicon, the material from which the micro-beams are made, have been considered. The obtained results are compared with analytical values, using relationships of the Vibration Theory, and also with values experimentally determined. Influence of silicon Young’s modulus, estimated based on literature data and measured by nanoindentation, on resonant frequencies has been studied. The orthotrop behavior of silicon for such applications is highlighted.
Key Words:
Elastic Modulus, Structural Orthotropy,
Micro-beams, MEMS Sensors
1. INTRODUCTION
Micro-Electric-Mechanical Systems (MEMS) represent the integration between the mechanical elements such as sensors and actuators with electronic devices on the same silicon substrate, processed through microfabrication technologies.
In the MEMS sensor structure, are frequently found micro-cantilever beams, they being the simplest resonant sensing elements with applications, for example, in the Atomic Force Microscopy (AFM) field. Micro-cantilever [1] having a nano-sized tip vibrates and interacts with a surface due to the intermolecular forces.
The most commonly used material for making micro-beams in MEMS sensors is the silicon, an anisotropic material with different elastic properties depending on the crystalline directions and the manufacturing technology of the microstructure. That’s why the numerical simulation
of mechanical, static and dynamic, behaviour of these structures is difficult in terms of modeling the silicon elastic properties.
In this paper, a numerical simulation using FEM of the behaviour of micro-cantilever beams from MEMS sensors is performed to establish the natural frequencies and the vibration eigen modes of these micro-mechanical structures.
The silicon was modeled as an isotropic material with values of elastic Young’s modulus corresponding to the crystalline directions Si [100], [010], [001] – the coordinate axes of the cubic elementary cell (Ex = Ey = Ez).
The silicon was, also, modeled as an orthotropic material for Si [110], [
1
10
], [001], representing the crystalline directions in the plane of silicon wafer (parallel to the flat and perpendicular to the flat/ chamfer of alignment in the working devices) and, respectively, the perpendicular direction on the silicon wafer surface (Ex = Ey ≠ Ez).Influence of silicon Young’s modulus, estimated based on literature data and measured by nanoindentation, on resonant frequencies has been studied.
The obtained results have been compared with analytical values, using relationships of the Vibration Theory, and also with values experimentally determined through two methods, by Laser Doppler Vibrometry (LDV) on MSA-500 Micro System Analyzer (Polytec) and by AFM on Ntegra Scanning Probe Microscope (NT-MDT Co.).
2. MODELING OF SILICON AS AN ISOTROPIC
MATERIAL
© 2015, IRJET ISO 9001:2008 Certified Journal
Page 17
The considered structures [4] are presented in Fig -1. Themicro-cantilevers are obtained through micromachining
techniques [5] and are manufactured from
monocrystalline silicon, a material widely used in MEMS devices, due to its excellent mechanical properties and batch fabrication, compatible with micro-electronic components at low costs.
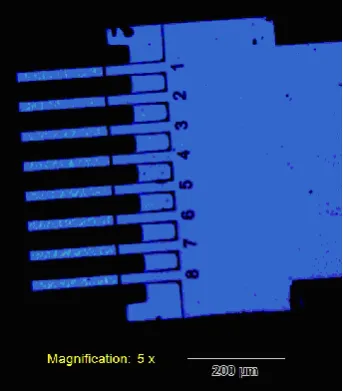
Fig -1: The studied microstructures (optical microscope image)
The microstructure under study in this paper has the geometry shown in Fig -2 and it is made from silicon with density ρ = 2330 kg/m3 and Poisson’s ratio ν = 0.22.
The micro-beam dimensions are length l = 727 μm (on the chip measured using a scanning electron microscope, also), width b = 90 μm and thickness t = 5 μm. For the Young’s modulus, two values have been considered:
a) E = 130 GPa, corresponding to Si (100); b) E = 169 GPa, corresponding to Si (111).
x
y
z
l
z
y
t
b
Fig -2: Sketch of the silicon micro-beam
2.1 Analytical Calculation of Natural Frequencies
For the bending modes, the resonance frequencies are computed with the following expression [6]:
A
EI
l
n
f
i i y
22
2
(1)where l is the length of the beam, E is the elastic modulus of the beam material, Iy is the inertia moment of the cross
section related to y-axis; ρ is the density of material, A is the cross-sectional area of the beam, ni are the coefficients
with specified values corresponding to the vibration modes. Values of ni are the followings: n1 = 1.875, n2 =
4.694, and n3 = 7.855, corresponding to the first, second
and the third vibration mode (bending). The torsion modes and the lateral one (in xy plane) have been analyzed only experimentally and through the finite element method (FEM), respectively.
2.2 Numerical Calculation of Natural Frequencies
A numerical simulation using FEM with SolidWorks 2011/COSMOS M software has been performed. The values of the first five natural frequencies and the corresponding vibration eigen modes have been determined. The calculation model is represented in Fig -3. The structure was considered as a mesh of 4000 elements of thin plate with 4 nodes per element (SHELL 4 model). 4221 nodes of interconnection have been resulted.
The obtained results for the two values of the elastic modulus are presented in Table -1, comparatively with the analytical ones. A good concordance between the values of natural frequencies for bending modes is observed. Using FEM, the torsion vibration modes, and also, the ones in plane of micro-beam, can be identified. The calculation model is thus validated.
Fig -3: The calculation model for numerical simulation
Table -1: Resonant frequency values, determined by analytical and numerical calculation for isotropic model (E from literature data)
Resonant frequency fi, kHz
Vibration
Mode EAnaly- = 130 GPa E = 169 GPa tical
method
FEM
Analy-tical method
FEM
f1 bending 11.413 11.467 13.010 13.074
f2 bending 71.533 71.83 81.559 81.900
f3 torsion - 187.48 - 213.760
f4 bending 200.316 201.24 228.390 229.458
[image:2.595.37.209.193.389.2]© 2015, IRJET ISO 9001:2008 Certified Journal
Page 18
3. EXPERIMENTAL STUDY
3.1 Experimental Determination of Natural
Frequencies
The obtained results by analytical calculation and numerical simulation have been compared with those experimentally determined through two methods: LDV and AFM.
The Polytec MSA-500 system has been used to determine the natural frequencies by LDV method, respectively through out of plane vibration measurement of the cantilevers’ surface [7]. The cantilevers chip is placed on a piezoelectric actuator, excited with a sinusoidal signal into frequency bandwidth starting from 1 Hz to 100 kHz, delivered by a function generator. Then, the user defines the scanning points and a laser beam is directed to the studied surface, following the previously defined grid. The vibration amplitude and frequency are determined using the Doppler shift of the reflected beam frequency due to the motion of the surface. The output of the laser-Doppler vibrometer is generally a continuous analog voltage that is directly proportional to the surface velocity component along the axis of the laser beam.
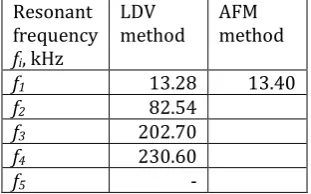
The experimental results are summarized in Table -2. By using this method, the in-plane vibration mode (the fifth vibration mode) cannot be observed. For the natural first mode fundamental frequency, the value of 13.28 KHz was determined.
This was validated through AFM method, employing the Ntegra Scanning Probe Microscope (NT-MDT Co.). The value of 13.4 KHz was determined, as an average value between two recorded values, 12.5 KHz and 14.3 KHz.
Table -2: Resonant frequency values, experimentally determined
Resonant frequency fi, kHz
LDV
method AFM method
f1 13.28 13.40
f2 82.54
f3 202.70
f4 230.60
f5 -
Comparing the numerical values with the experimental ones, it is observed that, at the first natural frequency, the error determined relative to the value measured by LDV is about 13.65% (for E = 130 GPa) and about 1.5% (for E = 169 GPa). Compared to the value measured by AFM, error is approximately 14.4% (for E = 130 GPa) and about 2.4% (for E = 169 GPa).
In conclusion, if an isotropic material model is adopted for silicon, the appropriate value for the elastic modulus is 169 GPa, corresponding to Si (111).
3.2 Measurement of Elastic Modulus by
Nanoindentation
Indentation involves pressingan indenter into the surface of a sample. Depth and surface area of indentation are correlated with sample hardness. Berkovich indenter is the most commonly used for measurements of nanomechanical properties.
In order to validate the simulation results, it has been necessary to measure the Young’s modulus of silicon cantilever. Nanoindentation, applied on the Nano Indenter G200 (Agilent Technologies) equipped with CSM (Continuous Stiffness Measurement) module, was used. Young’s modulus is calculated from the slope of curve corresponding to the indenter withdrawing, the unloading curve being always in the elastic region.
The resulted value for the elastic modulus was E = 173.7 GPa, close to corresponding value for Si (111). The obtained values for the first five natural frequencies are given in Table -3 and they are very close to the experimentally determined ones.
Table -3: Resonant frequency values, determined by numerical calculation for isotropic model (E measured by nanoindentation) and orthotropic model
Resonant frequency fi, kHz
Isotropic model (E measured by nanoindentation)
Orthotropic model (FEM)
f1 13.255 13.019
f2 83.039 81.580
f3 216.710 184.051
f4 232.270 228.410
f5 235.010 230.922
4. MODELING OF SILICON AS AN ORTHOTROPIC
MATERIAL
Because silicon is not an isotropic material, it was considered useful the numerical simulation for silicon as an orthotropic material, that is Si [110], [
1
10
], [001], representing the crystalline directions in the plane of silicon wafer (parallel to the flat and perpendicular to the flat/chamfer of alignment in the working devices) and, respectively, the perpendicular direction on the silicon wafer surface (Ex = Ey ≠ Ez). The numerical values taken incalculation are: Ex = Ey = 169 GPa; Ez = 130 GPa; νyz = 0.36;
νzx = 0.28; νxy = 0.064; Gyz = Gzx = 79.6 GPa; Gxy = 50.9 GPa.
[image:3.595.323.545.476.577.2] [image:3.595.84.240.561.658.2]© 2015, IRJET ISO 9001:2008 Certified Journal
Page 19
shown the shapes of the first four vibration modes and thecorresponding values of resonant frequencies, determined experimentally through LDV and calculated with FEM for orthotropic model.
a)
b)
Fig -4: The first vibration mode – bending a) experimentally through LDV (f1 = 13.28 kHz)
b) calculated with FEM (F_Mode 1 = 13.019 kHz; error 1.96%)
a)
b)
Fig -5: The second vibration mode – bending a) experimentally through LDV (f2 = 82.54 kHz)
b) calculated with FEM (F_Mode 2 = 81.58 kHz; error 1.16%)
a)
b)
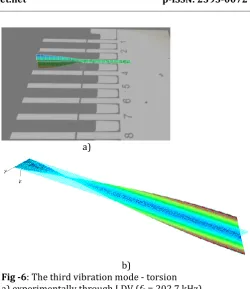
Fig -6: The third vibration mode - torsion a) experimentally through LDV (f3 = 202.7 kHz)
b) calculated with FEM (F_Mode 3 =184.051 kHz; error 9.2%)
a)
b)
Fig -7: The fourth vibration mode - bending a) experimentally through LDV (f4 = 230.6 kHz)
b) calculated with FEM (F_Mode 4=228.41 kHz; error 0.95%)
5. CONCLUSIONS
In numerical simulations of the dynamic behavior of
silicon microstructures under study, results
experimentally confirmed are obtained in two ways of describing the elastic properties of the material:
1. isotropic material with elastic modulus Ex = Ey = Ez =
[image:4.595.48.555.49.787.2] [image:4.595.307.558.72.362.2] [image:4.595.34.289.156.449.2] [image:4.595.306.558.399.613.2]© 2015, IRJET ISO 9001:2008 Certified Journal
Page 20
through nanoindentation (E = 173.7 GPa) on theactual structure;
2. orthotropic material with different values of the elastic properties, given in section 4.
It is noted that the obtained results for the natural frequencies are experimentally validated, errors being less than 3% in the case of the bending modes.
ACKNOWLEDGEMENT
The MSA-500 testing system was acquired by the
Politehnica University of Bucharest, National
Mechatronics Centre, in the frame of Microlab project – The expansion of the capabilities of Computer Assisted Testing Laboratory for Mechatronics Systems in the micromechatronics field – project financed through the Capacities program, module 4.
REFERENCES
[1] P. J. Cumpson, C. A. Clifford and J. Hedley, “Quantitative analytical atomic force microscopy: A cantilever reference device for easy and accurate AFM spring-constant calibration”, MEAS SCI
TECHNOL, vol. 15, pp. 1337-1346, Jul. 2004.
[2] M. A. Hopcroft, W. D. Nix and T. W. Kenny, “What is
the Young's Modulus of Silicon?”, J
MICROELECTROMECH S, vol. 19, pp. 229-238, April
2010.
[3] J. Kim, D. Cho and R.S. Muller, Why is (111) Silicon a
better mechanical material for MEMS?,
Transducers’01, Munich, Germany, 2001, vol.1, pp. 662-665.
[4] Micromotive Mikrotechnik, Duo - / Octosensis Micro Cantilever Arrays Datasheet.
[5] G. Ionascu, Technologies of Microtechnics for MEMS (in Romanian), CARTEA UNIVERSITARA, Bucharest, Romania, 2004.
[6] M. Rades, Mechanical Vibrations, PRINTECH, Bucharest, Romania, 2006, vol. 1.