Altered pattern of TCR/CD3-mediated
protein-tyrosyl phosphorylation in T cells from patients
with systemic lupus erythematosus. Deficient
expression of the T cell receptor zeta chain.
S N Liossis, … , G J Dennis, G C Tsokos
J Clin Invest.
1998;
101(7)
:1448-1457.
https://doi.org/10.1172/JCI1457
.
Cellular immunity aberrations in patients with SLE are underscored by the abnormal early
Ag receptor-mediated lymphocyte signal transduction pathway. To further characterize the T
cell receptor (TCR)/CD3-initiated signaling defects, we studied 22 patients with SLE, 12
patients with other systemic rheumatic diseases, and 14 normal donors. The early (1 min)
TCR/CD3-mediated tyrosine phosphorylation of cellular proteins with a molecular size
between 36 and 64 kD was increased in 15 of 21 SLE patients, compared to normal or
disease control subjects. The deficiency or absence of a band with a molecular size of
approximately 16 kD in the immunoblots of SLE patients led us to investigate the
expression of the TCRzeta chain. In immunoblots using anti-zeta antibodies we found that
10 of 22 lupus patients tested lacked the expression of TCRzeta, which was always present
in control subjects (P < 0.001). Flow cytometric studies using permeabilized cells confirmed
the deficiency or absence of the TCRzeta chain in lupus T cells. Using Northern blots we
found that for eight patients tested, the TCRzeta mRNA was missing in three, decreased in
three, and apparently normal in two patients (P < 0.003), but was always present in control
subjects. Reverse transcriptase-PCR verified Northern blot results. We conclude that
TCRzeta chain expression is either decreased or absent in the majority of patients with
SLE, but […]
Research Article
The Journal of Clinical Investigation
Volume 101, Number 7, April 1998, 1448–1457 http://www.jci.org
Altered Pattern of TCR/CD3–mediated Protein-tyrosyl Phosphorylation in T Cells
from Patients with Systemic Lupus Erythematosus
Deficient Expression of the T Cell Receptor Zeta Chain
Stamatis-Nick C. Liossis,*‡ Xuan Z. Ding,* Greg J. Dennis,§ and George C. Tsokos*‡
*Department of Clinical Physiology, Walter Reed Army Institute of Research, Washington, DC 20307-5100; ‡Department of Medicine,
Uniformed Services University of the Health Sciences, Bethesda, Maryland 20814; and §Rheumatology Service, Walter Reed Army Medical
Center, Washington, DC 20307
Abstract
Cellular immunity aberrations in patients with SLE are un-derscored by the abnormal early Ag receptor–mediated lymphocyte signal transduction pathway. To further char-acterize the T cell receptor (TCR)/CD3–initiated signaling defects, we studied 22 patients with SLE, 12 patients with other systemic rheumatic diseases, and 14 normal donors. The early (1 min) TCR/CD3–mediated tyrosine phosphory-lation of cellular proteins with a molecular size between 36 and 64 kD was increased in 15 of 21 SLE patients, com-pared to normal or disease control subjects. The deficiency or absence of a band with a molecular size of z 16 kD in the immunoblots of SLE patients led us to investigate the ex-pression of the TCRz chain. In immunoblots using anti-z antibodies we found that 10 of 22 lupus patients tested lacked the expression of TCRz, which was always present in control subjects (P, 0.001). Flow cytometric studies using permeabilized cells confirmed the deficiency or absence of the TCRz chain in lupus T cells. Using Northern blots we found that for eight patients tested, the TCRz mRNA was missing in three, decreased in three, and apparently normal in two patients (P, 0.003), but was always present in con-trol subjects. Reverse transcriptase-PCR verified Northern blot results. We conclude that TCRz chain expression is ei-ther decreased or absent in the majority of patients with SLE, but not in patients with other systemic rheumatic dis-eases, regardless of disease activity, treatment status, or clinical manifestations. The previously described increases in TCR-initiated Ca21 responses and the herein described
increases in TCR-induced protein tyrosine phosphorylation and deficient TCRz expression may represent intrinsic de-fects modulating lupus T cell function. (J. Clin. Invest. 1998. 101:1448–1457.) Key words: human autoimmunity•
lympho-cyte signaling • tyrosine phosphorylation • antigen receptor •
signal transduction
Introduction
T lymphocytes use a cell surface multisubunit structure, the T cell receptor (TCR)1/CD3 complex, as an antigen-specific
rec-ognition site. The clonotypic TCRa/b (or g/d) chains are re-sponsible for specific antigen binding, but they are unable to transmit any intracellular signals due to the very short cyto-plasmic stretches they possess. Signal transduction is carried out by a nonpolymorphic T lineage-specific heterooligomer, the CD3 molecule, which is noncovalently associated with the Ag-binding TCR chains, as well as with the TCRz chain dimer. The extended cytoplasmic domains of the CD3-g, -d, -e, and TCRz polypeptides contain the signal transducing module im-munoreceptor tyrosine-based activation motif (ITAM) in one (for each CD3 chain) or three (for each TCRz) copies, to a to-tal of 10 ITAMs per TCR/CD3 complex. The ability of ty-rosine residues within an ITAM to undergo reversible phos-phorylation is the essence of the early signal transduction pathway. Events that closely mimic the physiologic cascade initiated by Ag occur when an anti-CD3 antibody is used to ligate the TCR/CD3 complex. The subsequent immediate phosphorylation and activation of several cytoplasmic protein tyrosine kinases (PTK) and of their substrates leads to intracy-toplasmic events, such as the mobilization of intracellular Ca21, activation of key enzymes, gene transcription, cytokine
synthesis, and release, proliferation, activation, or apoptosis (1, 2).
T cells from patients with SLE display multiple, frequently opposing abnormalities, including decreased cytotoxic cell function, increased helper activity, abnormal cytokine produc-tion, and the presence of unusual T cell subpopulations (3, 4). Work from this laboratory has shown that in SLE patients the TCR/CD3 signal transduction machinery is hyperactive in a disease-specific mode (5). In fresh peripheral T cells and in T cell lines, cross-linking of the TCR/CD3 complex led to a disease-specific increase in the intracytoplasmic concentration of free Ca21 ([Ca21]
i) responses that originated from the intracellular
Ca21 stores. Interestingly, this finding did not characterize any
particular T cell subpopulation. Recently, we have demon-strated that Ag receptor–mediated (surface IgM and IgD) sig-naling in B cells from lupus patients also leads to a disease-specific increase in [Ca21]
i responses that is correlated with
significant increases of tyrosyl phosphorylation of cellular proteins with an apparent molecular size between 36 and 64 kD (6).
The purpose of this study was to investigate whether an ab-normality in the antigen-receptor–initiated early protein ty-Address correspondence to Dr. George C. Tsokos, Walter Reed
Army Institute of Research, Department of Clinical Physiology, Building 40, Room 3078, Washington, DC 20307-5100. Phone: 202-782-9146; FAX: 202-782-3160; E-mail: gtsokos@usa.net
Received for publication 11 August 1997 and accepted in revised
form 22 January 1998. 1. Abbreviations used in this paper: [Ca21]
i, intracytoplasmic
rosine phosphorylation is part of the dysregulated signal trans-duction pathway in lupus T cells.
Methods
Patients and controls. 22 patients fulfilling the American College of Rheumatology classification criteria for lupus (7) (mean age6SD 5 47615 yr, range 21–77 yr, 20 female and 2 male) were studied. 14 pa-tients were on prednisone, 13 on hydroxychloroquine, 6 were receiv-ing cytotoxic medications (1 on cyclophosphamide, 4 on azathioprine, and 1 on methotrexate), and 2 patients were receiving no treatment. 8 of the patients were Caucasian, 13 African American, and 1 Hispanic. Patients on prednisone were studied at least 24 h after their last dose. 12 additional patients (disease-control group) with other rheumatic diseases (7 with RA, 1 with primary Sjögren’s syndrome, 1 with os-teoarthritis, 1 with psoriatic arthritis, 1 with polymyalgia rheumatica [PMR], and 1 with Takayasu’s arteritis, mean age6SD 5 53615 yr, range 25–77 yr, 11 women and 1 man). Six were receiving prednisone and eight were on methotrexate. 14 normal volunteers (normal-con-trol group) were also analyzed. Disease activity for the SLE patients was determined using the SLEDAI scoring system (8). The protocol of the study was approved by the Health Use Committee of the Walter Reed Army Medical Center, and written informed consent was obtained from all participating patients.
Cells and antibodies. Heparinized peripheral venous blood was obtained from the study subjects. PBMCs enriched in T cells were ob-tained as described previously (6). The percentage of T cells in the obtained subpopulation in all cases was . 90% as determined by us-ing an Epics Elite (Coulter, Hialeah, FL) flow cytometer. Cells were rested overnight in RPMI 1640 supplemented with 2 mM glutamine, 100 mg/ml streptomycin, 100 U/ml penicillin, 25 mM Hepes, and 10% heat-inactivated FCS (pH 7.4). The murine anti-CD3 mAb OKT3 (Ortho Biotech, Inc., Raritan, NJ) was used for cell stimulation. The antiphosphotyrosine mAb 4G10 (horseradish peroxidase [HRPO] conjugated) was purchased from Upstate Biotechnology Inc. (Lake Placid, NY), the murine anti-TCRz mAb (clone 6B10.2) was from Santa Cruz Biotechnology (Santa Cruz, CA), and the rabbit poly-clonal anti–human TCRz 387 (and anti-TCRh) was a generous gift from Dr. L.E. Samelson (National Institutes of Health, Bethesda, MD). The goat anti–mouse antiserum M-6149 was purchased from Sigma Chemical Co. (St. Louis, MO).
Immunoblotting and immunoprecipitation. Five million PBMCs enriched in T cells were stimulated with 10 mg/ml OKT3 for 1 or 2 min at 378C. To stop the reaction, 1 ml of ice-cold stop buffer was added (10 mM Tris, 50 mM NaCl, 50 mM NaF, 0.1 mM Na3VO4, 5 mM
EDTA, 30 mM sodium pyrophosphate, 1 mM PMSF, 2 mg/ml leupep-tin, and 2 mg/ml aprotinin), and whole cell lysates were obtained in a 1% Nonidet P-40 (Sigma Chemical Co.) lysis buffer as described pre-viously (6). Electrophoretically analyzed proteins (20 mg/lane) were transferred on Immobilon nitrocellulose pure membranes (Millipore, Bedford, MA), blocked, and subsequently immunoblotted with the antiphosphotyrosine HRPO-conjugated 4G10 mAb (1:1,000). Detec-tion was performed using the HRPL kit (NaDetec-tional Diagnostics, At-lanta, GA). For the detection of TCRz chain, the murine monoclonal 6B10.2 or the rabbit polyclonal 387 antibodies were used first, and subsequently the blots were incubated with a sheep anti–mouse HRPO-conjugated F(ab9)2 or with a donkey anti–rabbit
HRPO-con-jugated antibody, respectively (both were purchased from Amer-sham, Arlington Heights, IL), and developed as above. To evaluate equal loading of the lanes with protein, membranes were stripped in a solution of 100 mM 2-mercaptoethanol, 2% SDS, and 62.5 mM Tris-HCl (pH 6.8) at 708C for 45 min, and reblocked and reblotted with appropriate control mAbs.
To immunoprecipitate the TCRz chain, 500 mg total protein (in 500 ml lysis buffer) of precleared cell lysate obtained as above was in-cubated on ice for 1 h with 2 ml of the rabbit polyclonal anti–human TCRz antibody 387. 100 ml of a 50% slurry of protein A/G PLUS
aga-rose (Santa Cruz Biotech.) were added to capture immune complexes and incubated overnight at 48C on a rotator. Agarose-bound immune complexes were collected, washed three times (each with 500 ml of stop buffer, lysis buffer, and Tris wash buffer), and the pellet was boiled for 5 min with 50 ml of Laemmli sample buffer. Agarose was discarded, the supernatants were brought to a final concentration of 5% with 2-mercaptoethanol, and incubated at 378C for 1 h. Electro-phoretic protein fractionation of equal sample volumes (25 ml of sam-ple per lane) was followed by transfer to membranes and immuno-blotting with a murine anti–human TCRz mAb (6B10.2). Detection was performed as described above. Densitometric measurements were performed using a DC 40 camera and analyzed with the Digital Science 1D program (Eastman Kodak Co., Rochester, NY).
Flow cytometry. The expression of cell surface markers and of TCRz was examined in partially permeabilized, mildly fixed PBMC using a FACScan® (Becton-Dickinson, Mountain View, CA) flow
cy-tometer as described previously (9). Briefly, 106 PBMCs were washed
three times in ice-cold PBS, and mildly fixed in 0.01% paraformalde-hyde for 20 min on ice. Digitonin (Sigma Chemical Co.) was added at 10 mg/ml final, for 5 min on ice, and the efficiency of cell permeabili-zation was confirmed with the trypan blue exclusion method under a light microscope (always . 99%). Cells were incubated with 2 mg of the murine anti–human TCRz 6B10.2 mAb (or the MOPC 21 isotypic IgG1 mAb control [Sigma Chemical Co.]) for 30 min on ice, after having been incubated previously for 30 min on ice with an excess (503) concentration of purified human IgG (Cappel; ICN Pharma-ceuticals, Aurora, OH) to block nonspecific Fc binding sites. Then, cells were washed twice with ice-cold PBS 0.05% Tween, and further incubated with 4 ml of goat anti–mouse FITC-conjugated antibodies (Becton-Dickinson) for 30 min on ice. After washing three times with ice-cold PBS/1%, FBS/0.1% NaN3, cells were incubated with excess
mouse IgG (503) for 30 min (S25 Mouse Serum; Chemicon, Temec-ula, CA) on ice to block the remaining anti–mouse binding sites. Cells were washed again, incubated with the proper murine mAb against cell surface markers, and fixed in 1% paraformaldehyde in PBS be-fore analysis. All the latter mAbs were phycoerythrin (PE) conju-gated. The anti-CD3-PE, anti-CD4-PE, anti-CD8-PE (Becton-Dick-inson), and anti-CD45RO-PE (Caltag Laboratories, Burlingame, CA) were used for identification of T cell subsets. The murine anti-CD16-PE mAb was used to identify natural killer (NK) cells, and the anti-CD14-PE and anti-CD20-PE mAb (Becton-Dickinson) were used as markers for TCRz-negative cells (monocytes and B cells) and as monitors of efficient Fc blocking.
Fixed nonpermeabilized cell samples were also stained, either with anti-CD3-PE alone or with anti-CD3-PE and anti-CD7-FITC, to measure the intensity of CD3 expression on T cells. Detection of CD3 expression on T cells in this system represents CD3e chain expres-sion, according to the specificity of the anti-CD3-PE mAb used. Re-sults were analyzed using the CellQuest (Becton Dickinson, Ruther-ford, NJ) analysis software.
Flow cytometric [Ca21]
i measurement. The OKT3-induced (after goat anti–mouse cross-linking) changes of [Ca21]
i in negatively
se-lected and Indo-1 acetoxy methylester– (Molecular Probes, Eugene, OR) loaded fresh peripheral T cells from lupus patients and control individuals were determined as described previously (5). A helium-cadmium air-cooled UV laser-equipped Epics Elite (Coulter Corp.) flow cytometer was used, and results were analyzed using the Multi-Time analysis software (Phoenix Flow Systems, San Diego, CA).
Proliferation assays. Plastic tissue culture plates (96-well, round bottom) (Falcon Labware, Cockeysville, MD) were covered with OKT3 (0.1, 1.0, 10.0, and 100.0 mg/ml in PBS) or with identical con-centrations of UPC10 isotypic IgG2a control mAb (Sigma Chemical Co.). PBMCs (2 3 105 cells) in 0.2 ml from patients with SLE and
last 18 h. Incubation for 3 d at 10.0 mg/ml of OKT3 was optional. Cells were harvested using a semiautomatic cell harvester (Skatron Instru-ments, Sterling, VA) on glass fiber filters and radioactivity was mea-sured using a 1205 Betaplate liquid scintillation counter (LKB Wallac, Turku, Finland). For triplicate wells, one SD was always , 10% of the mean. Results are expressed as the mean6SEM Dcpm. The effect of equal concentrations of the IgG2a isotypic control mAb (again in triplicate wells) was always negligible.
Reverse transcriptase (RT)-PCR. Total RNA was extracted using the RNA SATA™ method (TEL-TEST B, Inc., Friendswood, TX) from PBMCs enriched in T cells from lupus or disease-control pa-tients and normal volunteers. Two pairs of primers specific for human TCRz and b-actin were designed and synthesized according to their sequences (10, 11). The primers were as follows: TCRz chain, 59
-CAAGATGAAGTGGAAGGCGC-39 and 59
-AATCCCCTGGG-TGTTAGCGA-39; and b-actin, 59 -CATGGGTCAGAAGGATT-CCT-39 and 59-AGCTCGTAGCTCTTCTCCAG-39. Each primer (1
mM) and 2.5 U of AmpliTaq DNA polymerase (Perkin Elmer, Foster City, CA) in 80 ml of PCR buffer containing 3 mM MgCl2 and 400 mM
dNTP were added to the RNA extract, and 30 PCR cycles were run at 958C for 1 min, then at 548C for 1.5 min, and finally at 728C for 1.5 min.
Northern blotting. 10 mg of RNA from each sample was dena-tured, electrophoretically separated in 1% agarose, 7% formaldehyde gels, and transferred onto nitrocellulose membranes. cDNA probes en-coding for TCRz and b-actin were synthesized with RT-PCR and ter-minally labeled with [a-32P]dCTP (3,000 Ci/mmol) (Amersham) to a
specific activity of 2.5–5 3 1028 cpm/mg DNA. Hybridization
(over-night at 428C) and exposure of the blots either to Kodak X-Omat film at 2708C for 4 d, or to a PhosphorImager screen for 2 d followed. The intensity of the bands was analyzed either densitometrically or with the help of a PhosphorImager (Molecular Dynamics, Sunnyvale, CA).
Statistical analysis. We used the unpaired Student’s t test and the
Fisher exact test (STAT EXACT program; Cytel Corp., Cambridge,
MA) for statistical evaluation of our data. Values of P # 0.05 were considered significant.
Results
Increased TCR/CD3–initiated protein tyrosine phosphorylation in T cells from patients with SLE. T cell–enriched PBMCs from lupus patients, individuals with other systemic rheumatic dis-eases, or normal volunteers were treated with 10 mg/ml OKT3 isotypic control mAb, or medium at 378C for 1 min. Whole cell lysates were obtained from unstimulated resting cells and at 1 min after stimulation as described previously (6). 20 mg of protein from each lysate was separated electrophoretically on 10% polyacrylamide/SDS gels and analyzed for the overall amount of protein tyrosine phosphorylation. We did not ob-serve the appearance of new bands in the lysates obtained from unstimulated cells from lupus patients. In addition, we did not record significant differences in the densitometric readings of the basal unstimulated levels of protein tyrosine phosphorylation bands between lupus patients and healthy volunteers (P , 0.8), lupus patients and disease-control pa-tients (P , 0.7), or normal- and disease-control individuals (P , 0.9) (Fig. 1, A and B). However, after incubation with OKT3 for 1 min, the intensity, determined by densitometry, of bands located between the 64- and the 36-kD markers was ob-viously increased in T cells from 15 of the 21 SLE patients (71%) when compared to the lysates of cells from normal indi-viduals (n 5 8) and from patients (n 5 11) with other systemic rheumatic diseases (Fig. 1, C, D, and E). The mean densito-metric intensity of 1 min OKT3–stimulated cells was
signifi-Figure 1. Increased TCR/CD3–mediated
[image:4.612.61.412.438.708.2]cantly higher in lysates of cells from SLE patients compared to cell lysates either from normal volunteers (P , 0.02) or from patients with other systemic rheumatic diseases (P , 0.015) and are collectively presented in Fig. 1 F. Differences between normal volunteers and disease-control patients were not sig-nificant (P , 0.08). In some experiments we cross-linked the OKT3 mAb with a goat anti–mouse antiserum, but we did not notice any further enhancement of the phosphorylation pat-tern. Also, the use of an isotypic control murine mAb instead of OKT3 failed to induce protein tyrosyl phosphorylation above that observed with medium alone. We did not observe any correlation between the densitometric intensity of the bands with disease activity, specific clinical feature(s), or treat-ment status. These observations are highly similar to previ-ously reported findings regarding the Ag receptor–initiated protein tyrosyl phosphorylation in lupus B cells in terms of band localization, disease specificity, and disease activity inde-pendence (6).
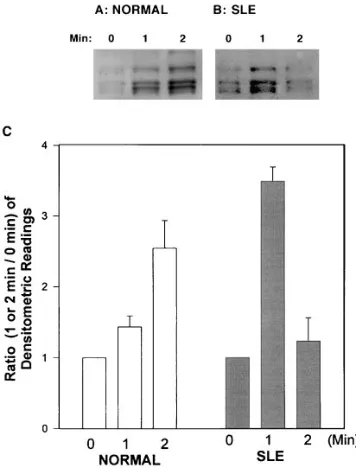
The time–response curve of the anti-CD3–mediated protein tyrosine phosphorylation is markedly altered in SLE patients. We conducted time course experiments to investigate whether the anti-CD3–mediated protein tyrosine phosphorylation in lupus T cells displayed a different pattern. We incubated lupus (n 5 6) and normal (n 5 3) T cells as described above for 1 and 2 min with OKT3. As shown in Fig. 2 A, the densitometric in-tensity of the 36–64-kD area from OKT3-stimulated normal T cells was further increased at 2 min. In contrast, the 2-min den-sitometric intensity of lysates from OKT3-stimulated lupus T
cells was significantly lower than that detected for the first minute after stimulation (Fig. 2 B). Interestingly, in two lupus patients (of six studied) the OKT3-induced protein tyrosine phosphorylation at 2 min was lower than that obtained before stimulation. The densitometric intensities of all the subjects studied are collectively presented in Fig. 2 C. The difference of the means of the densitometric readings obtained at the 2-min time point between normal individuals and SLE patients were significant (P , 0.034).
Diminished expression of the TCRz chain in lupus patients using immunoblots, immunoprecipitations, and flow cytome-try. In contrast to the increased tyrosyl phosphorylation pat-tern that was observed for the 36–64-kD area, the intensity of a band located between the 16- and 30-kD markers was signifi-cantly decreased (at all time points) in the cell lysates from 17 of 22 lupus patients (77%) when compared to normal and dis-ease-control individuals, and in some lysates from lupus pa-tients the band was undetectable. The characteristics of this band, i.e., molecular size between 16 and 30 kD, tyrosyl phos-phorylation in the resting state, and TCR/CD3–induced fur-ther tyrosyl phosphorylation (Fig. 3 A), led us to consider the TCRz chain as a possible candidate. To investigate whether the TCRz protein in lupus T cells was in fact decreased or missing, or present but simply resistant to early tyrosyl phos-phorylation, we conducted immunoblotting and immunopre-cipitation experiments. T cell–enriched PBMC (5 3 106) from
lupus patients, normal and disease-control individuals were lysed, and equal amounts of protein (30 mg) were separated elec-trophoretically and analyzed for content of TCRz protein using two different anti-z antibodies. Using a murine anti–human TCRz chain mAb, no bands corresponding to the TCRz chain could be identified in 10 of 22 lupus patients studied, while the z protein was always present in cell lysates from normal (n 5 12) and 12 disease-control individuals (seven patients with RA, one with PMR, one with primary Sjögren’s syndrome, one with Takayasu arteritis, one with osteoarthritis, and one with psoriatic arthritis) as shown in Fig. 3 B. Application of the Fisher’s exact test (2 3 3 table) revealed a statistically signifi-cant difference (P 5 0.001). We next used the polyclonal 387 anti-TCRz antibody to distinguish whether the whole protein or just a portion which includes the epitope detected by the murine 6B10.2 mAb (amino acids 36–54) was conformation-ally modified or missing. Immunoblots using the 387 antiserum showed that the z chain protein was again either obviously de-creased or undetectable in 6 of 9 SLE patients examined, when compared to the disease-control patients (n 5 7) and normal individuals (n 5 4), where it was always present in comparable amounts. One representative immunoblot using the rabbit 387 antiserum (one patient with SLE and two different patients with RA) is shown in Fig. 3 C. To further document our find-ings, 500 mg of total protein from lysates obtained from three SLE patients, one normal and two disease-control individuals, was immunoprecipitated using the 387 rabbit anti–human TCRz antibody, and subsequently the TCRz chain was de-tected in immunoblots using the murine 6B10.2 mAb. Prelimi-nary experiments showed that both these antibodies could de-tect not only the unphosphorylated, but the phosphorylated form(s) of TCRz as well (data not shown). The TCRz chain could be immunoprecipitated from the cell lysates obtained from normal and disease-control individuals. In the lysates from three SLE patients (Fig. 3 D), the immunoprecipitable amounts of TCRz were decreased in one, comparable to
nor-Figure 2. Time curve of the anti-CD3 mAb-mediated lupus T cell
[image:5.612.57.235.397.632.2]mal in another, and undetectable in a third patient. In lupus patients displaying absence of the full-length z chain, there was no other product with a smaller size (indicative of possible cleavage) detected further down in our gels.
[image:6.612.54.559.58.646.2]To further establish the deficiency (or absence) of the TCRz chain in whole lupus T cells and to characterize its ex-pression in T cell subsets, we conducted flow cytometry exper-iments. Digitonin-permeabilized cells were incubated with the
Figure 4. Detection of the TCRz chain in T cells from patients with SLE using flow cytometry. Patients with undetectable z chain in immuno-blots were also z chain negative by flow cytometric analysis of digitonin-permeabilized PBMCs. Cells were indirectly stained for TCRz chain ex-pression using a murine anti-z mAb and FITC-conjugated goat anti–mouse antibody (x axis). Double staining was performed for CD31, CD41, CD81, CD45RO1, and CD161 cells using PE-conjugated mAbs (y axis). CD201 cells (B cells) were also stained as negative control cells and as indicators of efficient Fc blockade (analyzed in Methods). A representative experiment of a TCRz2 lupus patient and a normal volunteer is shown A. All z-bearing cell populations clearly stained positively for the normal donor and negatively in the patient with SLE. Another patient with decreased expression of TCRz in immunoblots is shown in B. While the CD41 cells are largely unaffected and not obviously different than the respective normal control, the CD81 and CD161 cells were predominantly TCRz negative. The histograms in C represent staining with anti-CD3e and TCRz of a z-negative lupus patient and a healthy individual. Expression of the CD3e chain (left) was similar in the normal and the lu-pus individuals (dotted lines). Negative control is shown as the shadowed histogram. Expression of the z chain (right) for the lupus patient (dotted
[image:6.612.66.552.342.611.2]line) is similar to that of the negative control (solid line) in the z-negative lupus patient. TCRz chain expression in the normal donor is shown as the shadowed histogram.
6B10.2 mAb, followed by FITC-conjugated goat anti–mouse Ab, and PE-conjugated CD3, CD4, CD8, anti-CD45RO, and anti-CD16 antibodies as described in Methods. Cells bearing Fc receptors but not TCRz were also PE stained (anti-CD14, anti-CD20, or both) as negative control cells. The relevant isotypic control mAb was also always used. We stud-ied PBMCs from nine patients with SLE and six normal con-trol individuals. Immunoblot-established total absence of TCRz was associated with complete lack of staining of CD31, CD41, CD81, CD45RO1, and NK (CD161) cells with the anti-TCRz antibody (Fig. 4 A). Decreased expression of TCRz, es-tablished by immunoblotting, correlated with reductions of z1 CD31, and NK (CD161) cells. When T cell subsets were exam-ined separately, CD81 T cells lacked TCRz chain expression to a greater extent than CD41 cells (Fig. 4 B). Finally, T cells from patients with SLE who expressed normal amounts of TCRz by immunoblotting displayed percentages of TCRz1 cells (and subsets) that were comparable to those of normals (not shown). The expression of the e chain of the CD3 marker was unaffected by the presence or absence of the TCRz chain, and was found to be similar to that of the controls as shown in Fig. 4 C, reconfirming previously reported data (5). The above immunoblotting and immunoprecipitation experiments, as well as the flow cytometric staining experiments clearly show that the TCRz chain protein is quantitatively decreased or ab-sent in T cells from patients with SLE in a disease-specific fashion.
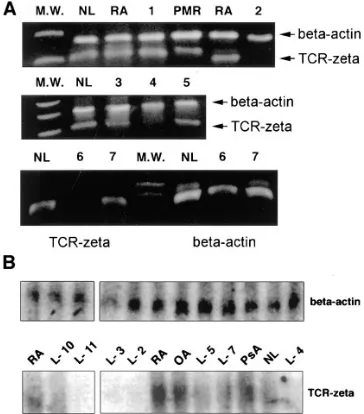
Absent or decreased mRNA for TCRz in lupus patients but not in control individuals. The TCRz chain can be selectively degraded upon T cell activation (12) or in other conditions by posttranslational processes which are incompletely understood (13, 14). To investigate whether the decreased amounts of TCRz chain detected in lupus T cells was the result of post-translational degradation, or the outcome of abnormalities at the mRNA level, we extracted total RNA from PBMCs en-riched in T cells and conducted RT-PCR using oligomer prim-ers (described in Methods) that amplify the full-length mRNA of the TCRz chain. Results (Fig. 5 A) obtained for eight lupus patients revealed that in three patients there was no detectable full-length mRNA band for the TCRz, while this band was al-ways present in the PBMC extracts from disease-control pa-tients (n 5 6 in total, [three RA patients, one with PMR, one with Sjögren’s syndrome, and one with Takayasu’s arteritis]) and in all normal individuals (n 5 3). An internal control cor-responding to the mRNA of a house keeping gene (b-actin) was always included and detected. Northern blots performed for the same controls and patients showed that of the eight SLE patients studied, the TCRz mRNA was undetectable in three, decreased but detectable in three, and no different than normal in two patients as shown in Fig. 5 B. Northern blot quantitative analysis of the TCRz (when present) and b-actin mRNA was performed either densitometrically or with the use of a PhosphorImager. Application of the Fisher’s exact test (3 3 2 table) revealed a statistically significant difference (P , 0.0023).
Associations of TCRz chain deficiency with early and late TCR/CD3–mediated T cell functions. The z chain of the TCR is a molecule involved in the TCR/CD3–initiated signal trans-duction biochemistry. To assess the consequences of TCRz de-ficiency, we studied the anti-CD3–induced changes in [Ca21]
i
(an early event in the signal transduction pathway), and the anti-CD3–induced cell proliferation (a late event).
The OKT3-induced (after cross-linking by goat anti–mouse antibody) peak [Ca21]
i ratios were studied in negatively
se-lected and Indo-1–loaded T cells from eight patients with SLE (four were TCRz1 and four were TCRz2 as determined by Western immunoblots) and were compared to the responses of T cells obtained from four normal individuals (normal con-trols) as described previously (5). Baseline values of [Ca21]
i
ra-tios were comparable for unstimulated T cells from lupus pa-tients and from normal volunteers. All eight lupus papa-tients responded in a supraphysiological manner, which is in agree-ment with previously published data (5). Analysis of the [Ca21]
i responses according to the presence or absence of
TCRz yielded significant differences. Specifically, absence of TCRz was associated with [Ca21]
i responses which were higher
than normal (peak ratio of [Ca21]
i: 16.160.65 vs. 14.160.26,
P , 0.026), but were significantly lower than the [Ca21]
i
re-sponses of patients who were TCRz1 (16.160.65 vs. 19.260.71, P , 0.019) and were characterized as low supranormal. Pa-tients who were TCRz1 responded in a high supranormal man-ner. Their responses were significantly higher both from the TCRz2 patients (P , 0.019) and from the normal controls (P , 0.0005). Thus, it is clear that SLE patients display higher than normal [Ca21]
i responses and that they could be stratified
as high or low hyperresponders according to the presence or absence of the TCRz chain (Fig. 6 A).
We also studied the OKT3-induced proliferation profile of TCRz positive and negative SLE patients. For the
[image:7.612.56.238.61.268.2]tion assays PBMCs were used. To obtain comparable results, the percentage of CD31 cells was determined previously by flow cytometry, and only those patients and controls with simi-lar CD31 subpopulations were used. Time– and dose–response experiments determined the optimal OKT3 dose and incuba-tion time (10 mg/ml OKT3, and incubation for 3 d). Eight pa-tients with SLE and six normal volunteers were studied. The proliferative responses of PBMCs obtained from normal sub-jects were not different from the responses of lupus patients who were TCRz1 (P 5 0.35) or TCRz2 (P 5 0.87). The differ-ence in the responses between TCRz1 and TCRz2 patients was, similarly, not statistically significant (P 5 0.28) (Fig. 6 B).
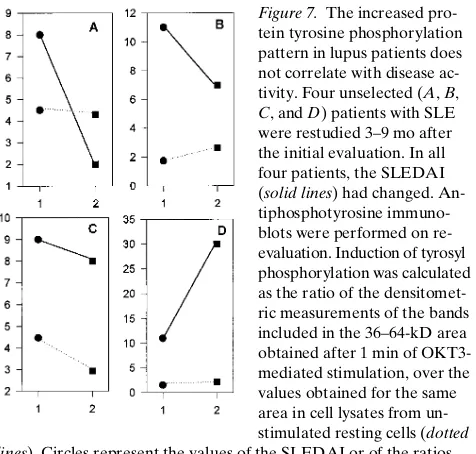
The increased TCR/CD3–induced protein tyrosine phos-phorylation and the absence of TCRz in T cells from the same SLE patients persist over time despite changes in disease activ-ity. Even though the pattern of TCR/CD3–mediated early protein tyrosine phosphorylation was found to be independent of disease activity, one could still argue that this aberration may correlate, in an individual SLE patient, with changes in disease activity, and/or the appearance or disappearance of specific clinical manifestations. To address this question, four unselected lupus patients were restudied 3–9 mo after their ini-tial evaluation. In all four patients the SLEDAI had changed. Nevertheless, the increased Ag receptor–mediated overall protein tyrosine phosphorylation at 1 min did not parallel changes in disease activity. Patients A and D had significant changes in their disease activity (a decrease of 75% and an in-crease of 172%, respectively, in their SLEDAI) while the den-sitometrically measured ratio (1:0 min) of tyrosine phosphory-lation was not substantially altered. On the other hand, for patients B and C, who displayed no major changes in their SLEDAI, the ratio (1:0 min) was substantially either increased or decreased, respectively (Fig. 7). These experiments further confirm that the anti-CD3 mAb–induced early overall protein tyrosine phosphorylation pattern does not correlate with changes in disease activity, thus, implying a permanent intrin-sic defect in the early Ag receptor–initiated signaling machin-ery. Importantly, patient D had detectable and patients A, B, and C had undetectable bands corresponding to the TCRz chain as determined by Western immunoblotting in both eval-uations. Also, lack of TCRz chain expression found by West-ern immunoblots during the first visit was in agreement with the results of flow cytometric TCRz chain detection in
perme-abilized cells during a later (after 12–14 mo) visit. These data imply that the pattern of z chain expression is time- and dis-ease activity–independent.
Patients with SLE are usually receiving treatment with agents which alter the function of the immune system. To ex-clude a potential drug effect on the TCRz chain deficiency, our lupus patients were analyzed in comparison with RA patients from our disease-control group who suffered from systemic autoimmune rheumatic diseases and received similar agents. As depicted in Table I, the z chain deficiency in patients with SLE cannot be attributed to a drug effect.
Discussion
We conducted this study to investigate possible aberrations in the early events of the signal transduction pathway in lupus T cells. Since disease-specific abnormalities in the TCR/CD3– mediated [Ca21]
[image:8.612.63.535.58.229.2]i responses have been demonstrated already
Figure 6. Early and late anti-CD3–mediated signaling
events in the absence or presence of the TCRz chain in lupus T cells. (A) Measurement of TCR/CD3–initi-ated [Ca21]
i responses of negatively selected,
Indo-1–loaded fresh peripheral T cells. The magnitude of the peak [Ca21]
i responses was determined flow
cyto-metrically in four normal donors and eight patients with SLE (four were TCRz2 [2] and four were TCRz1 [1]) and are represented here as the 381:525 nm fluorometric ratio, which is directly proportional to the [Ca21]
i. The presence or absence of TCRz
could clearly stratify the lupus patients as high or low responders, respectively. All lupus patients tested dis-played supranormal Ca21 fluxes. Differences between the three groups shown here were always significant. The anti-CD3–mediated proliferative responses (a late signaling event) of six normal donors and eight lupus patients are shown in B. The proliferative responses of TCRz1 and TCRz2 patients with SLE were not significantly different than the re-sponses of the control individuals. Bars represent mean6SEM.
Figure 7. The increased
pro-tein tyrosine phosphorylation pattern in lupus patients does not correlate with disease ac-tivity. Four unselected (A, B,
C, and D) patients with SLE
were restudied 3–9 mo after the initial evaluation. In all four patients, the SLEDAI (solid lines) had changed. An-tiphosphotyrosine immuno-blots were performed on re-evaluation. Induction of tyrosyl phosphorylation was calculated as the ratio of the densitomet-ric measurements of the bands included in the 36–64-kD area obtained after 1 min of OKT3-mediated stimulation, over the values obtained for the same area in cell lysates from un-stimulated resting cells (dotted
lines). Circles represent the values of the SLEDAI or of the ratios
[image:8.612.317.555.489.716.2](5), we explored biochemical events which precede the Ag re-ceptor–induced Ca21 fluxes. The earliest known events in the
Ag receptor–initiated signaling is the activation of the src and the ZAP-70/Syk family of PTKs, that results in reversible ty-rosyl phosphorylation of multiple protein substrates (2), the majority of which remain unknown. We used the OKT3 mAb to trigger the signaling cascade, and we evaluated the pattern of early tyrosine phosphorylation in primary T cells from pa-tients with SLE, papa-tients with other systemic rheumatic dis-eases, and normal individuals.
Although no additional bands (corresponding to tyrosyl phosphorylated proteins) were noted in the antiphosphoty-rosine immunoblots of lysates of unstimulated T cells from pa-tients with SLE, lysates from OKT3-stimulated lupus T cells, but not from disease-control or normal-control T cells, dis-played altered quantitative and time course responses. Specifi-cally, at the first minute of treatment with anti-CD3 mAb, the intensity of bands with apparent molecular sizes between 64 and 36 kD was significantly enhanced in lupus T cells com-pared to control individuals, in a disease-specific and disease activity–unrelated mode. This abnormality persisted in four patients who were reevaluated after several months, when dis-ease activity and clinical manifestations had changed. While normal T cells exhibit gradually rising levels of protein ty-rosine phosphorylation over a 2-min period in a near-linear mode, the lupus T cells respond to the same OKT3-induced stimulus in a burst-like fashion, achieving supranormal amounts of tyrosyl phosphorylated cellular proteins quite early (by the first minute) and return to a close-to-resting state by the second minute.
This earlier and higher than normal response of T cells from SLE patients is in agreement with the earlier and higher than normal Ca21 fluxes which follow TCR/CD3 ligation (5).
Our current data are also similar to those obtained from the study of Ag receptor–initiated early signaling events in lupus B cells (6), suggesting a possibly unifying pathology in the signal transduction of SLE lymphocytes. In a previously published study investigating the induction of tyrosyl phosphorylated proteins after anti-CD3 mAb cross-linking, T cells from SLE patients were reportedly refractory to stimulation compared to T cells from normal donors (15). Nevertheless, this anti-CD3 antibody effect was studied at a relatively late point (3 min), and earlier points were omitted. In our study we show that even earlier (at 2 min) the lupus T cells have produced a fast supraphysiological response, and have already returned to a close-to-resting state.
In contrast to the obvious and consistent OKT3-induced hyperphosphorylation of proteins of 36–64 kD, we noticed that
a band located between 16 and 30 kD, which was consistently present in lysates from normal T cells, was frequently de-creased in the antiphosphotyrosine immunoblots of lupus T cells. This substrate (when present) displayed decreased inten-sity in the resting state, but it was undergoing tyrosyl phosphor-ylation after stimulation with OKT3. Immunoblotting and im-munoprecipitation experiments identified this protein to be the TCRz chain. The possibility of detecting only one epitope (linear or conformational) of this protein was largely elimi-nated by using two different (a murine monoclonal and a rab-bit polyclonal) antibodies. The expression of the z chain was either deficient or diminished in 77% of the studied SLE pa-tient population, while it was always sufficiently present in all normal donors and patients with other systemic rheumatic dis-eases that were also studied. Further confirmation of the TCRz chain deficiency was provided by flow cytometry exper-iments of digitonin-permeabilized cells. The TCRz chain defi-ciency in lupus T cells can be considered chain-specific, since our data (and a previously reported study) did not find differ-ences in the expression of CD3e polypeptide on lupus T cells, regardless of the presence or absence of the z chain (5). TCRz was absent from cell subsets (CD31, CD41, CD81, CD45RO1, and CD161) from patients who lacked the TCRz chain by im-munoblotting. For those patients with obviously normal TCRz expression, no difference in all subsets could be detected by flow cytometry. In patients who had decreased TCRz expression, the CD41 cells were not obviously affected, while the CD81 and CD161 cell subsets were, to a greater extent, z chain deficient. This relatively selective involvement has been previously de-scribed in z-knockout mice (16, 17) where the CD81 T cell subset was more severely affected by the absence of the z polypeptide as compared to the CD41 subset. Functionally, this defect may contribute to the multiplicity of immune cell abnormalities which predominantly involve CD81 and NK cells in lupus.
Selective degradation of a previously expressed TCRz after T cell activation has also been reported (12), as well as the lack of TCRz chain in tumor-infiltrating lymphocytes (13, 14) un-der the influence of poorly unun-derstood (but reversible) post-translational mechanisms. In the latter case, FceRIg may sub-stitute for the missing TCRz. The absence or diminished expression in T cells from some SLE patients reported herein is not the result of posttranslational modifications since, in lu-pus patients, the mRNA for the TCRz was undetectable or se-verely decreased either by Northern blots or (more impor-tantly) by RT-PCR. None of the normal or the disease-control individuals studied displayed a similar abnormality.
[image:9.612.57.296.91.165.2]The TCRz forms a homodimer which is part of the TCR/ CD3 complex. Different functions have been attributed to the z chain including roles in signaling in mature T cells, in proper assembly and transfer from the cytoplasm to the cell surface of the complete TCR/CD3 heterooligomer, and in normal devel-opment and selection of immature thymocytes (16–18). The long cytoplasmic domain of each z chain contains three ITAM modules which participate in signaling. After these ITAMs be-come tyrosyl phosphorylated (by members of the src family of PTK), they form anchoring sites for the tandem SH2-domains of ZAP-70, a PTK important for further signal propagation (19). Data originating from the study of transformed T cells suggest that in the resting state the TCRz is found in a non-phosphorylated form and becomes rapidly non-phosphorylated after TCR/CD3 ligation. This is not true for the normal peripheral T cells, where TCRz is constantly phosphorylated (increasing Table I. Expression of the TCRz Chain in T Cells from
Patients with SLE and RA Who Were Treated with Immunosuppressive Agents
Patients (n) TCRz chain (1) TCRz chain (2)
SLE patients on prednisone (14) 8 6
RA patients on prednisone (4) 4 0
SLE patients on cytotoxics* (6) 3 3
RA patients on cytotoxics‡ (7) 7 0
further after TCR/CD3 ligation) and ZAP-70 is constantly bound on it (20). In a minority of T cells (5–10%), the z chain may be found as part of a heterodimer with the highly homolo-gous TCRh chain (with no known physiological role), which is an alternatively spliced product of the z gene (21) and has two ITAMs. There are T cell subsets which normally do not con-tain any TCRz and its place is taken by another homologous protein, the g chain of the high-affinity receptor type I for the Fc fragment of IgE (FceRIg) (22–24), which contains a single ITAM. FceRIg has also been identified as a signal transducing molecule in receptors for the Fc fragment of IgG as well (25), where TCRz can also be found (26, 27).
To assess the functional consequences of TCRz deficiency in lupus T cells we studied the anti-CD3–induced [Ca21]
i
responses and the anti-CD3–induced proliferation in com-parison with T cells from healthy volunteers. TCRz status sig-nificantly affected the [Ca21]
i responses. The constantly
supra-physiological OKT3-induced [Ca21]
i responses of lupus T cells
could be clearly stratified as high or low supranormal in corre-lation with the presence or absence of the TCRz chain. While this early signal transduction event was clearly correlated to the z chain status, the same was not true for the OKT3-induced cell proliferation. This late event was not affected by the z chain status. The AgR-mediated proliferative behavior of lupus T cells is unclear, with different groups reporting different re-sults (for review see reference 28). It is possible that other me-diators participating in this relatively late cellular function may overcome or compensate for the absence of the z chain. Also, the sensitivity of this method may not allow for the detection of differences in the two patient groups. Other indicators of cellular activation may be more sensitive to the z chain defect, an issue which further studies should address.
The TCRz chain is important for the proper assembly and transfer to the cell membrane of the whole TCR/CD3 com-plex. Experiments in z-knockout mice have shown that the de-velopment of mature T cells and the expression of the TCRa/b complex on the surface of such T cells are greatly impaired. Nevertheless, the expression of TCRz is not an absolute re-quirement for proper development of T cells. Mature single-positive TCRa/b cells appear in the periphery of z-knockout mice, and the development and function of non-TCRa/b cells is totally unaffected. Moreover, even when small (ITAM-less) fragments of the z chain are expressed only, instead of the full-length chain, functional TCR/CD3 complexes are sufficiently expressed on the cell surface. It was recently reported that z-knockout mice transfected with the FceRIg gene have nor-mal T cell development and function (29). In murine knockout models that express neither TCRz, nor TCRh and FceRIg, mature T cells were still produced (for review see reference 30). The above data imply that the TCRz chain may not be ab-solutely required either for the signal transduction cascade ini-tiated by the TCR/CD3 complex in mature or immature T cells, or for the proper assembly and transfer to the surface of the TCR/CD3 polypeptides. Thus, TCRz-deficient T cells can ini-tiate and propagate the signal transduction cascade, provided that they express on their cell surface sufficient amounts of TCR/CD3. In such a situation, signaling can be transduced by using the ITAMs of the other invariant chains of the CD3 complex (31, 32). In fact, signal transducing molecules such as ZAP-70 have been shown to functionally bind to these non-z ITAMs (33). It has also been reported that Syk instead of ZAP-70 is alternatively and preferentially recruited to the
polypeptide (if any) which may substitute for the missing TCRz chain (i.e., the FceRIg) and propagates the generated signals further downstream (34). Even though Ag receptor sig-naling takes place in the absence of z, the outcome is different. The pattern of protein tyrosyl phosphorylation which is ob-served under such settings is altered, and the production of IL-2 is decreased (31). This outcome is similar to the presently de-scribed abnormal pattern of OKT3-mediated tyrosine phos-phorylations in lupus T cells, and with the known deficient IL-2 production in lupus (35). The absence of the z chain in NK cells may also influence their function, which is also decreased in lupus patients (36, 37).
One aspect of T cell physiology which is influenced signifi-cantly by the absence of the z chain is the positive and negative selection of the immature thymus-dependent cells. The ampli-fication effects of the three ITAMs of the z chain in signaling are considered important and are supported by experimental data stemming from the study of these selection processes. Ab-sence of the z chain decreases both positive and negative selec-tion. This may apply to SLE as well. The decreased negative selection may enhance an autoimmune repertoire, and the de-creased positive selection may be the basis for the dede-creased thymus-dependent immune responses known in lupus T cells in vitro and in vivo. Further support for the former hypothesis comes from a recent study reporting an enhanced autoimmune potential for the T cells produced by z-knockout mice (38).
The TCR/CD3–induced signaling in mature z-less T cells has been studied in the setting of tumor-infiltrating lympho-cytes by proliferation assays and was found decreased (39). Nevertheless, the z chain deficiency in the above cells was ac-companied by decreased expression of src family members which may offer an explanation to this phenomenon. On the other hand, while the levels or the activities of src-PTK in lu-pus T cells are unknown, the T cells of SLE patients display a decreased counterregulatory mechanism for signal transduc-tion that may contribute to the enhanced Ag receptor signaling events. This consists of the decreased activity of cAMP-dependent protein kinase A type I (40). This enzyme nega-tively affects TCR/CD3–mediated signaling by decreasing the Ca21 fluxes, and presumably also the anti-CD3 mAb-induced
protein tyrosyl phosphorylation. In mature T cells the TCRz chain is particularly effective in triggering activation-induced cell death (41). This particular mode of TCR/CD3-mediated apoptotic cell death is reportedly decreased in peripheral T cells of SLE patients in a disease-specific fashion (42), a phenome-non which may be explained by a deficient expression of the z chain in these cells.
Thus, abnormalities in the expression of the TCRz protein may consist of a common denominator in signal dysregulation and in the dysfunction of z chain–bearing immune cells in SLE. Our TCRz mRNA findings imply that this specific mRNA was either absent or abnormal, or finally, extremely unstable and selectively degraded. Further studies are necessary to investi-gate these possibilities. They also raise the possibility that the underlying abnormality may lie at the DNA level. Analysis of the gene for the TCRz chain, which is located on chromosome 1, in lupus patients and their families should be the next step to further characterize the observed defect. Genetic factors are well known contributors for SLE, and a possible link with a lo-cus on human chromosome 1 has recently been claimed (43).
the majority of patients with SLE. This abnormality is disease specific, disease activity independent, treatment unrelated, and does not represent posttranslational modifications. Be-cause these aberrations were limited to lupus T cells, we con-clude that they may represent intrinsic defects of potential pathogenetic significance for the disease.
Acknowledgments
We are grateful to Dr. L.E. Samelson (National Institutes of Health, Bethesda, MD) for providing the rabbit anti-TCRz antibody 387. We also thank Dr. M. Tolnay for help with the PhosphorImager and Mr. Lee Collins for help with the preparation of the figures.
This study was supported in part by work unit 9297 from the De-partment of Clinical Investigation, Walter Reed Army Medical Center. The opinions and assertions contained herein are the private views of the authors and are not to be construed as official or as reflecting the views of the Department of the Army or the Department of Defense.
References
1. Weiss, A., and D.R. Littman. 1994. Signal transduction by lymphocyte antigen receptors. Cell. 76:263–274.
2. Wange, R.L., and L.E. Samelson. 1996. Complex complexes: signaling at the TCR. Immunity. 5:197–205.
3. Tsokos, G.C. 1992. Overview of cellular immune function in systemic lu-pus erythematosus. In Systemic Lulu-pus Erythematosus. R.G. Lahita, editor. Churchill Livingstone, New York. 15–50.
4. Horwitz, D.A., and W. Stohl. 1993. Abnormalities in T lymphocytes. In Dubois Lupus Erythematosus. D.J. Wallace and B.H. Hahn, editors. Lea & Fe-biger, Philadelphia. 83–96.
5. Vassilopoulos, D., B. Kovacs, and G.C. Tsokos. 1995. TCR/CD3 com-plex–mediated signal transduction pathway in T cells and T cell lines from pa-tients with systemic lupus erythematosus. J. Immunol. 155:2269–2281.
6. Liossis, S.N.C., B. Kovacs, G. Dennis, G.M. Kammer, and G.C. Tsokos. 1996. B cells from patients with systemic lupus erythematosus display abnormal antigen receptor-mediated signal transduction events. J. Clin. Invest. 98:2549– 2557.
7. Tan, E.M., A.S. Cohen, J.F. Fries, A.T. Masi, D.J. McShane, N.F. Roth-field, J.G. Schaller, N. Talal, and R.J. Winchester. 1982. The 1982 revised crite-ria for the classification of systemic lupus erythematosus. Arthritis Rheum. 25: 1271–1277.
8. Bombardier, C., D.D. Gladman, M.B. Urowitz, D. Caron, and C.H. Chang. 1992. Derivation of the SLEDAI. A disease activity index for lupus pa-tients. Arthritis Rheum. 35:630–640.
9. Anderson, P., M.L. Blue, C. O’Brien, and S.F. Schlossman. 1989. Mono-clonal antibodies reactive with the T cell receptor z chain: production and char-acterization using a new method. J. Immunol. 143:1899–1904.
10. Weissman, A.M., D. Hou, D.G. Orloff, W.S. Modi, H. Seuanez, S.J. O’Brien, and R.D. Klausner. 1988. Molecular cloning and chromosomal local-ization of the human T cell receptor zeta chain: distinction from the molecular CD3 complex. Proc. Natl. Acad. Sci. USA. 85:9709–9713.
11. Ponte, P., S.Y. Ng, J. Engel, P. Gunning, and L. Kedes. 1984. Evolution-ary conservation in the untranslated regions of actin mRNAs: DNA sequence of a human beta-actin cDNA. Nucleic Acids Res. 12:1687–1696.
12. Taupin, J.L., and P. Anderson. 1994. Activation-induced proteolysis of cytoplasmic domain of zeta in T cell receptors and Fc receptors. Eur. J. Immu-nol. 24:3000–3004.
13. Mizoguchi, H., J.J. O’Shea, D.J. Longo, C.M. Loeffler, D.W. McVicar, and A.C. Ochoa. 1992. Alterations in T cell transduction molecules in T lym-phocytes from tumor-bearing mice. Science. 258:1795–1797.
14. Nakagomi, H., M. Petersson, I. Magnusson, C. Juhlin, M. Matsuda, H. Mellstedt, J.L. Taupin, E. Vivier, P. Anderson, and R. Kiessling. 1993. Decreased expression of the signal transducing z chains in tumor-infiltrating T cells and NK cells of patients with colorectal carcinoma. Cancer Res. 53:5610–5612.
15. Matache, M., M. Stefanescu, A. Onu, G. Szegli, M. Barel, S. Tanaseanu, I. Matei, S. Bouillie, and R. Frade. 1996. Tyrosine phosphorylation in periph-eral lymphocytes from patients with systemic lupus erythematosus. Autoimmu-nity. 24:217–228.
16. Ohno, H., T. Aoe, S. Taki, D. Kitamura, Y. Ishida, K. Rajewsky, and T. Saito. 1993. Development and functional impairment of T cells in mice lacking CD3z chains. EMBO (Eur. Mol. Biol. Organ.) J. 12:4357–4366.
17. Shores, E.W., K. Huang, T. Tran, E. Lee, A. Grinberg, and P.E. Love. 1994. Role of TCR zeta chain in T cell development and selection. Science. 266: 1047–1050.
18. Irving, B.A., and A. Weiss. 1991. The cytoplasmic domain of the T cell
receptor z chain is sufficient to couple to receptor-associated signal transduc-tion pathways. Cell. 64:891–901.
19. Chan, A.C., M. Iwashima, C.W. Turck, and A. Weiss. 1992. ZAP-70: a 70 kD protein tyrosine kinase that associates with the TCR z chain. Cell. 71: 649–662.
20. van Oers, N.S.C., and A. Weiss. 1995. The Syk/ZAP-70 protein tyrosine kinase connection to antigen receptor signaling processes. Semin. Immunol. 7: 227–236.
21. Ohno, H., and T. Saito. 1990. CD3 zeta and eta chains are produced by alternative splicing from a common gene. Int. Immunol. 2:1117–1119.
22. Qian, D., A. Sperling, D.W. Lancki, T. Tatsumi, A. Barrett, J.A. Blue-stone, and F.W. Fitch. 1993. The g chain of the high-affinity receptor for IgE is a major functional subunit of the T cell antigen receptor complex in gd T lym-phocytes. Proc. Natl. Acad. Sci. USA. 90:11875–11879.
23. Koyasu, S., L. D’Adamio, A.R.M. Arulanandam, S. Abraham, L.K. Clayton, and E.L. Reinherz. 1992. T cell receptor complexes containing FceRIg
homodimers in lieu of CD3z and CD3h components: a novel isoform expressed on large granular lymphocytes. J. Exp. Med. 175:203–209.
24. Küster, H., H. Thomson, and J.P. Kinet. 1990. Characterization and ex-pression of the gene for the human Fc receptor g subunit. Definition of a new gene family. J. Biol. Chem. 265:6448–6452.
25. Vivier, E., N. Rochet, J.P. Kochan, D.H. Presky, S.F. Schlossman, and P. Anderson. 1991. Structural similarity between Fc receptors and T cell recep-tors: expression of the gamma subunit of Fc epsilon RI in human T cells, natural killer cells, and thymocytes. J. Immunol. 147:4263–4270.
26. Anderson, P., M. Caligiuri, J. Ritz, and S.F. Schlossman. 1989. CD3-neg-ative natural killer cells express z TCR as part of a novel molecular complex. Nature. 341:159–162.
27. Lanier, L.L., G. Yu, and J.H. Phillips. 1989. Co-association of CD3z
with a receptor (CD16) for IgG Fc on human natural killer cells. Nature. 342: 803–805.
28. Tsokos, G.C., and J.E. Balow. 1984. Cellular immune responses in sys-temic lupus erythematosus. Prog. Allergy. 35:93–161.
29. Shores, E.W., V. Flamand, T. Tran, A. Grinberg, J.P. Kinet, and P.E. Love. 1997. FceRIg can support T cell development and function in mice lack-ing endogenous TCRz chain. J. Immunol. 159:222–230.
30. Shores, E.W., and P.E. Love. 1997. TCR z chain in T cell development and selection. Curr. Opin. Immunol. 9:380–389.
31. Letourneur, F., and R.D. Klausner. 1992. Activation of T cells by a ty-rosine kinase activation domain in the cytoplasmic tail of CD3e. Science. 255: 79–82.
32. Hermans, M.H.A., and B. Malissen. 1993. The cytoplasmic tail of the T cell receptor z chain is dispensable for antigen-mediated T cell activation. Eur. J. Immunol. 23:2257–2262.
33. Isakov, N., R.L. Wange, W.H. Burgess, J.D. Watts, R. Aebersold, and L.E. Samelson. 1995. ZAP-70 binding specificity to T cell receptor tyrosine-based activation motifs: the tandem SH2 domains of ZAP-70 bind distinct ty-rosine-based activation motifs with varying affinity. J. Exp. Med. 181:375–380.
34. Olivier, J.M., D.L. Burg, B.S. Wilson, J.L. McLaughlin, and R.L. Geahlen. 1994. Inhibition of mast cell FceRI-mediated signaling and effector function by the Syk-selective inhibitor, piceatannol. J. Biol. Chem. 269:29697– 29703.
35. Alcocer-Varela, J., and D. Alarcon-Segovia. 1982. Decreased produc-tion of and response to interleukin-2 by cultured lymphocytes from patients with systemic lupus erythematosus. J. Clin. Invest. 69:1388–1392.
36. Hoffman, T. 1980. Natural killer function in systemic lupus erythemato-sus. Arthritis Rheum. 23:30–35.
37. Tsokos, G.C., A.H. Rook, J.Y. Djeu, and J.E. Balow. 1982. Natural killer cells and interferon responses in patients with systemic lupus erythemato-sus. Clin. Exp. Immunol. 50:239–245.
38. Yamazaki, T., H. Arase, S. Ono, H. Ohno, H. Watanabe, and T. Saito. 1997. A shift from negative to positive selection of autoreactive T cells by the reduced level of TCR signal in TCR-transgenic CD3zeta-deficient mice. J. Im-munol. 158:1634–1640.
39. Finke, J.H., A.H. Zea, J. Stanley, D.L. Longo, H. Mizoguchi, R.R. Tubbs, R.H. Wiltroud, J.J. O’Shea, S. Kudoh, E. Klein, et al. 1993. Loss of T cell receptor zeta chain and p56lck in T cells infiltrating renal cell carcinoma. Cancer Res. 53:5613–5616.
40. Kammer, G.M., I. Khan, and C. Malemud. 1994. Deficient type I protein kinase A isozyme activity in systemic lupus erythematosus T cells. J. Clin. In-vest. 94:422–430.
41. Combadière, B., M. Freedman, L. Chen, E.W. Shores, P. Love, and M.J. Lenardo. 1996. Qualitative and quantitative contributions of the T cell receptor
z chain to mature T cell apoptosis. J. Exp. Med. 183:2109–2117.
42. Kovacs, B., D. Vassilopoulos, S.A. Vogelgesang, and G.C. Tsokos. 1996. Defective CD3-mediated cell death in activated T cells from patients with sys-temic lupus erythematosus: role of decreased intracellular TNF-a. Clin. Immu-nol. Immunopathol. 81:293–302.


![Bis{4 bromo 2 [tris(hydroxymethyl)methyliminomethyl]phenolato}zinc(II) methanol disolvate](data:image/gif;base64,R0lGODlhAQABAIAAAP///wAAACH5BAEAAAAALAAAAAABAAEAAAICRAEAOw==)