© 2016, IRJET | Impact Factor value: 4.45 | ISO 9001:2008 Certified Journal
| Page 2242
Analysis and Classification of Internet activity Logs Based on Patterns of
Traffic Rates
Lovepreet Singh
1, Anshu sharma
21
M.tech Student, Dept. of CSE, CT Institute of Technology & Research , Jalandhar, India
2
Assistant Professor, Dept. of CSE, CT Institute of Technology & Research , Jalandhar, India
---
---Abstract -
Nowadays internet becomes necessity in our daily lives. Thus, whenever a person want to access a website then at time of that there is creation of log record which contains username, source IP, destination IP, the number of bytes read, duration of file, etc. For one web access, a web proxy generates one log record. Proxy logs can be used to investigate the web usage. In this paper we use data mining classification and clustering to find the hidden knowledge. This can be used in this educational sector like a watch dog.Keywords
:
Data mining, Classification, Clustering, k-mean algorithm, Euclidian distance, Manhattan distance, Log dataset.1. INTRODUCTION
With increase in awareness and availability of Internet, information of any kind has become available at different websites. To promising this thing it is up-to the college administrator how easily and shortly they provide the meaningful data to user end. Today, addiction to the Internet is a serious issue amongst everyone, especially in campus-wide networks where Internet is freely available to everyone. An administrator in a campus may wish to ensure controls on Internet usage. In general, most campuses end up restricting usage. This has the disadvantage that a genuine user who wants to access information is also denied. Internet traffic data can be collected from various hardware devices as routers or proxy servers. In this paper, we analyse a large
log to study “user access patterns”. Such a study can assist a network management system in traffic shaping and monitoring thus removing the necessity of regimentation. this is the main motivation of this paper. Besides all other things, this paper also focuses on performance and precision of the system. There are studies on the analysis of proxy log [1], [2], [3].
In this paper, we first discuss a tool that we have implemented to analyses the behaviour of logs of user. Second, we apply clustering and classification on logs to calculate precision and recall. The contributions of this paper can be stated as follows
1. Related work
2. Proposed methodology
© 2016, IRJET | Impact Factor value: 4.45 | ISO 9001:2008 Certified Journal
| Page 2243
decision table majority classifier. The output will show a decision on a number of attributes for each instance. It evaluates feature subsets using best-first search and can use cross-validation for evaluation.
This paper show how clustering and classification approach gives better results than Approri algorithm. There are several clustering algorithm exist in research but k-mean algorithm popular because of its simplicity for implementation and capability to produce good results. Cluster analysis or clustering is the task of assigning a set of objects into groups (called clusters) so that the objects in the same cluster are more similar to each other than to those in other clusters. It is a partitioning based approach which divides dataset into predefined k partition known as clusters which have minimum intra cluster using Manhattan distance. Although it is a basic algorithm but it has some shortcomings such as the result of the algorithm mostly depends upon initial value of centroid chosen for each cluster the other drawback is in error function of k-mean where several minima is are possible and can easily fall to local minima [4][5]. So aim of this paper is to give classification and clustering together with certain improvement in k-mean clustering [3]. The paper is organized in multiple sections where section 2 describes simple k-mean clustering and classification and talks about limitation and advantages of k-mean. Section three describes the proposed work. Section four shows the results and discussion. Section five shows the conclusion and future scope.
2. RELATED WORKS
Web mining is the technique of data mining into the documents on the World Wide Web. The overall process is the mining extraction of information from the World Wide Web. The extracted information should be reliable for administrator. Xiao J. et al. [2001] focused on the user
behaviour between client and server. To differentiate the nature of different user, they use session, so there will be automatically updating and deletion of user behaviour. Bommepally K. et al. [2010] author describes that web-based tool is proposed to analyses the Internet activity. Next, step is to collect the data from a proxy server at a campus-wide network. Traffic Rates of different types of users are studied. Finally, the paper concludes with different strategies for monitoring and control of traffic. Grace L. et al.[2011] author gives a detailed discussion about the log files, their formats, their creation, access procedures, their uses, various algorithms used and the additional parameters that can be used in the log files which in turn gives way to an effective mining. It also provides the idea of creating an extended log file and learning the user behaviour.
© 2016, IRJET | Impact Factor value: 4.45 | ISO 9001:2008 Certified Journal
| Page 2244
3. PROPOSED METHODOLOGY
In this study, we firstly collect user history from the log file with the help of college administrator. By analysis all of their traffic rates, we built up 15 categories on the basis of their pattern.
After collection of dataset, preprocessing and data cluster was performed in which k-mean clustering algorithms used is discussed below
K-mean clustering uses two different distance formulas Manhattan distance formulas-: To compute the absolute differences between coordinates of pair of objects.
=
Euclidian distance formula:- Euclidean metric is the
"ordinary" (i.e. straight-line) distance between two points in
Steps of k-mean algorithm:
Choose randomly k data objects from given dataset
which works as centroid for k clusters initially.
Compute distance of each data object from k
centroids and then allocate each data object to the closest cluster with minimum centroid distance.
Compute new centroid for each cluster by taking
mean of the all data objects belonging to particular
cluster. Calculate the total mean-square
quantization error function. If error function reduces from previous one than these centroids will work as new centroids.
Repeat step 2 and 3 until error function get
constant [12].
a. Classification Accuracy
Classification gives better result in single node of data. For better use of classification, we divide the log into small node. Bayes net classification:- Bayes net classification works on
the basis of problistic directed acyclic graph. The primary goal of classification for measuring performance is to determine the percentage of test samples that are correctly classified. The parameters on which Accuracy depend upon are: Success: Instance`s class are correctly defined. Error: Object instance are incorrectly defined. Error rate: proportion of errors made over the complete set of instances Accuracy: proportion of correctly classified instances over the complete set of instances
Accuracy=1-error rate
b. Prediction Accuracy
Prediction can be viewed as a type of classification. The prediction accuracy is given by:
Accuracy = 1 – error rate
c. Runtime
The serial runtime of a program is the time elapsed between the beginning and the ending of execution on a sequential computer.
d. Precision and Recall
© 2016, IRJET | Impact Factor value: 4.45 | ISO 9001:2008 Certified Journal
| Page 2245
which were not labelled as belonging to that class but should have been).
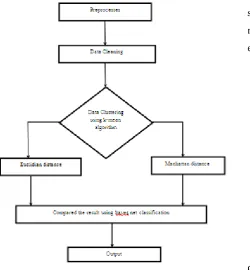
There are following steps shows the pseudo codes for the proposed framework.
1. The very first step is preprocessing of data. In this step we choose the attributes which we used for applying the algorithm. In this we cleansed the data into proper format.
2. Second step of proposed technique is to apply k-mean algorithm on the unsupervised data.
3. While using k-mean algorithm in weka tool, we have firstly calculated distance by using the Euclidian distance.
4. Next step is to change the distance formula from Euclidian to Manhattan distance.
[image:4.595.54.305.404.675.2]5. Now we have to impose the bayes net classification on the results of visualization logs of distance formulas.
Fig. 1: Proposed Methodology
4. RESULT AND DISCUSSION
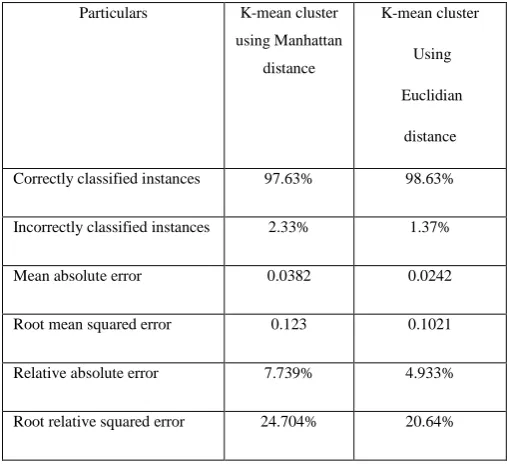
In very first section results would be based upon the classification accuracy: From the Table 1, it can be inferred that while comparing the k-mean algorithm using manhattan and euclidian distances So, Bayes network was used to data classification. Correctly classification instances were higher in k-mean using Euclidian (98.622%) than k-mean using Manhattan distances (97.633%). In second section results would be based upon the prediction accuracy: Similarly the average magnitude of error measure by mean absolute error (MAE) was higher in k-mean using manhattan distance (0.217) as compared to Euclidian distance. The accuracy of both distances was again calculated while using the criteria of root mean square error (RMSE), while inferred that RMSE of (.265) as compared to k-mean (.2771). From the above discussion it can be concluded that k-mean using Euclidian distance is accurate and measure in data classification. Next step is to pre-process data against null values followed by normalization and prioritize dataset attribute according to expert knowledge [1].
Fig. 2:
Results of k-mean algorithm using Euclidian
© 2016, IRJET | Impact Factor value: 4.45 | ISO 9001:2008 Certified Journal
| Page 2246
Fig. 3:
Results of k-mean algorithm using Manhattan
[image:5.595.29.283.425.658.2]distance
Table 1:
Comparison of results by k-mean using
Euclidian and Manhattan distance
Particulars K-mean cluster using Manhattan
distance
K-mean cluster
Using
Euclidian
distance
Correctly classified instances 97.63% 98.63%
Incorrectly classified instances 2.33% 1.37%
Mean absolute error 0.0382 0.0242
Root mean squared error 0.123 0.1021
Relative absolute error 7.739% 4.933%
Root relative squared error 24.704% 20.64%
5. CONCLUSION AND FUTURE SCOPE
Data mining techniques are very useful in web proxy logs, by using the technique we can easily auditing and logging the personal information of the user. This help to find the hidden knowledge in log files. We use this method in education institute to reduce the malicious activity. By using this we enhance the usability of internet and also enhance the security of individual. To meet the goal we use the approri algorithm and k mean algorithm.
References
[1] Act of Computer Crime 2007. Available at
http://advocacy.globalvoicesonline.org/
[2] V.J. Hodge and J. Austin, A Survey of Outlier Detection Methodologies,
Arti�cial Intelligence Review, 22:85–126, 2004.
[3] F. Gao and C. Wu, Mining frequent itemset from uncertain data, in Proceedings of 2011 International Conference on Electrical and Control Engineering, Yichang, China, Sept 16-18, pp. 2329-2333.
[4] J. Zhou, J. Yu and L. Xiong, Efficient Association Rule Mining for Web Application Anomaly Detection, in Proceedings of 2012 International Conference on Electrical and Computer Engineering, Dhaka, Bangladesh, December 2012, pp.370 – 375.
[5] Z. He, X. Xu, J. Z. Huang and S. Deng, A Frequent Pattern Discovery Method for Outlier Detection, in Proceedings of 5th International Conference on Advances in Web-Age Information Management (WAIM), Dalian, China, July 15-17, 2004, pp. 726–732.
[6] I.H. Witten, E. Frank, and M.A. Hall, Apriori algorithm, Data Mining: Practical Machine Learning Tools and Techniques, 3rd edition,Morkan
Kaufman, 2011.
[7] J. Han, J. Pei and Y. Yin, Mining Frequent Patterns without Candidate Generation”, in Proceedings of the 2000 ACM International Conference on SIGMOD, Dallas, Texas, USA.
© 2016, IRJET | Impact Factor value: 4.45 | ISO 9001:2008 Certified Journal
| Page 2247
Discovery and Data mining (KDD), August 24-27, 2003, Washington, DC,USA, pp 336 – 345.
[9] W. Premchaiswadi and W. Romsaiyud, Extracting WebLog of Siam University for Learning User Behavior on MapReduce, in Proceedings of the 4th International Conference on Intelligent and Advanced Systems, June 12-14, 2012, Kuala Lumpur, Malaysia, pp. 149-154.
[10] Weka 3: Data Mining Software in Java. Available at http://www.cs.waikato.ac.nz/ml/weka/
[11] S. Egan and B. Irwin, An Evaluation of Lightweight Classi�cation Methods for Identifying Malicious URLs, Proceedings of the 2011 Conference on Information Security for South Africa, 15 – 17 August, Johannesburg, South Africa.
[12] K.. Bommepally, T.K. Glisa, J. J. Prakash, S. R. Singh and H. A Murthy, Internet Activity Analysis Through Proxy Log, Proceedings of National Conference on Communications, January 2010, Chennei, India.