Characterization of the MODY3 phenotype.
Early-onset diabetes caused by an insulin
secretion defect.
M Lehto, … , M R Taskinen, L Groop
J Clin Invest.
1997;
99(4)
:582-591.
https://doi.org/10.1172/JCI119199
.
Maturity-onset diabetes of the young (MODY) type 3 is a dominantly inherited form of
diabetes, which is often misdiagnosed as non-insulin-dependent diabetes mellitus (NIDDM)
or insulin-dependent diabetes mellitus (IDDM). Phenotypic analysis of members from four
large Finnish MODY3 kindreds (linked to chromosome 12q with a maximum lod score of 15)
revealed a severe impairment in insulin secretion, which was present also in those
normoglycemic family members who had inherited the MODY3 gene. In contrast to patients
with NIDDM, MODY3 patients did not show any features of the insulin resistance syndrome.
They could be discriminated from patients with IDDM by lack of glutamic acid
decarboxylase antibodies (GAD-Ab). Taken together with our recent findings of linkage
between this region on chromosome 12 and an insulin-deficient form of NIDDM (NIDDM2),
the data suggest that mutations at the MODY3/NIDDM2 gene(s) result in a reduced insulin
secretory response, that subsequently progresses to diabetes and underlines the
importance of subphenotypic classification in studies of diabetes.
Research Article
Find the latest version:
J. Clin. Invest.
© The American Society for Clinical Investigation, Inc. 0021-9738/97/02/0582/10 $2.00
Volume 99, Number 4, February 1997, 582–591
Rapid Publication
Characterization of the MODY3 Phenotype
Early-Onset Diabetes Caused by an Insulin Secretion Defect
Markku Lehto,* Tiinamaija Tuomi,* Melanie M. Mahtani,‡ Elisabeth Widén,‡ Carol Forsblom,§ Leena Sarelin,¶
Monika Gullström,** Bo Isomaa,¶ Mikko Lehtovirta,§ Auli Hyrkkö,§ Timo Kanninen,* Marju Orho,* Sue Manley,§§
Robert C. Turner,§§ Thomas Brettin,‡ Andrew Kirby,‡ Jeffrey Thomas,iGeoffrey Duyk,iEric Lander,‡‡‡ Marja-Riitta Taskinen,§
and Leif Groop*
*Department of Endocrinology, Wallenberg Laboratory, University of Lund, Malmö University Hospital, S-20502 Malmö, Sweden; ‡Whitehead Institute for Biochemical Research, Cambridge, Massachusetts 02142; §Department of Medicine, Helsinki University Hospital, FIN-00130 Helsinki, Finland; iMillenium Pharmaceuticals Inc., Cambridge, Massachusetts 02139; ¶Jakobstad Primary Care Center, FIN-68601 Jakobstad, Finland; **Närpes Primary Care Center, FIN-64200 Närpes, Finland; ‡‡Department of Biology, Massachusetts Institute of Technology, Cambridge, Massachusetts 02139; and §§Nuffield Department of Clinical Medicine, Diabetes Research Laboratories, Oxford OX2 6HE, United Kingdom
Abstract
Maturity-onset diabetes of the young (MODY) type 3 is a
dominantly inherited form of diabetes, which is often
misdi-agnosed as non–insulin-dependent diabetes mellitus (NIDDM)
or insulin-dependent diabetes mellitus (IDDM). Phenotypic
analysis of members from four large Finnish MODY3
kin-dreds (linked to chromosome 12q with a maximum lod score
of 15) revealed a severe impairment in insulin secretion, which
was present also in those normoglycemic family members
who had inherited the MODY3 gene. In contrast to patients
with NIDDM, MODY3 patients did not show any features
of the insulin resistance syndrome. They could be
discrimi-nated from patients with IDDM by lack of glutamic acid
decarboxylase antibodies (GAD-Ab). Taken together with our
recent findings of linkage between this region on
chromo-some 12 and an insulin-deficient form of NIDDM (NIDDM2),
the data suggest that mutations at the MODY3/NIDDM2
gene(s) result in a reduced insulin secretory response, that
subsequently progresses to diabetes and underlines the
im-portance of subphenotypic classification in studies of
diabe-tes. (
J. Clin. Invest.
1997. 99:582–591.) Key words:
matu-rity-onset diabetes of the young
•non–insulin-dependent
diabetes mellitus
•insulin deficiency
•insulin sensitivity
•genetics
Introduction
Non–insulin-dependent diabetes mellitus (NIDDM)1 is a
het-erogeneous disorder with a complex pattern of inheritance; it generally becomes manifest after 40 yr of age and is
charac-terized by both impaired b cell function and insulin resistance (1–3). The relative contribution of these two defects to the manifestation of diabetes is still a matter of debate (4), but may vary among populations. While insulin resistance seems to predominate in some populations (i.e., Native American– derived) (5, 6), impaired b cell function may be more preva-lent in others (i.e., Scandinavian) (2, 7).Part of this heteroge-neity could be explained by admixture of different diabetic subtypes.
In contrast to adult-onset NIDDM, maturity-onset diabetes of the young (MODY) shows clear dominant inheritance, early onset (z 25 yr) and high penetrance (8). MODY is
thought to account for , 5% of all cases with diabetes. How-ever, its true prevalence is unknown due to the lack of distin-guishing phenotypes and cloned genetic loci for most of the MODY subtypes.
MODY itself is heterogeneous. Three distinct forms of MODY have been genetically mapped, and based upon the existence of MODY families unlinked to any of these chromo-some regions, other MODY genes remain to be identified. The rare MODY1 has been linked to a region near the adenosine deaminase (ADA) locus on chromosome 20 in a single large family (9). No gene has been identified yet due to the small number of MODY1 cases described. The mild MODY2 phe-notype is one of hyperglycemia rather than diabetes per se and can be caused by several mutations in the glucokinase gene (GK) on chromosome 7 (10). Glucokinase is essential for glu-cose metabolism in the b cell; some mutations in the glucoki-nase gene reduce the affinity of the enzyme for glucose result-ing in a small increase in the plasma glucose concentrations (11). While this subtype accounts for 60% of MODY in France (12), it is less prevalent elsewhere (13, 14). Recently, MODY3 was identified by linkage to a region on the long arm of chro-mosome 12 (15). Other than its chrochro-mosome 12 linkage, little
Address correspondence to Markku Lehto, Department of Endocri-nology, Wallenberg Laboratory (Entrance 46), MAS, 20502 Malmö, Sweden. Phone: 46-40-337215; FAX: 46-40-337042.
Received for publication 20 September 1996 and accepted in re-vised form 6 December 1996.
clinical phenotypic information has been available to distin-guish MODY3 from NIDDM or insulin-dependent diabetes mellitus (IDDM).
With the goal of carrying out genetic studies of NIDDM, we established the Botnia study in 1990 to identify multiplex families with diabetes in an isolated population on the western coast of Finland (near the Gulf of Botnia) (16). About 5,000 individuals, including 1,230 patients with diabetes from 600 families, have been studied to date. From this family collec-tion, we identified four large multigenerational families with early-onset diabetes linked to chromosome 12 (MODY3).
[image:3.612.58.530.215.734.2]Be-cause of the unusually large size of these MODY3 families, and our early observation that the phenotype in these families differed from that in common adult-onset NIDDM, we set out to characterize in detail the clinical and metabolic phenotype of MODY3, and to phenotypically distinguish MODY3 from NIDDM and IDDM. Further, since we recently mapped a form of adult-onset NIDDM (NIDDM2; also associated with insulin deficiency but with an average age at onset of 58 yr) to precisely this region of chromosome 12 (17), this study may help to establish whether the defects in MODY3 and NIDDM2 are caused by different alleles of the same gene.
Methods
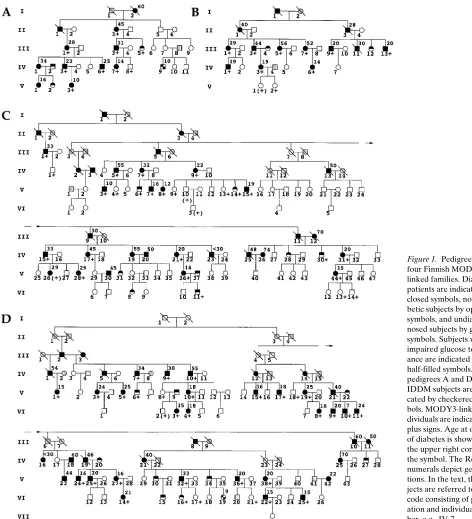
Subjects.NIDDM families were studied from the Botnia region in Western Finland (16). In four large families diabetes (defined accord-ing to World Health Organization [WHO] criteria) was expressed at early age (at least two patients with onset younger than 25 yr) and transmitted in an autosomal dominant fashion fulfilling the criteria for MODY (Fig. 1). Family A was ascertained initially as a relatively small pedigree that was later extended to include more distantly related family members once the preliminary analysis provided support for linkage to chromosome 12. Most diabetic patients in pedigree A (II-3, III-1, III-3, IV-3, IV-6, IV-7, and V-3) shared a common phenotypic profile which consisted of (a) low fasting insulin (4.161.1 mU/liter) and C-peptide (0.3560.11 nmol/liter) levels and low insulin (incre-mental area under curve 10496537 mU/liter) and C-peptide (incre-mental area under curve 27.6612.5 nmol/liter) responses to oral glu-cose tolerance test (OGTT); (b) normal body mass index (BMI; 22.863.8 kg/m2); and (c) lack of glutamic acid decarboxylase
antibod-ies (GAD-Ab). However, as the family was extended, a few diabetic patients (IV-1, V-1, and IV-9) were identified that did not fit this clin-ical profile. Specifclin-ically, patients IV-1 and V-1 were obese (BMI 28.3 and 33.9 kg/m2, respectively) and had high fasting insulin (18.8 and
40.8 mU/liter) and C-peptide levels (1.14 and 1.29 nmol/liter). Patient IV-9, who was insulin-treated since diagnosis, was lean (BMI 18.6 kg/m2)
and displayed high titers of GAD antibodies and undetectable C-pep-tide levels. We considered patients IV-1 and V-1 to represent com-mon NIDDM and patient IV-9 to have IDDM. When these three pa-tients were genotyped, they were found not to share the copy of chromosome 12 coinherited by the seven other diabetics in family A.
Families B, C, and D were ascertained z 1 yr after family A (Fig. 1).
These families were initially identified as containing several diabetic patients with young age at onset, and similarly extended. Families B, C, and D all originated from an area of Botnia geographically distinct from that of family A.
In total, we examined 230 (74 diabetic and 156 nondiabetic) sub-jects from four families. Since no phenotypic heterogeneity was de-tected between the MODY3 families with respect to age at onset, BMI, glucose, and insulin values, the families were analyzed together. The clinical profile of the 57 patients (MODY3 patients) who had in-herited the MODY3-chromosome (See Results, MODY3 haplotype and segregation) was compared with that of the 12 patients not inher-iting the MODY3-chromosome (NIDDM patients). The two GAD-Ab positive subjects (A; IV-9 and D; VI-19) considered to have IDDM were excluded from the analysis. Since the group of NIDDM patients was relatively small, we also compared the MODY3 pheno-type in these families with that of 1,068 NIDDM patients from the Botnia Study (Table I, Botnia NIDDM). Similarly, we compared non-diabetic individuals with the MODY3 chromosome (MODY3 carri-ers; n5 18) with nondiabetic family members not inheriting this copy of chromosome 12 (Family controls; n5 138) and age-matched con-trols from the Botnia study (Botnia controls; n5 92) (Table I).
[image:4.612.58.562.393.705.2]Measurements. A standard (75 gram) OGTT was performed after 12 h of overnight fasting. For subjects , 12 yr of age or with fasting blood glucose (FBG) . 10 mmol/liter, only fasting samples were ana-lyzed. For the MODY3 families OGTT was performed for 158 of 227 family members. Blood samples for the determination of blood glu-cose, serum insulin, and C-peptide were drawn at 210, 0, 30, 60, and 120 min; and for plasma proinsulin (PI) 210, 0, and 120 min. Fasting blood samples were also drawn for the measurements of GAD-Ab, glycohemoglobin (HbA1c), serum total cholesterol, HDL2 and HDL3
Table I. Clinical Characteristics of Diabetic and Nondiabetic Subjects
Diabetic patients Nondiabetic patients
Botnia
NIDDM P value
MODY3
patients P value
NIDDM patients
Botnia
controls P value
MODY3
carriers P value
Family controls
Subjects (M/F) 1068 (466/602) 57 (27/30) 12 (5/7) 92 (42/50) 18 (8/10) 138 (68/70) Age (yr) 69611 43617 0.012 57618 3367 29614 0.001 43616
Age at onset (yr) 60612 0.001 26612 0.001 50618 — — —
Duration (yr) 8.167.2 , 0.0001 18.0612.3 , 0.0001 8.669.7 — — — BMI (kg/m2) 28.164.7 , 0.001 24.864.2 , 0.001 29.064.1 23.963.2 0.001 20.963.8 0.001 25.864.6
Fat mass (%) 0.3060.07 0.2660.08 0.3460.05 0.2560.07 0.2360.07 0.02 0.2860.07 WHR (Males) 0.9860.06 0.9660.07 1.0160.01 0.9160.06 0.9560.07 0.9960.04 (Females) 0.8860.07 0.8660.07 0.9560.09 0.8160.05 0.8560.05 0.8560.07 HbA1c (%) 8.962.0 8.061.6 8.562.0 5.260.4 0.007 5.560.3 5.560.5
FBG (mmol/l) 8.662.8 , 0.005* 8.462.7 8.662.9 4.860.4 , 0.004* 4.460.5 , 0.004* 4.860.5 2h-Glucose (mmol/l) 14.465.1 13.363.9 15.266.8 5.060.9 0.0001 6.561.4 0.0001 5.561.4 Glucose area 6236225 5986174 6436198 109698 0.001 3076121 0.001 2036144 FS-Insulin (mU/liter) 16.2613.6 , 0.001* 11.2619.9 , 0.001* 22.8616.1 6.663.3 , 0.003* 4.762.1 , 0.003* 7.966.0 Insulin area 511064400 , 0.002* 13306900 , 0.002* 467063270 401462432 , 0.0001* 20106880 , 0.0001 527064810 FS-C-Peptide (nmol/liter) 0.6560.41 0.3660.16 , 0.01* 1.0660.47 0.3160.16 , 0.01* 0.3960.17, 0.01* 0.5760.29 Cholesterol (mmol/liter) 5.9761.26 , 0.05 5.3061.12 6.0161.14 4.8060.87 4.7960.88 5.2461.15 S-TRIGL (mmol/liter) 2.0461.41 , 0.02* 1.2660.64 1.7460.66 1.0060.52 0.9260.30 1.1760.79 HDL-CHOL (mmol/liter) 1.2460.33 1.4460.28 1.2160.28 1.4860.31 1.4760.25 1.4060.34 HDL2-CHOL (mmol/liter) 0.4260.23 0.5060.22 0.3460.10 0.6060.25 0.5260.18 0.4560.23 HDL3-CHOL (mmol/liter) 0.8260.17 0.9460.15 0.8760.20 0.8860.17 0.9460.11 0.9660.17 Systolic BP (mmHg) 149621 129616 142623 118611 120614 130617 Diastolic BP (mmHg) 82611 7969 79612 7268 7369 7969
GAD-Ab positives (n) 98 (10%) 0 0 4 (4.3%) 0 1 (0.7%)
cholesterol, and triglyceride concentration. Fat mass was measured with infrared spectroscopy from the outer layer of the biceps on the dominant arm using a Futrex 5000 device (Futrex Inc., Gaithersburg, MD). Body weight and height were measured with subjects in light clothing without shoes. In determination of waist-to-hip ratio, waist circumference was measured with a soft tape on standing subjects midway between the lowest rib and the iliac crest, and hip circumfer-ence was measured over the widest part of the gluteal region. Three blood pressure recordings were obtained after 30 min of rest at 5-min intervals from the right arm of a sitting person. The coefficients of variation (CV) of the three systolic and diastolic blood pressure mea-surements were 4 and 5.9%, respectively.
Measurements of insulin secretion and insulin sensitivity. Insulin secretion was also measured in response to an intravenous glucose tolerance test (IVGTT) and insulin sensitivity during a euglycemic hyperinsulinemic clamp. Moreover, to obtain independent measure-ments of insulin secretion and insulin sensitivity during the same test, we performed these two tests in a sequential manner during the same day in a subset of subjects (Botnia clamp). In brief, 0.3 g/kg body weight of a 50% glucose solution was given intravenously at time 0. After 60 min, an infusion (infusion rate of 45 mU/m2) of short-acting
human insulin (Actrapid; Novo Nordisk, Gentofte, Denmark) was started and continued until 180 min. Blood samples for the measure-ment of blood glucose were obtained at 210, 0, 2, 4, 6, 8, 10, 20, 30, 40, 50, and 60 min after which they were obtained at 5-min intervals throughout the euglycemic clamp. A variable infusion of 20% glucose was started to maintain the blood glucose concentration unchanged at 5.5 mmol/liter with a CV of 6%. Blood samples for the measure-ment of insulin were drawn at 210, 0, 2, 4, 6, 8, 10, 20, 30, 40, 50, 60, 120, 170, and 180 min. The incremental trapezoidal area during the first 10 min of the test was called the first phase insulin secretion, and during the 10–60 min period it was called the late phase insulin secre-tion. Insulin sensitivity was calculated from the rate of glucose infu-sion during the last 60 min of the euglycemic clamp and expressed per kilogram of lean body mass. In 10 patients we performed paired tests comparing the Botnia clamp with a similar euglycemic clamp without prior intravenous injection of glucose. The two tests corre-lated strongly (r 5 0.94; P 5 0.0001), although the Botnia clamp gave on average 7% higher rates of glucose infusion than the euglycemic clamp.
Assays. Blood glucose during the OGTT was measured on dupli-cates with a hexokinase method with a CV of , 1% (Boehringer Mannheim, Mannheim, Germany). Plasma glucose during the
eugly-cemic clamp was measured with a glucose oxidase method using a Beckman Glucose Analyzer II (Beckman Instruments, Fullerton, CA). Serum insulin concentrations were measured with a double antibody radioimmunoassay (Pharmacia, Uppsala, Sweden) with an interassay CV of 5%. Plasma C-peptide concentrations were measured in dupli-cates by radioimmunoassay with an interassay CV of 9% (18). Plasma PI concentrations were measured in duplicates by ELISA using mu-rine monoclonal antibodies, PEP-001 and HUI-001 (Novo Nordisk, Bagsvaerd, Denmark), with an interassay CV of 12% at 6.9 pmol/li-ter, 8% at 16.8 pmol/lipmol/li-ter, and 6.7% at 63.2 pmol/liter. The ELISA cross-reacts with split 32-33 PI, des (32, 33) PI, and split 65-66 PI. GAD-Ab were determined by a modified radiobinding assay using
35S-labeled recombinant human GAD65 (19, 20). HbA
1c
concentra-tions were measured by high pressure liquid chromatography. The reference values for the assay were 5–7%. Serum total cholesterol, HDL subfractions (after precipitation), and triglyceride concentra-tions were measured on a Cobas Mira analyzer (Hoffman LaRoche, Basel, Switzerland).
PCR and gel conditions. Four families were tested for three known MODY candidate regions: 18 polymorphic markers on chromosome 12 (Fig. 2), one marker on chromosome 20 (ADA locus) (21), and two markers on chromosome 7 (glucokinase gene) (22, 23). For haplotype analysis of the MODY3 chromosomes, eight additional markers were genotyped on chromosome 12 (Table II). The PCR were carried out in a volume of 20 ml containing 25 ng of genomic DNA (isolated from peripheral blood lymphocytes), 16 mM ammoniumsulphate, 67 mM Tris-HCl (pH 8.8), 0.01% Tween 20, 1.5 mM MgCl2, 200 mM dNTP,
3 pmol of phosphorylated ([32P]g-dATP; Amersham International,
Buckinghamshire, United Kingdom) primer I, 3 pmol of primer II, and 0.5 U AmpliTaq DNA-polymerase (Perkin Elmer, Branchburg, NJ). PCR was initiated with denaturation at 948C for 5 min, followed by 30 cycles of denaturation at 948C for 30 s, annealing at 558C for 30 s, extension at 728C for 30 s, and a final extension at 728C for 10 min. PCR products were mixed 1:1 with sample buffer (95% formamide, 20 mM EDTA, 0.05% bromophenol blue, 0.05% xylene cyanol) be-fore denaturing gel electrophoresis (5% acrylamide/bisacrylamide 19:1, 7 M urea, 13 TBE).
[image:5.612.57.392.513.736.2]Linkage analysis. Given the evidence for multiple types of diabe-tes in family A we wanted to refine the MODY3 phenotype for the purpose of linkage analysis. Based on the phenotype of MODY3 patients in family A we predicted the phenotype in families B, C, and D. Thus, individuals were considered affected if they had both di-abetes (as defined by the WHO criteria) and low stimulated insulin
levels (, 25 mU/liter at the 30 min time point during the OGTT). Subjects with either a history of diabetes or impaired glucose toler-ance, or who were young (, 35 yr of age at OGTT) were considered of unknown affectation. Of the remaining subjects, those with normal glucose tolerance were considered unaffected.
We used a linkage model with disease allele frequency of 0.01, and assuming autosomal dominant inheritance, with equal female and male recombination rates. The penetrances for homozygous nor-mal, heterozygous, and homozygous MODY3 were 0.003, 0.90, and 0.90, respectively, giving a phenocopy rate among those affected of z 1.7%. In a separate test for linkage of NIDDM only (as defined by the WHO), the penetrance of the homozygous normal was raised to 0.03, increasing the phenocopy rate to z 17%. Allele frequencies used were calculated based on the originals in the four large families (n 5 108 individuals), together with 20 unrelated normoglycemic Bot-nia controls, genotyped as part of an earlier study (total n 5 256 chro-mosomes) (17).
Linkage to the MODY1 and MODY2 regions was tested using the marker ADA (known to be linked to MODY1) and two markers in the MODY2 glucokinase gene (GCK-A and GCK-P), respectively.
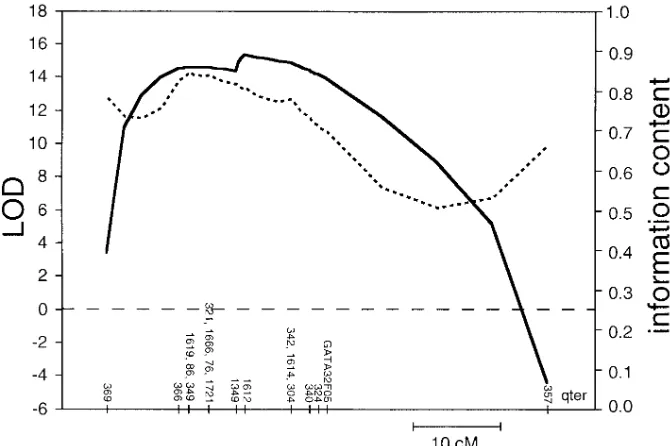
The genetic map of the MODY3 region was based on a subset of 17 markers from the Genethon map and one CHLC marker (GATA32F05). The Genethon loci were ordered at odds of . 1,000:1 (with the exception of the three sets of loci shown in Fig. 2, which are genetically inseparable; and the markers D12S1349 and D12S1612, which are 1 cM apart, and whose order may be inverted). The genetic distances (in cM) used in the MODY3 map are those published: D12S369 (8) D12S366 (1) D12S1619 / D12S86 / D12S349 (2) D12S321 / D12S1666 / D12S76 / D12S1721 (3) D12S1349 (1) D12S1612 (5) D12S1614 / D12S304 / D12S342 (2) D12S340 (1) -D12S324 - (1) - GATA32F05 - (23) - D12S357. This marker order is consistent with our own radiation hybrid mapping of these loci (data not shown) and with the order used in our earlier study of a distinct panel of Botnia families (17).
Multipoint linkage analysis of the MODY3 phenotype to each of the three known MODY regions was performed using the GENE-HUNTER program (24). We selected GENEGENE-HUNTER due to its ca-pacity to analyze inheritance information at many loci simulta-neously. (Nonetheless, two- or three-point lod scores obtained with the FASTLINK program were similar to those calculated using GENEHUNTER.) To accommodate the pedigree size limitations of GENEHUNTER, pedigrees C and D were divided into nonoverlap-ping branches that could be analyzed separately. Pedigree C was di-vided into three branches of two, five, and six affected individuals each, and pedigree D was divided into four branches of two, four, seven, and nine affected individuals each. For both families, scores for each branch were summed to find the total LOD score of each pedigree. Because dividing the pedigrees into branches results in some loss of power, the family totals will underestimate the true LOD scores of both pedigrees.
GENEHUNTER was also used to haplotype individuals in the four pedigrees across the MODY3 region. For each pedigree, GENE-HUNTER calculates the probability distribution over all possible in-heritance vectors for a set of markers, then assigns haplotypes to indi-viduals based upon observed genotypes and maximum likelihood estimates of missing information. Families were again divided into branches that could be analyzed separately.
Statistical analysis. Data are expressed as mean6SD or SEM. Since insulin and PI concentrations were not normally distributed, in the text we have also presented data for insulin and PI as medians [in-terquartile range (75–25%)]. Differences between groups were tested with analysis of covariance with age, BMI, and duration of diabetes as covariates using a SOLO statistical package (Biomedical Data Pro-cessing, Los Angeles, CA). To adjust for multiple comparisons when ANOVA showed a significant difference between groups (P , 0.05), Fisher LSD post-hoc test was used to identify which group differ-ences accounted for the significant P value. The P value shown is the smallest one with which all group differences detected at 0.05 level were still present.
Results
[image:6.612.56.298.86.455.2]Linkage analysis and heterogeneity in MODY3 families. No linkage was detected to either MODY1 or MODY2, as evi-denced by negative lod scores between the diabetic phenotype (as described above) and each of the markers tested (data not shown). Genotypic data were analyzed for 18 markers throughout the MODY3 region on chromosome 12q. We ob-tained highly significant support for linkage to MODY3 when all four families were analyzed together. The lod score through-out the region D12S366-GATA32F05 was consistently high (Z . 14), and maximal at marker D12S1612 (Z 5 15.29, Fig. 2). When NIDDM was used as a phenotype, the maximal lod score was slightly lower (Z 5 13.10 at D12S1612; see Meth-ods). The individual maximum likelihood family lod scores
Table II. Comparison of MODY3 Haplotypes between Four MODY3 Families
Genetic
distance (cM) Marker
Family
A B C D
D12S366 K N K M
1
D12S86 J K S K
D12S349 I E D E
D12S1619 F F C F
2
D12S76 E F D F
D12S321 A D C D
D12S395 F B F B
D12S1666 A B D B
D12S1721* B C C C
PLA2* F F F F
2
GATA32A10 E D D D
GGAT1E2 B E E E
D12S378 E B B B
D12S807 D G G G
D12S820 D C C C
D12S837 C F F F
D12S1349 I B B B
D12S1612 V M M M
5
D12S304 D E E D
D12S342 U U U T
D12S1614 B F F A
2
D12S340 E E E E
1
D12S324 B B B —
were Z 5 1.98, 2.55, 3.49, and 7.46 for families A, B, C, and D, respectively.
MODY3 haplotype and penetrance. The three families (B, C, and D) that originated from the same region of Botnia shared a conserved haplotype carrying 10 identical alleles across the MODY3 region supporting a role for a common mutation in these families (Table II). The chromosome 12 hap-lotype shared in family A (Table II) differed from the con-served haplotype shared by the other families suggesting seg-regation of a MODY3 allele of distinct mutational origin. These two chromosome 12 haplotypes are hereafter referred to as the MODY3-chromosome. As there were no obvious phenotypic differences between MODY3 patients from family A and those from families B, C, and D (see below), the four families were pooled to analyze penetrance.
The large size of this data set (57 affected individuals in four families) makes it useful for estimating the penetrance of MODY3. The phenotype defined in this study (NIDDM asso-ciated with impaired insulin secretion) had a penetrance of 76% by age 30–40 yr among individuals carrying the MODY3-chromosome, and did not substantially increase with age. With a broader phenotype (17), including as affected individuals, those with either a history of diabetes or an impaired glucose tolerance, the penetrance was slightly higher (85%).
Clinical characteristics of MODY3 patients. To extend the families, we screened all primary relatives of MODY3 patients by OGTT. In this screening process, we diagnosed 12 diabetic patients of whom 8 had inherited the MODY3-chromosome. Thus, 31% of MODY3 carriers were diagnosed with diabetes at screening, compared with 3% of the noncarriers. MODY3 patients had clearly lower age at onset of diabetes than NIDDM patients (26612 vs. 57618 yr; P5 0.001) (Table I). However, in 26% of them diabetes was diagnosed after 30 yr of age. Of 29 diabetic women with the MODY3-chromosome, 11 (38%) have had gestational diabetes during pregnancy compared with none of the diabetic women (n5 7) without the MODY3-chromosome. Despite the marked difference in age at onset of diabetes, mode of treatment did not differ be-tween the MODY3 patients and the Botnia NIDDM patients: diet (35 vs. 44%), oral hyperglycemic agents (25 vs. 23%), and insulin (40 vs. 33%).
The MODY3 patients had a lower BMI (P, 0.001) than NIDDM patients from the same families. Glycemic control as judged from FBG and HbA1c concentrations did not
[image:7.612.58.401.352.737.2]signifi-cantly differ between the MODY3 patients, NIDDM patients, and Botnia NIDDM patients. None of the MODY3 patients was GAD-Ab positive compared with 10% (98/1001) of the Botnia NIDDM patients.
The most dramatic distinction between the MODY3 pa-tients and NIDDM papa-tients in these families was the severe impairment of insulin secretion observed both as decreased fasting (6.2 [7.2] vs. 19.0 [20.9] mU/liter; P, 0.001) and incre-mental (1,293 [1,092] vs. 4,278 [6,056] mU/liter; P, 0.002) in-sulin concentrations during the OGTT (Fig. 3). The MODY3 patients had also significantly lower fasting (6.2 [7.2] vs. 12.6 [11.2] mU/liter; P, 0.001) and incremental (1,293 [1,092] vs. 3,780 [4,411] mU/liter; P, 0.002) insulin concentrations when compared with the Botnia NIDDM patients. MODY3 patients also had lower PI concentrations at fasting (6.9 [10.4] vs. 30.5 [41.8] pmol/liter; P5 0.0001) and 2 h after OGTT (23.2 [17.2] vs. 99.6 [87.1] pmol/liter; P5 0.008) compared with NIDDM patients.
Clinical characteristics of the MODY3 carriers.The nondi-abetic MODY3 carriers (n5 18) were younger (P5 0.001) and had a lower BMI (P5 0.001) and fat mass (P5 0.02) and a greater glucose area during OGTT (P5 0.001) than the fam-ily controls (Table I, Fig. 3). Of note, the MODY3 carriers had significantly lower fasting (4.8 [2.0] vs. 6.4 [5.0] mU/liter; P,
0.003) and incremental (1,936 [1,290] vs. 3,994 [3,115] mU/liter;
P, 0.0001) insulin concentrations compared with the family controls. The MODY3 carriers also had significantly lower fasting (4.8 [2.0] vs. 5.8 [4.4] mU/liter; P, 0.003) and incre-mental (1,936 [1290] vs. 3,612 [2600] mU/liter; P, 0.0001) in-sulin concentrations when compared with Botnia controls.
Fasting PI concentrations (4.4 [2.4] vs. 7.2 [7.0] pmol/liter) were also lower in MODY3 carriers compared with family controls (P5 0.027), whereas the difference in 2-h PI concen-trations (23.9 [25.7] vs. 47.4 [47.3] pmol/liter) did not reach sta-tistical significance (P5 0.07).
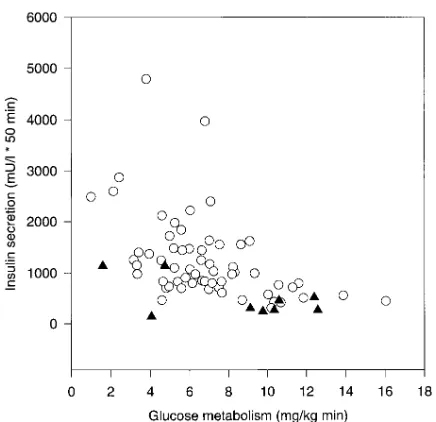
Fig. 4 shows the insulin and glucose responses during the OGTT in individuals with the MODY3 chromosome com-pared with data from the Botnia study (including both diabetic
and nondiabetic individuals, n5 2677). The insulin response follows the well-known bell-shaped curve with an increase up to glucose levels of 9 mmol/liter, at which level the insulin response starts to decline. In subjects with the MODY3 chro-mosome, there was no increase in the insulin response to in-creasing glucose concentrations during the OGTT in this cross-sectional study.
To obtain a measure of insulin secretion independent of gut glucose absorption, we measured the insulin response to an IVGTT and related it to the degree of insulin sensitivity (Table III). Despite a similar degree of insulin sensitivity, there was a marked reduction in the first and the late phase of insulin se-cretion in MODY3 carriers (both P5 0.0001). Of note, this difference remained when adjusted for differences in insulin sensitivity, indicating that the low insulin response was not a function of increased insulin sensitivity. As this analysis in-cluded both diabetic and nondiabetic individuals, we also com-pared insulin secretion data between a subgroup of nondia-betic MODY3 carriers (n5 6) and Botnia controls (n5 226). First phase insulin secretion was clearly reduced in the MODY3 carriers compared with the Botnia controls (4.460.3 vs. 5.360.1 mU/liter 3 10 min; P5 0.004), despite similar degree of insulin sensitivity (6.362.2 vs. 6.460.2 mg/kg min).
[image:8.612.57.297.462.691.2]We further plotted insulin secretion against insulin sensitiv-ity in those subjects who had these measurements performed during the same test. While individuals without the MODY3 chromosome showed the expected increase in insulin concen-trations with increasing insulin resistance, this increase was vir-tually lacking in the individuals with the MODY3-chromo-some (Fig. 5). Taken together the data clearly point at a defect in b cell function, which is not simply a consequence of an in-creased insulin sensitivity.
Figure 4. Incremental insulin secretion during an OGTT is plotted against the 2-h glucose concentration during the test in 30 subjects with (closed triangles) and in 2,677 subjects without (open circles) the MODY3 chromosome.
Table III. First (0–10 min) and Late (10–60 min) Phase Insulin Secretion Measured during an IVGTT and Insulin-stimulated Glucose Metabolism Measured during a Euglycemic Insulin Clamp in Subjects with (MODY31) and without the
MODY3-chromosome (MODY2) (Including Both Diabetic
and Nondiabetic Subjects)
MODY32 MODY31 P value
n 264 14
FBG (mmol/liter) 5.860.1 6.460.7 BMI (kg/m2) 27.060.3 23.860.8 0.001
Age (yr) 5161 3763 0.001 First phase insulin secretion
(mU/liter 3 10 min) 5.360.8 3.960.8 0.00001 (0.0034*) Late phase insulin secretion
(mU/liter 3 50 min) 7.060.5 6.360.5 0.0001 (0.0015*) Insulin-stimulated glucose
metabolism (mg/kg LBM min) 7.960.3 10.061.0
[image:8.612.314.556.509.673.2]Discussion
The study provides strong evidence for linkage between a dia-betic phenotype characterized by impaired insulin secretion and a region on chromosome 12 in four multiplex Finnish fam-ilies with early-onset diabetes. Second, this diabetic phenotype is different from the common forms of NIDDM and IDDM. Third, the similarity of the phenotype with that of NIDDM2 points at the possibility that the two diseases may be caused by different alleles of the same gene. Fourth, even in this rela-tively homogenous Finnish population, marked heterogeneity of diabetes was observed within the same family. Fifth, screen-ing for this form of diabetes may be justified in children at risk. Both diabetic and nondiabetic individuals with the MODY3 gene showed impaired insulin secretion, even when adjusted for differences in age, BMI, glucose tolerance, and degree of insulin sensitivity. More than 98% of diabetic patients inherit-ing the MODY3-chromosome had low stimulated insulin lev-els. In these families, we calculated that the penetrance is 76% with respect to the phenotype of NIDDM, and 85% when phe-notypes of IGT and previous history of gestational diabetes were considered.
Three of the four MODY3 families were consistent with the segregation of a single ancestral mutation. Moreover, the MODY3 phenotype segregating in all four families appeared identical and consistent with previous evidence, implicating an insulin secretory defect (15). Vaxillaire et al. reported a similar impairment in insulin secretion (measured as 2-h insulin values during OGTT) in MODY2, MODY3, and MODY patients un-linked to chromosomes 7 and 12, but did not compare their findings with insulin secretion in common NIDDM (15). Of particular interest is the finding that the MODY3 patients could not increase their insulin secretion in response to an in-crease in glucose. Although the data are cross-sectional, the large number of observations provide strong evidence that the
MODY3 carriers do not in this respect behave like patients with early NIDDM.
The most striking finding was the fact that nondiabetic car-riers of the MODY3 mutation also displayed low insulin levels (both at fasting and throughout the OGTT). Of importance, the decrease in insulin secretion must reflect a true b cell de-fect and cannot be explained by an increase in insulin sensitiv-ity. The lack of GAD-antibodies in the MODY3 patients also indicates that autoimmune processes are unlikely to be in-volved in the pathogenesis of the b cell defect. Furthermore, the proportional decrease in PI concentrations in MODY3 pa-tients points at a defect in some earlier step of insulin secretion rather than in the processing of PI.
Recently, Byrne et al. (25) reported normal insulin secre-tion rates in response to graded intravenous glucose concen-trations in nondiabetic MODY3 subjects at plasma glucose levels , 8 mmol/liter. The present findings of impaired insulin responses to intravenous glucose in the MODY3 carriers with normal glucose levels do not seem to support this finding. One explanation for this difference could be heterogeneity; it is possible that different mutations in the same gene may cause b cell defects of varying severity.
There are no obvious candidate genes for an insulin secre-tory defect in the shared chromosomal region apart from the gene encoding for pancreatic phospholipase A2 (PLA2) (26, 27). Given the putative role of PLA2 in insulin secretion, we sequenced the four published exons of the PLA2 gene. No evi-dence for structural mutations was detected in the sequence of
PLA2 from two MODY3 patients (one each from families A and B; data not shown).
Another striking finding was the marked within-family het-erogeneity even in this relatively homogeneous population. Therefore, it was encouraging to learn that genotypic hetero-geneity was matched by phenotypic heterohetero-geneity. Patients with MODY3 could be distinguished from patients with common NIDDM by lower BMI (z 75% of MODY3 patients had a
BMI , 27 kg/m2), more severe impairment of their insulin
se-cretion, less insulin resistance, lower blood pressure, and higher HDL-cholesterol concentrations. Taken together, the data indicate that the insulin resistance syndrome (syn-drome X) is not part of the MODY3 phenotype.
Obviously it had been difficult to discriminate clinically be-tween MODY3 and IDDM, as most children with MODY3 had been given a diagnosis of IDDM and treated with insulin from presentation. The presence of GAD-antibodies seems to be a good discriminator, since both children with IDDM but without the MODY3 chromosome (family A; subject IV-9, and family D; VI-19) were GAD-antibody positive. In con-trast, none of the MODY3 diabetic patients had GAD-anti-bodies. However, one must bear in mind that of patients cur-rently classified as IDDM at least 20% are GAD-antibody negative and 5–10% are negative for all IDDM-associated an-tibodies (28).
[image:9.612.56.274.55.266.2]MODY3 has been estimated to account for 30% of all MODY cases in France (15). That MODY3 families have been identified subsequently in Germany, Japan, the United King-dom, the United States (29), and now in Scandinavia suggests that MODY3 may be a fairly wide-spread form of early-onset diabetes. In fact, the prevalence of MODY3 may be substan-tially higher than previously thought, given the wide range in age at onset (7–56 yr) and the possible misdiagnosis of MODY3 as NIDDM or IDDM. Until the gene has been cloned, a better
estimate of the prevalence of MODY3 might be obtained by identifying the subset of diabetic patients with low insulin se-cretion.
We have recently mapped a gene for NIDDM (NIDDM2) also associated with an insulin secretion defect to precisely this region of chromosome 12. The similarity between phenotypes in MODY3 and NIDDM2 raises the intriguing possibility that the two diseases represent distinct alleles of the same gene which differ primarily in their age at penetrance (average age at onset 26 yr for MODY3 and 58 yr for NIDDM2). Consistent with our model of a stronger MODY3 allele, MODY3 patients display a more severe insulin secretion defect than NIDDM2 patients.
What is the risk for an unaffected carrier of the risk chro-mosome to develop diabetes? In women, the disease mani-fested frequently during pregnancy. If the MODY3 carriers are unable to increase their insulin secretion in response to a decrease in insulin sensitivity, this may create an especially vere problem during pregnancy, when women become se-verely insulin resistant. Our data of 10 times higher frequency of newly diagnosed diabetes in the MODY3 carriers than in the family controls (31 vs. 3%) seem to justify a recommenda-tion of annual screening for diabetes in persons at risk. Of course, this is based upon the assumption that hyperglycemia will have a similar impact on microvascular complications in MODY3 as in NIDDM and IDDM.
In conclusion, MODY3 represents a distinct diabetic phe-notype, characterized by autosomal dominant inheritance, normal weight, impaired b cell function, lack of GAD-anti-bodies, and absence of most features of the insulin resistance syndrome. Taken together with our earlier data on the map-ping of NIDDM2, this work demonstrates the importance of phenotypic classification in studies of diabetes. It also points to a gene on chromosome 12 responsible for an insulin secretory defect as the primary event in the pathogenesis of both early (MODY3) and adult-onset NIDDM.
Note added in proof: After the acceptance of this paper, the MODY3 gene has been cloned (34). Sequencing of the hepatic nuclear factor-1a (HNF-1a) gene revealed a missense muta-tion (T260M) in exon 4 in family A and an insermuta-tion of nucle-otide C (P291fsinsC) in exon 4 in families B, C, and D.
Acknowledgments
We thank Dr. Philippe Froguel for information on the MODY3 locus when the project was initiated, and Dr. Mark McCarthy and Pauline Sutton for assistance. We also thank members of the Botnia families for their willingness to participate in the studies, and the Botnia Re-search team. The GAD65 cDNA was kindly provided by Dr. Allan Karlsen and Dr. Catherine Grubin, University of Washington, Seat-tle, WA.
This study was supported by grants from the Sigrid Juselius Foun-dation, Swedish Medical Research Council (No. 10858 to L. Groop and E. Widén), Medical Faculty of Lund University (M. Lehto, T. Tuomi, and E. Widén), Malmö University Hospital (T. Tuomi), Novo Nordisk Foundation, Finnish Diabetes Research Foundation, Albert Påhlssons Foundation (M. Lehto, T. Tuomi), and Medical Society of Finland (C. Forsblom and E. Widén), and Medical Research Council of Canada (M.M. Mahtani).
References
1. Beck-Nielsen, H., and L. Groop. 1994. Metabolic and genetic character-ization of prediabetic states. Sequence of events leading to
non–insulin-depen-dent diabetes mellitus. J. Clin. Invest. 94:1714–1721.
2. Cerasi, E., and R. Luft. 1967. The plasma insulin response to glucose in-fusion in healthy subjects and in subjects with diabetes mellitus. Acta
Endo-crinol. 55:278–304.
3. DeFronzo, R.A. 1988. The triumvirate: b-cell, muscle, liver. A collusion responsible for NIDDM. Diabetes. 37:667–687.
4. Groop, L.C., E. Widén, and E. Ferrannini. 1993. Insulin resistance and in-sulin deficiency in the pathogenesis of type 2 (non-inin-sulin-dependent) diabetes mellitus: errors of metabolism or of methods. Diabetologia. 36:1326–1331.
5. Warram, J., B.C. Martin, A.S. Krolewski, J.S. Soelder, and R.C. Kahn. 1990. Slow glucose removal rate and hyperinsulinemia precede the develop-ment of type II diabetes in offspring of diabetic parents. Ann. Intern. Med. 113: 909–915.
6. Lillioja, S., D.M. Mott, M. Spraul, R. Ferrano, J.F. Foley, E. Ravussin, W.C. Knowler, P.H. Bennett, and C. Bogardus. 1993. Insulin resistance and in-sulin secretory dysfunction as precursors of non-inin-sulin-dependent diabetes mellitus. N. Engl. J. Med. 329:1988–1992.
7. Eriksson, K.F., and F. Lindgärde. 1996. Poor physical fitness, and im-paired early insulin response but late hyperinsulinaemia, as predictors of
NIDDM in middle-aged Swedish men. Diabetologia. 39:573–579.
8. Tattersall, R.B., and S.S. Fajans. 1975. A difference between the inherit-ance of classical juvenile-onset and maturity-onset diabetes of the young.
Dia-betes. 24:44–53.
9. Bell, G.I., K. Xiang, M.V. Newman, S. Wu, L.G. Wright, S.S. Fajans, R.S. Spielman, and N.J. Cox. 1991. Gene for non-insulin-dependent diabetes melli-tus (maturity-onset diabetes of the young subtype) is linked to DNA
polymor-phism on human chromosome 20q. Proc. Natl. Acad. Sci. USA. 88:1484–1488.
10. Froguel, P., M. Vaxillaire, F. Sun, G. Velho, H. Zouali, M.O. Butel, S. Lesage, N. Vionnet, K. Clément, F. Fougerousse, et al. 1992. Close linkage of glucokinase locus on chromosome 7p to early-onset non-insulin-dependent dia-betes mellitus. Nature (Lond.). 356:162–167.
11. Gidh-Jain, M., J. Takeda, L.Z. Xu, A.J. Lange, N. Vionnet, M. Stoffel, P. Froguel, G. Velho, F. Sun, D. Cohen, et al. 1993. Glucokinase mutations as-sociated with non-insulin-dependent (type 2) diabetes mellitus have decreased enzymatic activity: implications for structure/function relationships. Proc. Natl.
Acad. Sci. USA. 90:1932–1936.
12. Froguel, P., H. Zouali, N. Vionnet, G. Velho, M. Vaxillaire, F. Sun, S. Lesage, M. Stoffel, J. Takeda, P. Passa, et al. 1993. Familial hyperglycemia due to mutations in glucokinase. N. Engl. J. Med. 328:697–702.
13. Zhang, Y., M. Warren-Perry, P.J. Saker, A.T. Hattersley, A.D. Mackie, J.D. Baird, R.H. Greenwood, M. Stoffel, G.I. Bell, and R.C. Turner. 1995. Can-didate gene studies in pedigrees with maturity-onset diabetes of the young not linked with glucokinase. Diabetologia. 38:1055–1060.
14. Iwasaki, N., H. Ohgawara, H. Nagahara, M. Kawamura, G.I. Bell, and Y. Omori. 1995. Characterization of Japanese families with early-onset type 2 (non-insulin-dependent) diabetes mellitus and screening for mutations in the glucokinase and mitochondrial tRNA(Leu(UUR)) genes. Acta Diabetol. 32:17–22. 15. Vaxillaire, M., V. Boccio, A. Philippi, C. Vigouroux, J. Terwillinger, P. Passa, J.S. Beckmann, G. Velho, G.M. Lathrop, and P. Froguel. 1995. A gene for maturity-onset diabetes of the young (MODY) maps to chromosome 12 q.
Nat. Genet. 9:418–423.
16. Groop, L., C. Forsblom, M. Lehtovirta, T. Tuomi, S. Karanko, M. Nis-sén, B.O. Ehrnström, B. ForNis-sén, B. Isomaa, B. Snickars, and M.-R. Taskinen. 1996. Metabolic consequences of a family history of NIDDM (The Botnia Study). Diabetes. 45:1585–1593.
17. Mahtani, M., E. Widén, M. Lehto, J. Thomas, M. McCarthy, J. Brayer, B. Bryant, G. Chan, M. Daly, C. Forsblom, et al. 1996. Mapping of a gene for type 2 diabetes associated with an insulin secretion defect by a genome scan in Finnish families. Nat. Genet. 14:90–94.
18. Heding, L.G. 1975. Radioimmunological determination of human C-pep-tide in serum. Diabetologia. 11:541–548.
19. Grubin, C.E., T. Daniels, B. Toivola, M. Landin-Ohlsson, W.A. Hago-pian, L. Li, A.E. Karlsen, E. Boel, B. Michelsen, and Å. Lernmark. 1994. A novel radioligand binding assay to determine diagnostic accuracy of isoform-specific glutamic acid decarboxylase antibodies in childhood IDDM.
Diabetolo-gia. 37:344–350.
20. Falorni, A., E. Örtqvist, B. Persson, and Å. Lernmark. 1995. Radioim-munoassay for glutamic acid decarboxylase (GAD65) and GAD65 autoanti-bodies using 35S or 3H recombinant human ligands. J. Immunol. Meth. 186:89–99.
21. Economou, E.P., A.W. Bergen, A.C. Warren, and S.E. Antonarakis. 1990. The polydeoxyadenylate tract of Alu repetitive elements in the human genome. Proc. Natl. Acad. Sci. USA. 87:2951–2954.
22. Matsutani, A., R. Janssen, H. Donis-Keller, and M.A. Permutt. 1992. A polymorphic (CA)n repeat element maps the human glucokinase gene (GCK)
to chromosome 7p. Genomics. 12:319–325.
23. Nishi, S., M. Stoffel, K. Xiang, T.B. Shows, G.I. Bell, and J. Takeda. 1992. Human pancreatic beta-cell glucokinase: cDNA sequence and
localiza-tion of the polymorphic gene to chromosome 7, band p13. Diabetologia. 35:
743–747.
24. Kruglyak, L., and E. Lander. 1995. Complete multi-point sib-pair analy-sis of qualitative and quantitative traits. Am. J. Hum. Genet. 57:439–454.
Drons-field, S.C. Bain, A.T. Hattersley, G. Velho, P. Froguel, et al. 1996. Altered insu-lin secretory responses to glucose in diabetic and nondiabetic subjects with mu-tations in the diabetes susceptibility gene MODY3 on chromosome 12.
Diabetes. 45:1503–1510.
26. Seilhammer, J.J., T.L. Randall, M. Yamanaka, and L.K. Johnsson. 1986. Pancreatic phospholipase A-2: isolation of the human gene and cDNAs from
porcine pancreas and human lung. DNA (NY). 5:519–527.
27. Sparkes, R.S., T. Mohandas, C. Heinzmann, J.J. Seilhamer, A.J. Lusis, and L.K. Johnsson. 1987. Assignment of the gene for pancreatic phospholipase
A2 to human chromosome 12. Cytogenet. Cell Genet. 46:697.
28. Falorni, A., I. Kockum, C.B. Sanjeevi, and Å. Lernmark. 1995. Patho-genesis of insulin-dependent diabetes mellitus. Clin. Endocrinol. Metab. 9:25–46.
29. Menzel, S., K. Yamagata, J.B. Trabb, J. Nerup, M.A. Permutt, S.S. Fa-jans, R. Menzel, N. Iwasaki, Y. Omori, N.J. Cox, and G.I. Bell. 1995.
Localiza-tion of MODY3 to a 5-cM region of human chromosome 12. Diabetes. 44:1408–
1413.
30. Dib, C., S. Faure, C. Fizames, D. Samson, N. Drout, A. Vignal, P.
Mil-lasseau, S. Marc, J. Hazan, and E. Seboun. 1996. A comprehensive genetic map
of the human genome based on 5,264 microsatellites. Nature (Lond.). 380:
152–154.
31. Murray, J.C., K.H. Buetow, J.L. Weber, S. Ludwigsen, T. Scherpbier-Heddema, F. Manion, J. Quillen, V.C. Sheffield, S. Sunden, G.M. Duyk, et al.
1994. A comprehensive human linkage map with centimorgan density. Science
(Wash. DC). 265:2049–2054.
32. Hudson, T.J., L.D. Stein, S.S. Gerety, J. Ma, A.B. Castle, J. Silva, D.K. Slonim, R. Baptista, L. Kruglyak, S.-H. Xu, et al. 1995. An STS-based map of
the human genome. Science (Wash. DC). 270:1945–1954.
33. Schuler, G.D., M.S. Boguski, E.A. Stewart, L.D. Stein, G. Gyapay, K. Rice, R.E. White, P. Rodriguez-Tomé, A. Aggarwal, E. Bajorek, et al. 1996. A
gene map of the human genome. Science (Wash. DC). 274:540–546.
34. Yamakata, K., N. Oda, P.J. Kaisaki, S. Menzel, H. Furuta, M. Vaxillaire, L. Southam, R.D. Cox, G.M. Lathrop, V.V. Boriraj, et al. 1996. Mutations in the hepatocyte nuclear factor-1a gene in maturity-onset diabetes of the young