www.hydrol-earth-syst-sci.net/19/2605/2015/ doi:10.5194/hess-19-2605-2015
© Author(s) 2015. CC Attribution 3.0 License.
Surface seiches in Flathead Lake
G. Kirillin1,2, M. S. Lorang2, T. C. Lippmann2,3, C. C. Gotschalk2, and S. Schimmelpfennig1
1Department of Ecohydrology, Leibniz Institute of Freshwater Ecology and Inland Fisheries (IGB), Berlin, Germany 2The University of Montana, Flathead Lake Biological Station, Polson, MT, USA
3University of New Hampshire, Dept. of Earth Sciences and Center for Coastal and Ocean Mapping, NH, USA
Correspondence to: G. Kirilin (kirillin@igb-berlin.de)
Received: 10 October 2014 – Published in Hydrol. Earth Syst. Sci. Discuss.: 10 December 2014 Revised: 14 April 2015 – Accepted: 11 May 2015 – Published: 3 June 2015
Abstract. Standing surface waves or seiches are inherent hy-drodynamic features of enclosed water bodies. Their two-dimensional structure is important for estimating flood risk, coastal erosion, and bottom sediment transport, and for un-derstanding shoreline habitats and lake ecology in general. In this work, we present analysis of two-dimensional seiche characteristics in Flathead Lake, Montana, USA, a large in-termountain lake known to have high seiche amplitudes. To examine spatial characteristics of different seiche modes, we used the original procedure of determining the seiche fre-quencies from the primitive equation model output with sub-sequent derivation of the spatial seiche structure at fixed frequencies akin to the tidal harmonic analysis. The pro-posed procedure revealed specific seiche oscillation features in Flathead Lake, including maximum surface level ampli-tudes of the first fundamental mode in straights around the largest island; several higher modes appearing locally in the vicinity of the river inflow; the “Helmholtz” open harbor mode, with the period approximately twice that of the longest seiche mode, generated by a large shallow bay connected to the main lake basin; and several rotating seiche modes po-tentially affecting the lake-wide circulation. We discuss lake management problems related to the spatial seiche distribu-tion, such as shoreline erosion, floods, and transport of sedi-ments and invasive species in Flathead Lake.
1 Introduction
Since Forel (1895); see also Forel and von Zeppelin (1893) first described free-surface oscillations in Alpine lakes and coined the term “seiches”, standing basin-scale waves have been recognized as distinguishing features of lake
hydrody-namics. Seiches exist in any (semi) enclosed basin, where long surface waves reflecting at opposite shores interfere to produce a standing wave. The longest possible seiche (the first “fundamental” mode) has the wavelengthλthat is twice the distance between the shores,L. The wavelengths of other possible modes decrease by even fractions of the distance be-tween shores. Therefore, for the majority of possible modes, seiche waves are very long compared to the lake depth. This characteristic allows application of shallow water linear wave theory to the analysis of seiche motion (see, e.g., Turner, 1973). The dispersion relation for the one-dimensional long linear waves yields the well-known Merian formula (von der Mühll, 1886)
ω=cλ−1=nc(2L)−1, (1)
1995), or give rise to local rotating modes (Rao and Schwab, 1976). These seiche effects are especially important in large lakes, gulfs, and seas, where a local increase in seiche am-plitudes can threaten populated areas with flooding (Hollan et al., 1980; Kulikov and Medvedev, 2013). Coastal erosion, nearshore wetland habitat structure, and sediment transport are also seiche-related issues relevant to water and coastal management. Determining the two-dimensional seiche struc-ture from observations requires large amounts data on water level and current velocity from multiple sites along the shore-line and can have high uncertainty due to contamination of data by frequency aliasing or non-seiche oscillations (Mor-timer and Fee, 1976). Numerical modeling is an effective alternative to observational approaches. Among modeling studies on the two-dimensional structure of seiches in large basins with complex morphometry, the “normal modes” ap-proach has been widely used, based on replacement of the system of equations for water motion with their equivalents for harmonic functions of space and time. This approach reduces the numerical problem to a discrete set of eigen-value solutions, each corresponding to a certain seiche mode (Csanady, 1967; Platzman, 1972; Rao and Schwab, 1976). A more straightforward approach based on isolation of se-iche motions from the results of direct hydrodynamic sim-ulation with primitive equations of motion has a certain ad-vantage owing to the recent improvements in computational techniques (Suursaar et al., 2002; Jönsson et al., 2008). Since circulation modeling with primitive equation models has be-come routine during the last decades, many model codes have become freely available and their application is not overly time-consuming. In addition, existing outputs from circula-tion models, applied previously to different bays, lakes, or estuaries, may be later reanalyzed using appropriate meth-ods for estimation of seiche characteristics. In this study we present an analysis of the modal structure of seiches in Flat-head Lake (described below). Instead of applying eigenvalue solutions for a priori periodic velocities and surface eleva-tions, we solved a “backward” problem by applying har-monic analysis to the output of a primitive equations model, and deriving a discrete set of seiche eigenfrequencies from a “synthetic” spectrum for all grid points of the calculation domain. The method is an effective way of obtaining detailed information on the possible spatial structure of free-surface oscillations in Flathead Lake. We discuss the lake-specific features of these oscillations and mechanisms of their gen-eration, and their potential importance for predicting floods, coastal erosion, and occurrence and structure of nearshore wetland habitats around the lake.
10 20 30 40 50 60 70 80 90 100
Depth [m]
SM
WB
NR EO
SB
PN
N
E
S W
[image:2.612.312.546.70.324.2]10 km
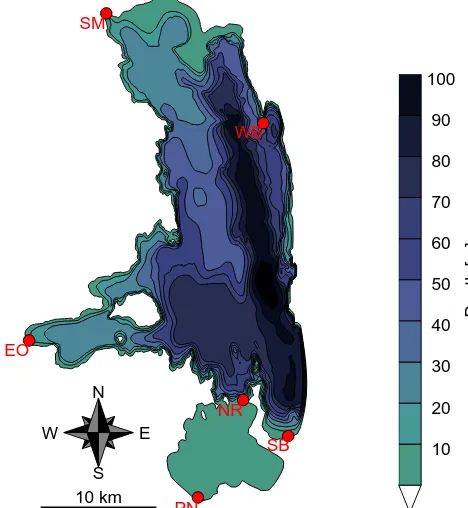
Figure 1. Flathead Lake: bathymetry map and location of pressure
and water level measurement sites (red circles), referred to in the text.
2 Study site and methods 2.1 Flathead Lake
2.1.1 Lake origin and morphology
during advance and deposition during retreat) has resulted in a lake with a range of shoreline types, islands, bays, and bathymetric provinces. Mountain ranges on either side topo-graphically control wind that provides the principal driving force for seiche motion in the lake. Wind-generated surface gravity waves (with periods of 1–3 s) generated in the main body of the lake maintain a sandy-silt sediment deposit in the northern half of Polson Bay (Lorang, 1984), and fine silts and clay elsewhere in the bay and most of the lake bottom. Sediments delivered by the Flathead River (which drains a 18 372 km2catchment) formed a large delta where the river enters the lake. This sand-silt delta extends several kilome-ters out into the lake (Fig. 1) and results in a very dissipa-tive, low-slope, nearshore environment for the north shore (Lorang et al., 1993b). Deposition of glacial till along much of the east and west shores combined with exposed bedrock has resulted in reflective nearshore systems characterized by gravel beaches and steep inshore shelves armored by wave-washed cobble (Lorang et al., 1993b).
2.1.2 Winds and lake level fluctuations
Winds on Flathead Lake are thermally driven in the sum-mer months due to differential heating and cooling on the lake surface and the adjacent mountain ranges. This ther-mal regime is characterized by distinct westerly therther-mal winds draining from mountains out on to the lake in the evening, and northerly winds driven by air masses that drain north to south in the valley early in the morning. These winds typically have a maximum speed of around 5 m s−1, with durations of 2 to 6 h, and cover 30–50 % of the lake. Passing frontal systems produce north-northwest and south-southwest wind events in which wind speeds often reach 10– 15 m s−1 with durations of 2–6 h. These events often spin up and down repeatedly over periods of days and cover the entire lake. The strongest winds come out of the east and are driven by high-pressure systems that sit off to the east of the Rocky Mountains, producing local topographi-cally channeled winds along the east shore. These east winds have been observed to reach 30–50 m s−1, and can last for hours, extending several kilometers out into the main body of the lake, being, however, limited to the central portion of the lake. During these events it can be completely calm on the west shore. Flathead Lake levels fluctuate seasonally with the spring freshet from snowmelt. However, Kerr Dam, built in 1938 and located 6 km below the lake outlet, now holds water in the lake for longer durations compared to pre-dam conditions (Lorang et al., 1993a; Lorang and Stanford, 1993). Kerr Dam operations attempt to hold the lake level at a “full-pool” elevation of 881.78 m, without exceeding that limit for approximately 4 months, then slowly lower the lake over late fall and winter months (Lorang et al., 1993a). These regulated fluctuations have concentrated wave energy at the full-pool operational lake elevation that has reconfig-ured the nearshore zone lake-wide, causing variable
shore-line retreat ranging from tens of meters to over a kilometer (Lorang et al., 1993b, a; Lorang and Stanford, 1993). How-ever, large differences in shoreline loss have been shown to result from small changes in lake level of 30 cm or less (Lo-rang et al., 1993a; Lo(Lo-rang and Stanford, 1993). Some of the variations are seasonal, while others have diurnal or hourly periods; hence water level change occurs across a range of timescales that spans 5 orders of magnitude (Morrison et al., 2005). The mode 1 seiche period along the long axis of the lake can be approximated from Eq. (1); however, actual se-iche motions are influenced by bathymetry, the shape of the shoreline, and other factors. For a 50 km long lake with an average depth of 50 m, the seiche will have a period of ap-proximately 2 h, while the cross-lake seiche will have a pe-riod of approximately 30 min, as it would be in Polson Bay. Morrison et al. (2005), measuring at a single location in Pol-son Bay, observed a strong spectral peak in surface oscilla-tions at a period of 2 h, and a less energetic peak at a period of 35 min.
2.2 Circulation model, configuration of model runs
The Princeton Ocean Model (POM; Blumberg and Mel-lor, 1987) was run on a curvilinear grid domain of 100 by 200 cells, approximating the bathymetry of Flathead Lake. The model was run in barotropic mode (no baroclinic den-sity currents). Horizontal eddy viscoden-sity was modeled by the Smagorinsky diffusivity (Smagorinsky, 1963) with a non-dimensional coefficientC=0.2. We adopted a simple bot-tom stress parameterization based on the law of the wall and the thickness of the logarithmic layer dependent on the lake depth from Schimmelpfennig et al. (2012). The circula-tion was forced by an initial linear tilt of the lake surface of 0.5×10⁻⁶, corresponding to the surface slope produced by surface wind stress of approximately 3×10⁻⁴m2s−2, corre-sponding to winds of about 8–10 m s−1. Several model runs, with a duration of 4 days’ model time, were performed with varying directions of the initial tilt. Comparison of the model outputs demonstrated essentially the same spectral composi-tion of the seiche oscillacomposi-tions, so that only a single run with the south–north initial slope is analyzed below, roughly co-inciding with the main axis of the lake.
2.3 Harmonic analysis
point data nor the spectrum averaged over the lake area is representative of the entire basin. In order to uncover the fre-quencies set of seiche oscillations relevant to the whole lake, the following procedure was developed and applied. In order to retain only the oscillatory motions in the surface elevation time series, the mean values were removed from velocity and surface elevation records. A spectrum was taken of the free-surface oscillations at every grid point of the model domain. Then, a “maximum spectrum estimation” was constructed by superimposing the significant spectral peaks among all grid points. The significance level of the spectral peaks was de-fined as the upper 99 % significance level for red noise sig-nal containing the same variance as the spectrum estimation (Kirillin et al., 2008). This approach conserved the “local modes” with relatively high amplitudes but was confined to small areas, like bays or straits. In contrast, using an aver-age spectrum over the entire lake would smooth out local modes. Frequencies with significant spectral peaks provided a basis for subsequent harmonic analysis. The procedure of the harmonic analysis followed that described in Thomson and Emery (2001); time series of velocities and water lev-els at every grid point were approximated with least squares by a Fourier series containing only the selected frequencies. Through this approach, the spatial distribution was estab-lished with amplitudes and phases for every mode over the lake.
For analysis of spatial structure of vector velocity fields, the distribution of the rotary coefficients, R, over the lake surface for each seiche mode was estimated. The rotary spec-tra were defined asR=(S+−S−)(S++S−), whereS+and
S−are the counterclockwise and clockwise rotary spectra of velocity vectors, respectively. The rotary spectra were cal-culated by taking a Fourier transform of the complex veloc-ity vector u+i v, where uandv are the orthogonal Carte-sian components of the two-dimensional velocity (see Thom-son and Emery, 2001, for details), resulting in a two-sided spectral power density estimation, with a positive (right-side) range of frequencies corresponding to the counterclock-wise rotation, and a negative (left-side) range of frequen-cies corresponding to the the clockwise rotation (Gonella, 1972; Hayashi, 1979). As such, the rotary coefficient ranges from −1 for purely clockwise rotation to +1 for counter-clockwise rotation, and is 0 for unidirectional motion (see Thomson and Emery, 2001, for details).
2.4 Measurements
In the following analysis, we use data on underwater pressure oscillations collected during 2011–2012 at five measurement sites around the lake (points EO, SM, WB, NR, and SB in Fig. 1) and lake level data collected by the United States Geologic Service (USGS) at Polson (point PN in Fig. 1). The pressure variations at site EO were measured by on-set pressure–temperature (PT) sensors taking instantaneous measures every 2 min. Other pressure measurements were
0 5 10 15 20 25 30 35 40
0 0.5 1 1.5 2 2.5 3 3.5 4 4.5
x 10−3
117.0 63.0
48.5 32.4
29.6 24.2
21.6 20.7
17.8 17.2
16.0 14.2
13.8
11.8 10.4 10.0
Rotary frequency, σ (cph)
PSD*
σ
(m
[image:4.612.311.546.67.272.2]2)
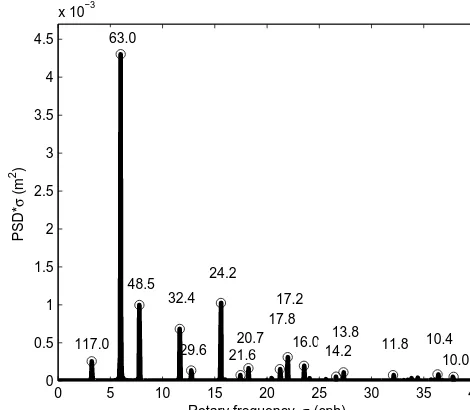
Figure 2. The synthetic maximum spectrum of modeled lake
sur-face oscillations. Significant peaks are marked with circles with cor-responding seiche periods in min.
collected with experimental PT wave recorders (msi) that sampled at 4 Hz and then smoothed the data and re-sampled at 2 min intervals to match the onset PT loggers. The USGS gauging station was located in a stilling well connected by a pipe to the lake, and it recorded lake level values at 1 h inter-vals.
3 Results
The model was driven by the initial surface slope without any additional external forcing, so that the resulting spectrum of the surface level oscillations has a line shape in contrast to continuous spectra of natural water level oscillations. The seiche frequencies and periods were therefore easily iden-tifiable from the line spectral peaks (Fig. 2); 16 frequencies were identified, with the weakest peak containing about 1 % of the spectral energy of the strongest one. The sum of spec-tral energies residing at the 16 frequencies contained more than 99 % of the total variance (Fig. 2, Table 1).
An additional support to the results of the harmonic anal-ysis was provided by the comparison of the time series re-stored from the 16 Fourier components against the original modeled time series; the restored time series captured all ma-jor features of the original variability (Fig. 3), suggesting that the 16 frequencies contain the bulk of the free barotropic mo-tions of the lake.
Table 1. Periods of free oscillation modes in Flathead Lake.
Significant seiche periods Significant seiche periods sorted by frequency sorted by spectral energy
Mode Period Period Mode
(min) (min)
0 117.0 63.00 1
1 63.00 48.48 2
2 48.48 24.18 5
3 32.40 32.40 3
4 29.58 117.00 0
5 24.18 17.16 9
6 21.60 29.58 4
7 20.70 20.70 7
8 17.76 16.02 10
9 17.16 17.76 8
10 16.02 21.60 6
11 14.20 13.80 12
12 13.80 11.76 13
13 11.76 10.38 14
14 10.38 14.20 11
15 10.00 10.00 15
3000 3200 3400 3600 3800 4000
8.5 9 9.5 10 10.5 11 11.5 12 12.5 13 13.5
surface elevation, mm
time step
[image:5.612.52.278.84.557.2]Original Restored
Figure 3. Lake surface oscillations at a single point in the middle of
the lake produced by the model (blue solid line) and restored from the 12 harmonics (modes) of the Fourier analysis (red dashed line).
group is characterized by very small energy of oscillations and is therefore excluded from the detailed analysis below. For completeness, the spatial characteristics of the four least energetic short-period modes are provided in Fig. S1 (Sup-plement I).
The amount and distribution of the zero phase of the lake-wide modes with periods of 63.0, 32.4, 21.6, and 14.2 min (red lines in Fig. 4b, d–f) suggest these modes to be one-to four-node analogues of one-dimensional channel modes, respectively. Comparison of their periods to those following
117.00 min
North, km
5290 5300 5310 5320 5330
63.00 min
48.48 min
32.40 min
East, km
North, km
700 710 720
5290 5300 5310 5320 5330
21.60 min
East, km
700 710 720
14.16 min
East, km
700 710 720
Elevation amplitude
0 0.2 0.4 0.6 0.8 1
A B C
[image:5.612.50.283.95.535.2]D E F
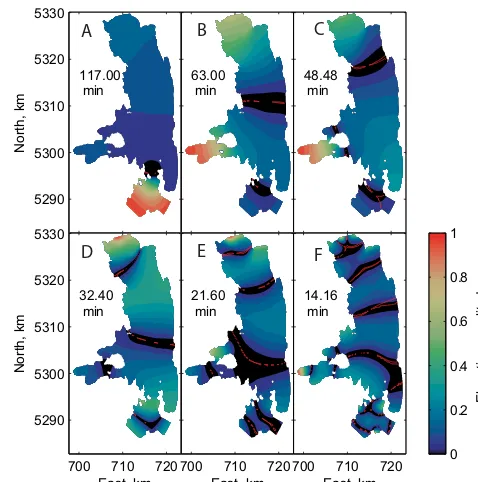
Figure 4. Relative amplitudes of the six lake-wide free oscillation
modes. Zero-amplitude nodal lines are shown in red.
from the Merian formula, Eq. (1), supports this suggestion; substitution of the maximum lake lengthL=44 km and of the mean lake depth H=50 m into Eq. (1) yields similar values for the periods of the first four longitudinal modes: 66, 33, 22, and 16.5 min. Their spatial distribution is, how-ever, modified by the irregular shape of the lake and dif-fers significantly from that of plane longitudinal oscillations (color plots in Fig. 4; see also animated Figs. 1–4 in Supple-ment II). The highest water level amplitudes of the first mode (Fig. 4b) are concentrated in Big Arm Bay on the western side of the lake. These high amplitudes are apparently con-ditioned by a narrowing of the lake cross section towards the bay, which is separated from the main basin by two narrow straights around Wildhorse Island. Equation (1) fails to pre-dict 117 and 48.5 min modes (Fig. 4a–c). The latter oscilla-tion has maximum amplitudes in the Big Arm Bay on the west side of the lake, and one nodal line in the main basin of the lake. Hence, it can be associated with a one-node seiche along a shorter length scale than the maximum lake length of 44 km, which is an analogue of a transverse seiche in a rectangular basin.
29.58 min
North, km
5290 5300 5310 5320 5330
24.18 min
20.70 min
17.76 min
East, km
North, km
700 710 720
5290 5300 5310 5320 5330
17.16 min
East, km
700 710 720
16.02 min
East, km
700 710 720
Elevation amplitude
0 0.2 0.4 0.6 0.8 1
A B C
[image:6.612.307.546.64.291.2]D E F
Figure 5. The same as Fig. 4 but for the six bay modes of free
oscillations.
the narrow straight separating Polson Bay from the lake. These characteristics suggest the 117 min mode to be a res-onant Helmholtz or “open channel” mode (Miles and Munk, 1961; Miles, 1974). In particular, this suggestion legitimizes the long period of oscillation. In an ideal case of a half-open channel of characteristic lengthL connected to an in-finitely large basin, the Helmholtz mode has the wavelength 4L, which is twice the wavelength of the longest seiche in an enclosed lake. The corresponding oscillation period is also 2 times longer than the fundamental seiche, as pro-vided by Eq. (1). The 117 min oscillation is indeed almost 2 times slower than that of the one-node 63 min seiche. How-ever, in semi-enclosed basins with narrow and shallow open-ings, the characteristics of the Helmholtz oscillations devi-ate strongly from those given by idealized models (Platz-man, 1972; Miles, 1974) and are determined by the width and depth of the mouth. In Flathead Lake, this role is played by the narrow straight between the main basin and Polson Bay. According to Lee (1971) and Miles and Lee (1975) the water level amplitude of the Helmholtz mode is uniform over the lake and the maximum current velocities are localized in the mouth. The ratio of the Helmholtz mode periodT to that of the fundamental seiche T0 is proportional to the square root of the ratio of lake depthHto the depth of the straight
hl:T /T0(H /hl)1/2, i.e., the Helmholtz mode is slower than
the first mode seiche. The shape of the 117 min mode in the main basin agrees well with these estimations.
Six local modes do not produce any appreciable water level oscillation in the open part of Flathead Lake (Fig. 5). Among them, the 29.6 min mode (Fig. 5a) is the
fundamen-Figure 6. The shape of the lake surface corresponding to the
max-imum slope due to the slowest open-channel Helmholtz mode (see also animated surface oscillations in Supplement II).
tal one-node mode of the Polson Bay with a single node line and water level oscillations confined to the bay with a small response in the main lake basin. The 17.16 min mode (Fig. 5d) is an analogous oscillation in the Big Arm Bay. Both the 24.2 and 20.7 min modes have pronounced transver-sal components: the former in the southern and the latter in the northern part of the lake (Fig. 5b–c). This “splitting” of the transverse mode in two results from the irregular width of the lake along the main axis; the slower 24.2 min mode prop-agates along the widest transverse axis in the southern part of the lake. The 20.7 min mode is confined to the partially isolated northern part of the lake. The isolated morphome-try of the northern basin gives rise to several local oscillation modes confined to this area (Fig. 5e and f and Fig. S2, Sup-plement I).
[image:6.612.49.287.65.304.2]117.00 min
North, km
5290 5300 5310 5320 5330
63.00 min
48.48 min
32.40 min
East, km
North, km
700 710 720 5290
5300 5310 5320 5330
21.60 min
East, km 700 710 720
14.16 min
East, km
700 710 720 10 −3 10−2 10−1 100
[image:7.612.311.546.65.394.2]Velocity amplitude (logarithmic)
Figure 7. Normalized amplitudes of the velocity oscillations for
the six modes with strong intensification of seiche currents in the nearshore areas (red color). Note the logarithmic color scale.
attributed to the effect of lateral friction at the lake shores. A more interesting pattern is revealed in oscillations with 29.6 and 20.7 min periods: both produce counter-rotating gyres in the center of the lake (Fig. 8b and d). While the direction of the rotational movement changes with the corre-sponding seiche frequency, the patterns suggest formation of horizontal fronts – areas of strong lateral shear – developing away from the solid boundaries. The rotary coefficients of the other seiche modes are provided in Fig. S3 (Supplement I). Among them, the most energetic long-period modes do not reveal rotational movements, while the short-period modes have a patchy pattern, which, assuming the high frequency of these modes, does not produce any appreciable long-lasting effects.
The modal structure of seiches derived from the model-ing results shows good qualitative agreement with water level records from Flathead Lake (Fig. 9). The spatial structure of different seiche modes, as revealed by modeling, explains general features of the measured water level spectra vari-ability over the lake: as predicted by the model, the 117 min Helmholtz mode has the strongest peak in Polson Bay and is practically absent in other locations in the lake (Fig. 9b); the first and second longitudinal modes with periods 63.0 and 48.5 min show strong peaks in the main lake basin (Fig. 9a and d); and at the measurement sites WB and NR, located close to the nodal lines of modes 1 and 2, the third mode of 32.4 min has a strong contribution to the oscillations (Fig. 9c and d).
48.48 min
North, km
5285 5290 5295 5300 5305 5310 5315 5320 5325 5330
29.58 min
24.18 min
East, km
North, km
700 710 720 5285
5290 5295 5300 5305 5310 5315 5320 5325 5330
20.70 min
East, km 700 710 720
Rotational coefficient
−1 −0.8 −0.6 −0.4 −0.2 0 0.2 0.4 0.6 0.8 1
Figure 8. Rotary coefficients for the four free oscillation modes
with rotational character. See Fig. S3 in Supplement I for spatial distribution of rotary coefficients for other modes.
[image:7.612.49.289.66.308.2]EO
0.5 1
0
117 63 48.5 32.4 20 15 10 5 0
0.5 PN
Period, min
PSD*
σ
, normalized
WB
117 63 48.5 32.4 20 15 10 5 NR
Period, min
WB
NR EO
[image:8.612.127.471.65.211.2]PN
Figure 9. Spectra of measured (blue) vs. modeled (red) free-surface oscillations at four different locations in Flathead Lake. The inlet shows
the positions of the corresponding measurement points.
4 Discussion and conclusions
Seiches in Flathead Lake have been measured in past stud-ies (Morrison et al., 2005). However, the true complexity of their spatial variability has not been revealed with limited ob-servational series. Our model-based approach proved to be a useful tool to assess an array of possible complex seiche mo-tions and their rotational characteristics.
4.1 Effectiveness of the method
Fourier analysis is an established method for studying tidal oscillations, but is usually considered inapplicable to seiche analysis because seiche frequencies are basin-conditioned and are not known a priori. We demonstrated that isola-tion of the seiche frequencies by constructing a maximum spectrum over the basin under investigation is an effective way to isolate the eigenfrequencies from the output of prim-itive equation models, at the expense of estimation of the spectral density at each model grid point. The latter sug-gests 103–104 spectrum calculations that are computation-ally more expensive than eigenvalue analysis (e.g., Rao and Schwab, 1976). However, modern computers make the com-putations approachable and the results more accurate, given that the model accurately takes into account effects on se-iche motion like shoreline morphometry, basin bathymetry, Coriolis force, and bottom friction. Moreover, other effects, like variable wind forcing or variable water level, can be eas-ily added. We used specially designed model runs with initial slope of the surface being the only driving force for the circu-lation, rendering isolation of the seiche frequencies straight-forward. The model outputs driven by realistic forcing con-tain continuous spectra of motions. Significant seiche peaks can be identified by comparison of the model spectra to a background red noise spectrum containing the same integral spectral energy (Gilman et al., 1963; Bernhardt and Kirillin, 2013).
Our method allowed identification of several specific fea-tures of the basscale oscillations in Flathead Lake, in-distinguishable by the simple channel-like approximation (Eq. 1), the most crucial being the existence of the Helmholtz mode strongly affecting the dynamics of small Polson Bay, connected to the main lake basin by a narrow straight. An-other remarkable feature of the lake-wide modes revealed by the method is the deviation of their periods from those fol-lowing Eq. (1). The deviation is stronger for higher modes of seiches with shorter wavelengths, which are apparently stronger affected by the irregular lake morphometry: the fourth longitudinal mode has a period of 21.6 min (Table 1), which is remarkably longer than the period of the fourth channel mode of 16.5 min (Eq. 1). Hence, a simple compar-ison of the oscillation periods with Eq. (1) would result in a wrong association of the fourth mode with the period of 16.02 min; this could be a potential source of confusion when applying the channel approximation to seiche analysis.
4.2 The role of surface seiches in the dynamics of Flathead Lake
shore-lines in Polson Bay, along the north shore, and in Big Arm Bay, seiche motions control overwash and inundation pat-terns that ultimately control the pattern of sedimentation and subsequent vegetative colonization. Hence, seiche motions can affect shoreline erosion processes, rates of shoreline re-treat, and sedimentation patterns, as well as impart a shift in the mosaic of habitat (Stanford et al., 2005) composing the riparian transition from lake to terrestrial environment.
Seiches have also caused significant flooding to shore-line development activities that have built too close to the lakeshore and at too low elevations. We found through our modeling exercise that the low-frequency Helmholtz mode had high amplitudes in Polson Bay, Big Arm Bay, and areas of the north shore. These areas would be particularly in dan-ger of potential flooding, especially in Polson Bay, given the shorter frequencies and possibility of developing resonance conditions. High-velocity amplitudes were also found along Wildhorse Island and Polson Bay. The high-frequency modes concentrated at the north shore could affect sediment trans-port distribution from the river inflow as well as the drift of aquatic invasive species. Results from this study will be valu-able to local planning departments and developers alike to limit future problems associated with seiche-induced flood-ing (Fig. S4, Supplement I) by providflood-ing maps of spatially distributed zones of expected seiche impacts.
In addition, the maps of rotational coefficients for expected dominant modes of oscillation (Fig. 8) provide valuable in-formation about open-water mixing between gyre systems (Kirillin et al., 2008). These mixing zones are potentially im-portant zones or “hot spots” of ecological activity from phy-toplankton production to predation by zooplankton and fish. Hence, the structure and pattern of the seiche motions and as-sociated currents and mixing patterns provide a physical tem-plate for complex food web interaction. In addition, knowing the patterns of mixing zones also provides a template or map to help guide plankton tow efforts aimed at early detection of aquatic invasive species.
4.3 Combining observations and model efforts in seiche studies
As discussed above, the method applied in the present study provides an effective way of gaining information on the pre-cise seiche temporal characteristics and, more importantly, on the two-dimensional lateral distribution of the seiche am-plitudes and currents. The latter are difficult to reveal from direct field observations constrained to irregular point mea-surements at the lake surface; however they are crucial for understanding the seiche contribution to the transport of sus-pended matter and lake-wide mixing. Moreover, knowledge on relative distribution of seiche intensity along the lake shores is of key importance for shoreline management. With regard to estimation of seiche effects on the littoral zone, our model effectively complements the observation data on the nearshore water level variability, as well as providing
guide-15−Jul 14−Aug 13−Sep 881.2
881.3 881.4 881.5 881.6 881.7 881.8 881.9 882
Height a.s.l. [m]
EO PN SB SM PN USGS
20−Jul 25−Jul 30−Jul 04−Aug 881.6
881.7 881.8 881.9 882
05−Sep 10−Sep 15−Sep 20−Sep 881.6
881.7 881.8 881.9 882
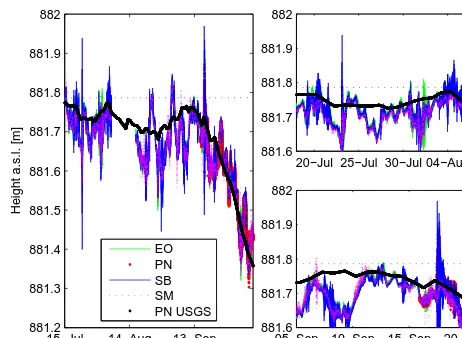
Figure 10. (a) A 3-month outtake of the lake surface oscillations in
Flathead Lake. Panels (b) and (c) show a 15-day zoom of (a) for pe-riods of strong seiche oscillations. The thick solid line is the record from the USGS gauging station in Polson Bay used for regular lake level monitoring. Thin lines are derived from the pressure records at different positions in the lake (see Fig. 1 for measurement lo-cations). The dotted line marks the prescribed maximum regulated elevation of 881.78 m a.s.l.
lines for the design of water level monitoring. Our results do not include information on the absolute magnitudes of water level oscillations and currents. The latter can vary within a wide range, depending on wind forcing and wind–seiche res-onance, or be produced by other disturbances, such as earth-quakes (which are particularly relevant to the Flathead Lake area; Qamar et al., 1982). Variations in wind speed and direc-tion are the major forcing factors for seiches, posing a num-ber of relevant questions: among them, the effects of seasonal variability in wind speeds and direction over the lake on the seiche-produced lateral mixing patterns. The potential con-sequences of this variability for the seiche oscillations would consist in seasonally varying typical seiche amplitudes, sea-sonal intensification of certain seiche modes, and seiche in-teraction with seasonally varying drift currents. Investigation of these seiche-driven processes would be most efficient in the general context of seasonally variable transport within the lake including, along with seiches, the temporally and spatially variable wind drift and the seasonal variability of inflows and outflows. To override the inevitable deficiencies of numerical modeling approaches (such as reproduction of the bottom friction, nonlinear wave transport, and turbulence in stratified interior), model simulations should be combined in these complex investigations with spatially resolved mea-surements at seasonal timescales.
[image:9.612.309.540.63.232.2]im-pacts the mosaic of riparian habitat. Therefore, understand-ing food web dynamics in the lake, management of lake level regulation with dams, and the early detection of aquatic in-vasive species and shoreline development planning can all benefit from a more quantitative understanding of seiche mo-tions, based on a combination of our model results and the monitoring of water level/currents.
Comparison of pressure records from transducers from different locations around the lake show distinct seiche oscil-lations (Fig. 10). Seiche amplitudes exceeded the regulated maximum pool elevation of 881.8 m by up to 15 cm (e.g., in Skidoo Bay; blue line in Fig. 10; see Fig. 1 for the site location). Filtered measurements by the USGS gauge used for water level regulation do not capture these oscillations. The modeling efforts in this paper indicate that this regulated level would be exceeded in other bays along the north shore, including much of the east and west shores of the north half of the lake, bays and shorelines west of Wildhorse Island, and all of Polson Bay. Hence, if lake level regulation is aimed at controlling the shoreline erosion at a lake-wide scale, then an array of real-time lake level sensors situated around the lake has to be used or the maximum elevation threshold has to be reduced by the largest seiche amplitude.
The Supplement related to this article is available online at doi:10.5194/hess-19-2605-2015-supplement.
Acknowledgements. The research was supported by the German
Science Foundation (DFG projects KI 853/5-1, KI 853/7-1) and by the Leibniz Association (project SAW-2011-IGB-2). M. S. Lorang was partially supported by the FLBS Limnology Professorship endowment.
Edited by: H. H. G. Savenije
References
Bernhardt, J. and Kirillin, G.: Seasonal pattern of rotation-affected internal seiches in a small temperate lake, Limnol. Oceanogr., 58, 1344–1360, 2013.
Blumberg, A. F. and Mellor, G. L.: A description of a three-dimensional coastal ocean circulation model, in: Three-Dimensional Coastal Ocean Models, edited by: Heaps, N. S., American Geophysical Union, Washington, D.C., 1–16, doi:10.1029/CO004p0001, 1987.
Csanady, G.: Large-scale motion in the Great Lakes, J. Geophys. Res., 72, 4151–4162, 1967.
Defant, A.: Physical oceanography, Pergamon Press, New York, 1961.
Forel, F.: Le Léman: Monographie Limnologique. Tome 2: méchanique, chimie, thermique, optique, acoustique, F. Rouge, Lausanne, 1895.
Forel, F. and von Zeppelin, E.: Die Schwankungen des Bodensees, Stettner, Lindau, 1893.
Gilman, D., Fuglister, F., and Mitchell Jr., J.: On the power spectrum of “red noise”, J. Atmos. Sci., 20, 182–184, 1963.
Gonella, J.: A rotary-component method for analysing meteorolog-ical and oceanographic vector time series, Deep-Sea Res. Ocean. Abstr., 19, 833–846, 1972.
Hayashi, Y.: Space-time spectral analysis of rotary vector series, J. Atmos. Sci., 36, 757–766, 1979.
Hollan, E., Rao, D., and Bäuerle, E.: Free surface oscillations in Lake Constance with an interpretation of the “Wonder of the Ris-ing Water”at Konstanz in 1549, Arch. Meteorol. Geophys. Biok-limatol. A, 29, 301–325, 1980.
Hutter, K., Raggio, G., Bucher, C., and Salvadè, G.: The surface seiches of Lake of Zürich, Schweiz. Z. Hydrol., 44, 423–454, doi:10.1007/BF02502301, 1982.
Hutter, K., Wang, Y., and Chubarenko, I.: Physics of Lakes Vol. II — Lakes as Oscillators, Springer-Verlag, Berlin, Heidelberg, 2011.
Jönsson, B., Döös, K., Nycander, J., and Lundberg, P.: Standing waves in the Gulf of Finland and their relationship to the basin-wide Baltic seiches, J. Geophys. Res.-Oceans, 113, C03004, doi:10.1029/2006JC003862, 2008.
Kirillin, G., Engelhardt, C., and Golosov, S.: A mesoscale vortex in a small stratified lake, Environ. Fluid Mech., 8, 349–366, 2008. Kulikov, E. and Medvedev, I.: Variability of the Baltic Sea level and
floods in the Gulf of Finland, Oceanology, 53, 145–151, 2013. Lee, J.-J.: Wave-induced oscillations in harbours of arbitrary
geom-etry, J. Fluid Mech., 45, 375–394, 1971.
Lorang, M. S.: The use of sediment analysis, sedimentary structures and water wave measurements to quantify wave energy in a shal-low fresh water bay, Flathead Lake, Montana, Northw. Geol., 13, 5–14, 1984.
Lorang, M. S. and Stanford, J. A.: Variability of shoreline erosion and accretion within a beach compartment of Flathead Lake, Montana, Limnol. Oceanogr., 38, 1783–1795, 1993.
Lorang, M. S., Komar, P. D., and Stanford, J. A.: Lake level reg-ulation and shoreline erosion on Flathead Lake, Montana: A re-sponse to the redistribution of annual wave energy, J. Coast. Res., 9, 494–508, 1993a.
Lorang, M. S., Stanford, J. A., Hauer, F. R., and Jourdonnais, J. H.: Dissipative and reflective beaches in a large lake and the physical effects of lake level regulation, Ocean Coast. Manage., 19, 263– 287, 1993b.
Miles, J. W.: Harbor seiching, Annu. Rev. Fluid Mech., 6, 17–33, 1974.
Miles, J. W. and Munk, W. H.: Harbor paradox, J. Waterways Har-bors Div.-ASCE, 87, 111–130, 1961.
Miles, J. W. and Lee, Y.: Helmholtz resonance of harbours, J. Fluid Mech., 67, 445–464, 1975.
Morrison, A., Williams, A., and Lorang, M.: Waves and seiches in Flathead Lake, Montana: measurements of a quiet lake by differential travel-time current measurements, in: Proceedings of MTS/IEEE, IEEE OCEANS, Washington, D.C., 1421–1426, 2005.
Mortimer, C. H. and Fee, E. J.: Free surface oscillations and tides of Lakes Michigan and Superior, Philos. T. Roy. Soc. Lond. A, 281, 1–61, 1976.
Qamar, A., Kogan, J., and Stickney, M. C.: Tectonics and recent seismicity near Flathead Lake, Montana, Bull. Seismol. Soc. Am., 72, 1591–1599, 1982.
Rao, D. B. and Schwab, D. J.: Two dimensional normal modes in ar-bitrary enclosed basins on a rotating earth: Application to Lakes Ontario and Superior, Philos. T. Roy. Soc. Lond. A, 281, 63–96, 1976.
Rudnev, S. F., Salvadè, G., Hutter, K., and Zamboni, F.: External gravity oscillations in Lake Onega, Ann. Geophys., 13, 893–906, doi:10.1007/s00585-995-0893-2, 1995.
Rueda, F. J. and Schladow, S. G.: Surface seiches in lakes of com-plex geometry, Limnol. Oceanogr., 47, 906–910, 2002.
Schimmelpfennig, S., Kirillin, G., Engelhardt, C., and Nützmann, G.: Effects of wind-driven circulation on river intrusion in Lake Tegel: modeling study with projection on transport of pollutants, Environ. Fluid Mech., 12, 321–339, 2012.
Smagorinsky, J.: General circulation experiments with the primitive equations: I. the basic experiment, Mon. Weather Rev., 91, 99– 164, 1963.
Stanford, J. A., Lorang, M. S., and Hauer, F. R.: The shifting habitat mosaic of river ecosystems, Int. Verein. Theor. Angew. Limnol. Verhand., 29, 123–136, 2005.
Suursaar, Ü., Kullas, T., and Otsmann, M.: A model study of the sea level variations in the Gulf of Riga and the Väinameri Sea, Cont. Shelf Res., 22, 2001–2019, 2002.
Thomson, R. E. and Emery, W. J.: Data analysis methods in physical oceanography, Elsevier, Amsterdam, 2001.