https://doi.org/10.5194/hess-22-5159-2018 © Author(s) 2018. This work is distributed under the Creative Commons Attribution 4.0 License.
Socio-hydrological spaces in the Jamuna River
floodplain in Bangladesh
Md Ruknul Ferdous1,2, Anna Wesselink1, Luigia Brandimarte3, Kymo Slager4, Margreet Zwarteveen1,2, and Giuliano Di Baldassarre1,5,6
1Department of Integrated Water Systems and Governance, IHE Delft Institute for Water Education,
2611 AX, Delft, the Netherlands
2Faculty of Social and Behavioural Sciences, University of Amsterdam, 1012 WX, Amsterdam, the Netherlands 3Department of Sustainable Development, Environmental Science and Engineering, KTH, Stockholm, Sweden 4Deltares, 2600 MH, Delft, the Netherlands
5Department of Earth Sciences, Uppsala University, 75236 Uppsala, Sweden 6Centre of Natural Hazards and Disaster Science, CNDS, 75236 Uppsala, Sweden
Correspondence:Md Ruknul Ferdous (r.ferdous@un-ihe.org) Received: 20 December 2017 – Discussion started: 3 January 2018
Revised: 21 September 2018 – Accepted: 21 September 2018 – Published: 4 October 2018
Abstract.Socio-hydrology aims to understand the dynamics and co-evolution of coupled human–water systems, with re-search consisting of generic models as well as specific case studies. In this paper, we propose a concept to help bridge the gap between these two types of socio-hydrological stud-ies: socio-hydrological spaces (SHSs). A socio-hydrological space is a geographical area in a landscape. Its particu-lar combination of hydrological and social features gives rise to the emergence of distinct interactions and dynamics (patterns) between society and water. Socio-hydrological re-search on human–flood interactions has found two generic responses, “fight” or “adapt”. Distilling the patterns result-ing from these responses in case studies provides a promis-ing way to relate contextual specificities to the generic pat-terns described by conceptual models. Through the use of SHSs, different cases can be compared globally without as-piring to capturing them in a formal model. We illustrate the use of SHS for the Jamuna floodplain, Bangladesh. We use narratives and experiences of local experts and inhabitants to empirically describe and delimit SHS. We corroborated the resulting classification through the statistical analysis of pri-mary data collected for the purpose (household surveys and focus group discussions) and secondary data (statistics, maps etc.). Our example of the use of SHSs shows that the concept draws attention to how historical patterns in the co-evolution of social behaviour, natural processes and technological
in-terventions give rise to different landscapes, different styles of living and different ways of organising livelihoods. This provides a texture to the more generic patterns generated by socio-hydrological models, promising to make the resulting analysis more directly useful for decision makers. We pro-pose that the usefulness of this concept in other floodplains, and for other socio-hydrological systems than floodplains, should be explored.
1 Introduction
to be of high interest to governments who are dealing with strategic and long-term water management and governance decisions (Sivapalan et al., 2012).
As in any newly defined research area, socio-hydrology researchers are looking to determine how to implement their shared goal. This has resulted in a number of overview or po-sition papers (e.g. Blair and Buytaert, 2016; Sivapalan, 2015; Pande and Sivapalan, 2017; Sivapalan and Blöschl, 2015; Troy et al., 2015) as well as several case studies (e.g. Gober and Wheater, 2014; Kandasamy et al., 2014; Liu et al., 2014; Mehta et al., 2014; Srinivasan, 2015; Mostert, 2018). In the discussions, the use of conceptual and deterministic models to analyse concrete situations is an important topic. As in any attempt to produce insights that transcend specific cases, methods of abstraction from reality to find causal relation-ships and stylised equations (generalisation) are sometimes difficult to reconcile with more detailed representations of what is happening in a specific location (Blair and Buytaert, 2016). While enabling global comparison by using data sets from different locations, generic models unavoidably fore-ground some elements or dimensions of flood–society dy-namics to the neglect of others (Magliocca et al., 2018). However, attempts to generalize from case-specific detailed models need to be looked at critically in terms of the compa-rability and commensucompa-rability of the modelled phenomena with what happens elsewhere: detailed causal relationships in one case do not usually correspond to those in other cases (e.g. Elshafei et al., 2014).
In this paper, we focus on another, less formal way to capture socio-hydrological dynamics than causal relation-ships and models: patterns. Pattern detection is no new ac-tivity in socio-hydrology, because patterns are at the basis of the stylised representations (equations) in generic mod-els. Historical patterns are foundational for a full understand-ing of generic as well as place-based models, and pattern finding reinforces the feedback between empirical studies and modelling studies. However, we propose a new socio-hydrological concept to operationalise the search for patterns in the messy reality of specific cases: socio-hydrological spaces (SHSs). Eventually, patterns found in cases may be formalised into causal relationships, but this does not nec-essarily have to be the goal. We contend that patterns in and by themselves are valuable research results, especially in policy development and where data are scarce (Sect. 8). The SHS concept will be defined and its implementation ex-plained in Sect. 3. To illustrate how the concept can be used, we analyse human–flood interactions in the Jamuna flood-plain, Bangladesh, making use of the two generic responses to flood risk “fight” or “adapt” that were found in earlier re-search on human–flood interactions (Sect. 2). In the Jamuna floodplain the differences between land and water are tem-porary and shifting, as is the size of the human population. The application of SHS allows the capture of the different socio-hydrological patterns that result from different societal choices on how to deal with rivers, floods and erosion, which
in turn produce different living conditions and watery envi-ronments (Sects. 4 and 5).
The detection of patterns in socio-hydrological relation-ships can be based on the interpretation of a combination of qualitative and quantitative data; it is therefore more feasible where quantitative data are scarce. This mid-level theorising on the basis of empirically observable patterns was identified by Castree et al. (2014) as a desirable way forward in envi-ronmental research, as it makes it easier to link and translate model-deduced patterns with experienced realities. By pro-viding locally relevant details and texture to more generically deduced patterns, SHS provides a useful methodological ad-dition to the socio-hydrological understanding of floodplains. Its usefulness to other contexts such as irrigated catchments or urban water systems could also be investigated.
2 Patterns in the socio-hydrology of floodplains: fight or adapt
One type of situation that is relatively well studied by socio-hydrologists is the co-evolution of human societies and wa-ter in floodplains. Afwa-ter all, the existence of inwa-terdependen- interdependen-cies between societies and their natural environment is par-ticularly obvious in floodplains. Since the beginning of hu-man civilisation, hu-many societies have developed in flood-plains along major rivers (Vis et al., 2003). In spite of period-ical inundations, a distinct preference for floodplain areas as places to settle and live in stems from their favourable condi-tions for agricultural production and transportation, enabling trade and economic growth (Di Baldassarre et al., 2010). Yet, floodplain societies have to learn how to deal and live with periodic floods and the relocation of river channels by ero-sion and deposition (Sarker et al., 2003). In general terms, floodplain societies do this by evaluating the costs of flood-ing and erosion against the benefits that rivers brflood-ing, and deciding whether to try to mitigate the risks by defending themselves against floods (“fight”), or to live with floods (“adapt”), or any combination of the two (Di Baldassarre et al., 2013a, b). Whether and how societies can fight or adapt to flooding depends on the society’s economic and techno-logical possibilities. Therefore, “fight” and “adapt” are the two generic responses in the socio-hydrological dynamics of human–flood interactions. These combine differently in different contexts and locations, resulting in different socio-hydrological patterns.
along-side it (Hofer and Messerli, 2006). An alternative response to flooding is adaptation. In order to adapt to flood risks, soci-eties may limit costly investments in property or make them movable, adjust cropping patterns or choose crops that can cope with flooding, or move away altogether if alternative locations for settlement are available. Even when flood pro-tection measures are in place, residual risks may necessitate adaptation measures. This means that in any real situation the two responses of “fight” and “adapt” are usually found together in a site-specific configuration, depending on socio-economic, institutional and natural conditions. We label the areas where the proportions are analogous due to similar con-ditions (SHSs; see Sect. 3).
The study of floodplains using a socio-hydrological ap-proach has advanced rapidly in the last few years (Di Bal-dassarre et al., 2013a, b, 2015; O’Connell and O’Donnell, 2014; Viglione et al., 2014; Chen et al., 2016; Grames et al., 2016; Ciullo et al., 2017; Barendrecht et al., 2017; Yu et al., 2017). In this research, the two responses to flooding “fight” and “adapt” take centre stage. The overall aim of this work is to further understanding on “how different socio-technical approaches in floodplains are formed, adapted and reformed through social, political, technical and economic processes; how they require and/or entail a reordering of social relations leading to shifts in governance and creating new institutions, organisations and knowledge; and how these societal shifts then impact floodplain hydrology and flooding patterns” (Di Baldassarre et al., 2014, p. 137).
Two different methodologies for the study of floodplains can be broadly distinguished, in parallel with general trends in socio-hydrology found by Wesselink et al. (2017). The first approach presents a narrative representation of the flood-plain’s socio-hydrological system. The narrative is generally based on qualitative research, often informed by experiences and knowledge of local experts and inhabitants about his-tories of living with floods, but may also include statistical data, e.g. on trends. The resulting studies describe historical patterns in the co-evolution of river dynamics, settlement pat-terns and technological choices (Di Baldassarre et al., 2013a, 2014). Not all researchers who engage in this kind of study identify their work as belonging to socio-hydrology (e.g. Van Staveren and Tatenhove, 2016; Van Staveren et al., 2017a, b). In this qualitative research, the actual societal choices between “fight” and “adapt” are descriptively represented, without formalisation.
The second approach to studying socio-hydrological dy-namics of floodplains focusses on the development and use of a generic conceptual model of human–nature interac-tions, which is subsequently expressed in terms of differen-tial equations (e.g. Di Baldassarre et al., 2013b, 2015; re-viewed in Barendrecht et al., 2017). This second approach also starts with a narrative understanding of the situation, in which patterns are key for deriving causal relationships. These narratives narrow down complex realities to a selec-tion of phenomena and elaborate trends and causal relaselec-tion-
relation-ships that are subsequently captured in mathematical mod-els (see Elshafei et al., 2014, for a clear example of the role of narratives). Generic models aim to explain the feedback mechanisms that produce certain phenomena (often para-doxes or unintended consequences) that have been observed in many places around the world. For example, the stylised models of human–flood interactions introduced by Di Bal-dassarre et al. (2013b) use a mathematical formalisation of a fundamental hypothesis: the levee effect (White, 1945) is explained by a decrease in risk awareness when flooding be-comes less frequent because of the introduction (or reinforce-ment) of structural protection measures. This generic model has been used to explore and compare alternative scenar-ios of floodplain development (Di Baldassarre et al., 2015; Viglione et al., 2014). Current research includes further re-finement (Grames et al., 2016; Yu et al., 2017) or compar-ison of this generic model to actual data for specific cases (Ciullo et al., 2017; Di Baldassarre et al., 2017). Yet, as so-cietal responses to hydrological changes (including flood oc-currences) are “very complex and highly unpredictable as it strongly depends on economic interests and cultural values” (Di Baldassarre et al., 2015, p. 4780), formalisation is chal-lenging.
3 Socio-hydrological spaces defined
To reflect pattern detection as intermediary activity be-tween modelling and reality, we define a socio-hydrological space in two ways: from the empirical observations, which may include quantitative data but also general contextual knowledge (“bottom-up”), and from the conceptual models of the general patterns found in human–flood interactions (“top-down”). Starting from the empirical observations cap-tured in quantitative and qualitative data, we define a socio-hydrological space as a geographical area in the landscape with distinct hydrological and social features that give rise to the emergence of distinct interactions and dynamics between society and water. Starting from the generic patterns cap-tured in conceptual modelling, a socio-hydrological space is the empirical expression of a specific combination of generic responses (here: fighting and adaptation dynamics) in a ge-ographical area that is distinct from the neighbouring one. Importantly, both definitions apply simultaneously and are operationalised in an iterative manner to study the socio-hydrology of an area as shown in the example for the Jamuna flood plain (Sects. 4 to 6).
recog-nising patterns (due to combinations of similar or comparable fight and/or adapt responses). We thus propose that SHS can serve the function of a lens through which to view and filter the complex reality of specific cases, in order to find pat-terns in human–water interactions. Such patpat-terns can then be compared and contrasted to patterns in other locations to see if further generalisation towards generic models is possible. The use of SHS invites the researcher to have an open mind to the existence of expected or unexpected patterns in the lo-cation under investigation, using a thorough understanding of the specifics of this location in terms of society, history, economics, natural systems, technical interventions etc. In-sights from one location can then be compared to analyses of other cases in order to explore whether the same or different patterns occur, and for the same reasons. These patterns can then be generalised through a more formal conceptualisation of socio-hydrological systems, whereby the existing concep-tual models may be taken as a starting point. On the one hand SHS thereby relates to a specific space; on the other hand it helps to find general patterns of human–water interactions, which means that use of SHS to analyse different cases en-ables global comparison.
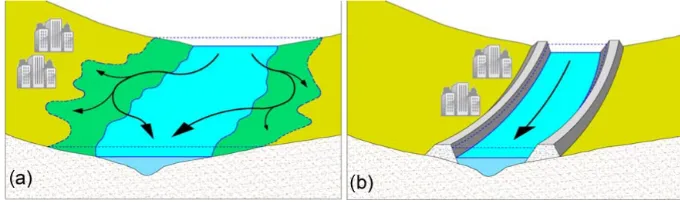
It is interesting to note that some of the earlier socio-hydrological research on floodplains can be said to implic-itly employ something resembling the SHS concept (Fig. 1). In their study, which is partly based on the Po floodplain, Di Baldassarre et al. (2013a, 2014) identify two patterns of society–river interactions. In the “adaptation effect” pattern the use of flood defence technology is limited, resulting in frequent flooding that is in turn associated with decreasing vulnerability (see also Kreibich et al., 2017). The “levee ef-fect” pattern results when flood protection structures lead to less frequent but more severe flooding, which is in turn as-sociated with increasing vulnerability (Di Baldassarre et al., 2015) (already identified by White, 1945; see also Kates et al., 2006). These two patterns can be rendered in terms of SHS, yielding the following classification:
a. the “adaptation space”, where frequent flooding results in less economic development and lower population density and other human adjustments;
b. the “fighting space”, where flood protection structures lead to less frequent but more severe flooding, more eco-nomic development and higher population density and other human adjustments.
In these first conceptualisations, one floodplain is assumed to show one or the other pattern at one point in time, while allowing shifts over time from adaptation to levee effect (Di Baldassarre et al., 2013a). This classification categorises a floodplain as having one single socio-hydrological pattern (“fight” or “adapt”). Di Baldassarre et al. (2015) then clas-sify several floodplains worldwide in one of the two patterns. For example, they classify Bangladesh as a whole into the “adapt” type. However, it turns out that several sections of the
floodplain in Bangladesh are protected by an embankment (see Sect. 5), with residual flood risks giving rise to adap-tation behaviour. Similarly, their classification of the Rhine floodplain in the Netherlands as “fighting floods” holds in general, though in several places adaptation is being experi-mented with (Wesselink et al., 2007; Van Staveren and Van Tatenhove, 2016). In the same country, the Meuse valley was classified as “adaptation” although embankments have been added to protect built-up areas (Reuber et al., 2005; Wes-selink et al., 2013). As the goal of generic models is to de-scribe decadal dynamics at large scale (Di Baldassarre et al., 2013b), they can only capture the main phenomena in large areas, such as a whole floodplain (in time or space) or a river basin. Instead, SHSs induce the researcher to further refine the analysis of human–flood interactions from the generic to the more local where, for example, both responses may co-exist at one time in specific proportions. In this way, SHSs allow more specific and detailed representation of the real-ity of these interactions, while still enabling comparison be-tween cases by referring to generic patterns. In what follows, we illustrate how the concept can be used in a more detailed and refined analysis of the Jamuna floodplain in Bangladesh. We show how its use can provide nuances to the broad-sweep overall classification by showing that within this overall char-acterisation some areas to some extent exhibit a “levee ef-fect”, while other areas do not fit the two-way classification. To use the concept of SHS, we propose a two-step ap-proach. First, the top-down definition of SHS guides the re-searcher to look for the generic patterns in the information collected about the study area. As noted this information is based on a thorough understanding of a specific floodplain (geography, history, technology, societal occupation etc.). This results in a preliminary geographical delineation of dis-tinct SHSs and their qualitative descriptions by means of nar-ratives, schematised drawings, maps etc.; these results have the function of being hypotheses in the next step. In the sec-ond step, quantitative data analysis is employed to confirm, reject or correct these initial hypotheses; that is, this analy-sis provides the data-driven (bottom up) delineation of SHS. If the classification is not statistically significant, merging or splitting of categories should be considered as well as re-drawing the boundaries (repeat step 1). However, this adjust-ment should always be based on arguadjust-ments based on a good understanding of the floodplain, since statistical significance by itself does not explain socio-hydrological dynamics.
Figure 1.Schematic of human adjustments to flooding –(a)adaptation: settling away from the river, and(a)fighting: raising levees or dikes (after Di Baldassarre et al., 2013b).
Sect. 4.3) could be different, as long as they contribute to the goal of identifying and validating SHS.
The following case study demonstrates how the SHS ap-proach can be used. Our goal is not to include all available data to provide an exhaustive analysis, but to show how SHS help to detect and understand socio-hydrological dynamics. The socio-hydrological characteristics and data availability guide the choice of methods in our socio-hydrological analy-sis of a part of the Jamuna floodplain in Bangladesh. In other circumstances the application of SHS will likely entail dif-ferent variables and methods.
4 Research approach 4.1 Case study area
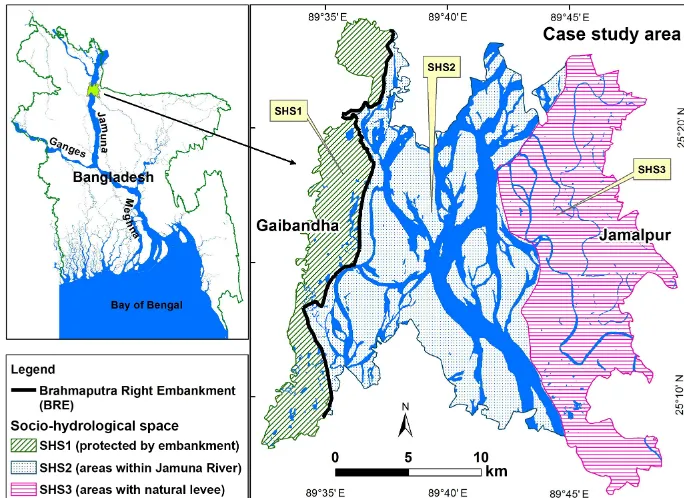
The delta where the Ganges, Brahmaputra and Meghna rivers meet the sea in the Bay of Bengal encompasses 230 river channels and covers most of Bangladesh (Mirza et al., 2003). It is the largest delta in the world, draining almost all of the Himalayas, the most sediment-producing mountains in the world (Goodbred et al., 2003). The flows of the three rivers add up to an average of 1 trillion cubic metres of water per year and 1 billion tonnes of sediment per year. The sediment load is very high, resulting in very dynamic river channels (Allison, 1998). In the early 18th century, the main course of the current Jamuna was flowing through what is now the Old Brahmaputra, to the east of the Jamuna. Sometime between 1776 and 1830 the course of the Brahmaputra shifted from east to west, and the “new” river was given the name Jamuna. Since then, the Jamuna has shown progressive westward mi-gration and widening, meanwhile transforming from a mean-dering river to a braided one (CEGIS, 2007). The Brahmapu-tra Right Embankment (BRE) was constructed on the west bank of the Jamuna in the 1960s to limit flooding and in-crease agricultural production, and also to try to stabilise the position of the river, the latter with limited success despite the addition of groynes and spurs.
Bangladesh is a very densely populated country with more than 140 million of people (964 persons per km2). Around 80 % of the population lives in floodplain areas
(Tingsan-chali and Karim, 2005) and depends on agriculture and fish-eries (BBS, 2013). In the monsoon season, 25 %–30 % of the floodplain area is inundated every year (Brammer, 2004). These “normal” floods are valued by rural inhabitants be-cause they are beneficial to the fertility of the land and pro-vide ecosystem services (fish stock) and transportation pos-sibilities (Huq, 2014). According to the classification by the Flood Forecasting and Warning Centre, which categorises flooding events as normal, moderate and severe based on flood duration, exposure, depth and damage, extreme flood events were observed in 1954, 1955, 1974, 1987, 1988, 1998, 2004 and 2007 (FFWC/BWDB, 2017); the flood events since then were not judged to be extreme in the whole country, but in north-western Bangladesh, which includes our study area, 2016 and 2017 were also extreme (FFWC/BWDB, 2017). Throughout the years, successive governments have imple-mented several flood control measures to protect agriculture and populations from floods (Sultana et al., 2008).
Riverbank erosion is associated with flooding in many ar-eas of the country. The extremely poor people who live on the chars (islands in the big rivers) are most exposed to and af-fected by flood hazards and riverbank erosion. During the pe-riod 1973 to 2015, the net erosion was 90 413 ha and the net accretion 16 497 ha along the 220 km long Jamuna (CEGIS, 2016). Every year about 50 000 to 200 000 people are dis-placed by riverbank erosion, although they usually find an-other place to settle nearby in the area (Walsham, 2010). Hence, it is clear that hydrological processes (flooding and riverbank erosion) play a vital role in the way people in Bangladesh organize their lives, as manifested, among other things, in patterns of migration, livelihoods and land use.
Figure 2.Bangladesh map with case study area and SHSs.
with severe floods). The maintenance of the BRE in the study area has been sporadic. When constructed, the average height was 4.5 m, width 6 m and slope 1:3 on both sides (CEGIS, 2007). Though extreme discharges could not overtop this em-bankment, breaches have occurred which caused catastrophic floods and damages (RBIP, 2015). In the 2016 flood (ob-served during the field survey), the BRE was breached in Gaibandha district, resulting in a large area being flooded. On the left bank there is no human-made protection, but there is a natural levee that has been deposited by the river.
4.2 Step 1: preliminary identification of SHS and classification of areas
Throughout the fieldwork period needed to collect the pri-mary data described in Sect. 4.3 below, a detailed knowledge of physical, technical and social conditions of the area was accumulated by the first author. In collecting this informa-tion, he built upon and was guided by his personal knowledge as a resident in a nearby area, as well as by 10 years of pro-fessional experience throughout Bangladesh as a water engi-neer charged with flood forecasting and training residents on using flood and erosion forecasts. Since flood control mea-sures were only developed along some rivers (see Sect. 4.1 above), the study area is characterized by different degrees of protection. In addition to these human-made structures, different geomorphological conditions influence local flood frequency and extent as well as the extent of river bank ero-sion. Inhabitants adapt to these physical conditions, which is apparent, for example in private investment levels and
crop-ping patterns, but also in public investment, e.g. in schools and roads. These qualitative observations formed the basis for distinguishing three SHSs in the landscape, which are de-scribed in a narrative fashion in Sect. 5. To demarcate the SHSs we used administrative boundaries (unions and mauza) since this enabled the use of Government data in Step 2; 15 unions are included in the study area.
4.3 Step 2: evidence
The demarcation of SHSs was validated through the analy-sis of primary data (household surveys and focus group dis-cussions) and secondary data (statistics, maps etc.) collected during the dry seasons of 2015 and 2016. The principal set of primary data consists of approx. 900 questionnaires deal-ing with several themes: general information (location of set-tlement and agricultural land, main occupation, age, income and expenditures, wealth and origin of the households), in-formation on different flood experiences (depth of floods, frequency, duration, flood damages, effects on agricultural income and expenditures, adaptation options, migration etc.) and experiences with river erosion (frequency, damages, mi-gration, adaptation options etc.). We also set up focus group discussions in most unions in the case study area to validate and contextualise the survey data. Details of these methods are given below.
who differ in the variables of interest but share other char-acteristics, such as socio-economic status and ethnicity. We aimed to collect approximately the same number of surveys in each of the three SHSs. Due to the rural setting, most of the respondents were farmers. We introduced an age bias be-cause we wanted to collect historical information on flood-ing, riverbank erosion, livelihood etc. The household surveys were implemented with a combination of purposive sampling and quota sampling. Purposive sampling is a method where individuals are selected because they meet specific criteria (e.g. farmer, fisherman, day labourer). The quota sampling method selects a specific number of respondents with partic-ular qualities (like that a farmer’s age should be 40 or above). We used the Raosoft sample size calculator to determine the required sample size for the surveys by union. This calcu-lator allowed values to be entered, including an acceptable margin of error, response distribution, confidence level and size of the population that is to be surveyed. We accepted a 5 % margin of error with 95 % confidence level to determine the sample size, which is 1 % of households (863 household surveys) in the case study area. The questionnaire for the sur-vey is provided in the Supplement (ESM1).
In addition, we performed 12 focus group discussions in the case study area – 4 meetings in different unions in each SHS. About 20 participants were present in each of the meet-ings. Participants were selected based on occupation and lo-cation of the households, guaranteeing a uniform spread over the union area. The topics of the discussions were as follows: how flooding is affecting livelihoods; what household cop-ing strategies are used in relation to floodcop-ing, for example changing occupation or raising homesteads; migration pat-terns; community interventions against flooding; river bank erosion and household coping strategies; community inter-ventions against riverbank erosion; governmental initiatives against flooding and riverbank erosion etc. The agenda of the focus group discussions is provided in the Supplement (ESM2).
We also collected secondary data like time series satel-lite images to analyse the morphological dynamics of the Ja-muna and census population data to analyse population den-sity from different governmental and non-governmental or-ganisations of Bangladesh. Results of Step 2 are discussed in Sect. 6.
5 Results step 1: identification of socio-hydrological spaces along the Jamuna River
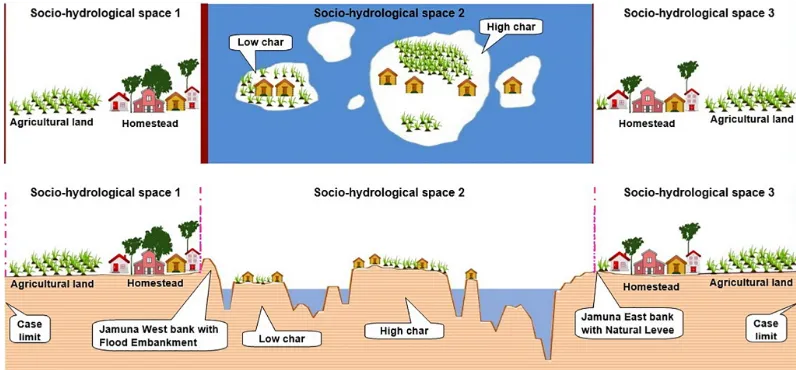
As noted, in our study area along the Jamuna, three distinct socio-hydrological spaces were identified. SHS1 covers the areas protected by the BRE (on the west bank), SHS2 cov-ers the char areas (in the river bed) and SHS3 includes areas with a natural levee (on the east bank). These are depicted in a schematised fashion in Fig. 3 and described by means of narratives below.
5.1 Areas protected with flood embankment (west bank) (SHS1)
This socio-hydrological space is protected from regular an-nual flooding, the so-called “normal floods”, by the embank-ment along the main river Jamuna (BRE) and along some smaller Jamuna tributaries. However, different parts of the area are still frequently inundated with excess rainwater, due to their low elevation and limited drainage capacity. Further, a few small rivers (Ghagot and Alai) inundate unprotected areas yearly in the western part of the area. Because the BRE effectively protects the area against all but the largest riverine flooding from the Jamuna, inhabitants feel confident enough to invest in businesses and homesteads. In the study area, Gaibandha district, the BRE is not very well maintained, so the BRE sometimes breaches. Inhabitants build their houses on artificially raised platforms – often several metres above ground level – to reduce their vulnerability to the resulting floods. River bank erosion in this area is not widespread, but does occur in several locations. SHS1 therefore shows a com-bination of the “fight” and “adapt” patterns.
5.2 Floodplain outside the embankment (west bank) and chars (SHS2)
This is a very dynamic environment. The Jamuna is a braided river, where multiple channels criss-cross within the outer boundary of the river. When considered over decades, the outer boundary is moving in a westward direction (CEGIS, 2007). The “chars” – or river islands – are also moving, progressing or disappearing, due to local erosion processes. Chars have different ages, which have a direct relation to the height level. As the river still deposits sediment on chars, some older chars have higher elevations than the areas in SHS1 and have been shown to remain dry in extreme flood conditions. If a newly developed char does not erode imme-diately, it is first colonised by grass, which accelerates depo-sition of silt during the next flooding. Subsequently, people start to occupy the char, planting fast-growing trees and lay-ing out agricultural fields. In the course of time, all kinds of facilities like schools, mosques, small shops, bazaars etc. are established. Since the chars are not stable, most of the houses built in the chars are semi-permanent and easy to take apart and move. House types are kutcha (wood, straw and bamboo mats) or jhupri (straw). Many people raise the plinth levels of their houses to avoid flood damages, but this is not very effective.
Figure 3.A typical planform and cross section with distinct SHSs along the Jamuna.
char when floodwaters have receded. People also sometimes change their occupation temporarily or permanently. As char dwellers’ lifestyles are defined by flood and erosion, they ap-pear to be able to cope with the harsh conditions. Yet, most of them become poorer through time, because of landless-ness, unreliable and changing sources of employment, and frequent temporary migration or resettlement. SHS2 there-fore shows only the “adapt” pattern.
5.3 East bank (areas with natural levee) (SHS3) The natural levee on the east bank of the Jamuna protects this area from about half of the annual riverine flooding; flooding occurs more frequently than in SHS1. A few ar-eas are flooded by smaller rivers like the Old Brahmapu-tra and Jinjira. High water levels in these rivers sometimes occur independently of high water levels of the Jamuna, as these are not part of the same drainage basin. River bank ero-sion is conspicuous in this area. Even though the river as a whole shows a gradual westward shift, due to the presence of highly erodible bank materials on the left bank erosion is still severe in SHS3. For example, 75 ha of land eroded in 2015 in this area, of which 4 ha contained housing (CEGIS, 2016). Inhabitants take the initiative to build small spurs and bank protection, made from bamboo and wood, to try to stop erosion. However, while these encourage sedimen-tation at a local scale, they are not sufficient to stop large-scale erosion. As in SHS1, most houses are built on artifi-cially raised mounds, substantially reducing the potential for flood impacts. Flooding and riverbank erosion cause damage to agriculture, homesteads and businesses, in turn impover-ishing people. As in SHS1 and SHS2, migration is one of the coping strategies, while households also adapt their cropping pattern to accommodate flooding and cultivate fast-growing crops after the flood season. SHS3 therefore shows a
combi-nation of the “fight” and “adapt” patterns, with more “adapt” and less “fight” than SHS1.
6 Results step 2: evidence of socio-hydrological spaces along the Jamuna River
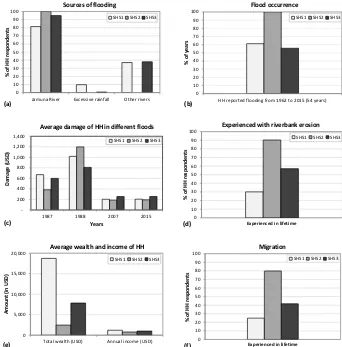
Using the data described in Sect. 4.3, in this section we show that the three SHSs described above are significantly different. We only show the results for a limited number of variables: perceptions of the sources of flooding, flood frequency, flood damages, average household income and wealth, river bank erosion, migration and homestead types in the three identified SHSs. We performed statistical analy-sis Chi-square tests and ANOVA tests (p<0.05) with these data for all analyses below (details are provided in ESM3). In each case the data for the three socio-hydrological spaces were significantly different.
6.1 Perception of the sources of flooding
0 10 20 30 40 50 60 70 80 90 100
Jamuna River Excessive rainfall Other rivers
% o f H H re spo nde nts
Sources of flooding
SHS1 SHS2 SHS3
(a) 0 10 20 30 40 50 60 70 80 90 100
HH reported flooding from 1962 to 2015 (54 years)
% o
f y
ear
s
Flood occurrence
SHS1 SHS2 SHS3
(b) 200 400 600 800 1,000 1,200 1,400
1987 1988 2007 2015
Da ma ge ( USD ) Years
Average damage of HH in different floods
SHS1 SHS2 SHS3
(c) 0 10 20 30 40 50 60 70 80 90 100 % o f H H re spo nde nts
Experienced in lifetime
Experienced with riverbank erosion
SHS1 SHS2 SHS3
(d) 0 5,000 10,000 15,000 20,000
Total wealth (USD) Annual income (USD)
Amou
nt
(i
n USD
)
Average wealth and income of HH
SHS1 SHS2 SHS3
(e) 0 10 20 30 40 50 60 70 80 90 100 % o f H H re spo nde nts
Experienced in lifetime
Migration
SHS1 SHS2 SHS3
[image:9.612.128.470.66.413.2](f)
Figure 4.Comparison in between different socio-hydrological spaces (HH=household).
6.2 Flood occurrence
When asked about their recollection of historical flood events (Fig. 4b), in SHS2 people indicated that they experienced flooding every year. In both other spaces, this is roughly only once every 2 years. The unexpected relatively high flood quency for the protected SHS1 may be attributed to the fre-quent failure of the embankment and to the fact that the area is flooded from the west by the Ghagot River, a tributary of the Jamuna.
6.3 Flood damage
The 1988 flooding was the most severe event for all three spaces, ranging from average damage of USD 800 per house-hold in SHS3 to USD 1200 in SHS2 (Fig. 4c). In other years, average flood losses were much lower. In 1987, damages in SHS1 were highest of the three spaces (USD∼700 per household). This may be attributed to poor drainage capacity in SHS1, as well as a lower average land elevation, resulting in deeper and longer water logging. Damages in 2007 and 2015 show little difference between the three SHSs (USD∼
200 household). It is interesting to observe that (apart from the 1988 event) flood damage in SHS2 is lower than damage in SHS1 and SHS3. This is not only because people there are generally poorer (Fig. 4e), but also because people there are better adapted to frequent flooding (as they get flooded every year; see Fig. 4b). Yet, while people in SHS2 have adapted to frequent flood events, this adaptation does not make them less vulnerable to big floods, such as the one of 1988 (see Fig. 4c). This outcome was unexpected, and it would not be captured by any of the current models of human–flood inter-actions proposed so far.
6.4 River bank erosion
6.5 Average household income and wealth
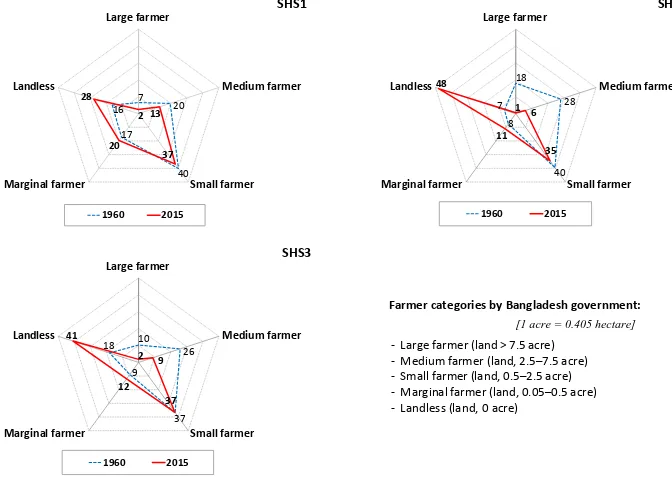
The average wealth distribution (Fig. 4e) clearly shows the economic differences between the households in the three SHSs. In the protected areas, people have much more wealth, on average about USD 19 000 per household, against approx. USD 2500 in SHS2 and USD 8000 in SHS3. Household wealth includes land (homestead, agricultural, other land), ponds, houses and housing materials, livestock, and portable wealth like savings, gold and silver. About 80 % of the people in the case study area are farmers, so their income mostly de-pends on their agricultural production, complemented by re-mittances from migrant labour by family members for some families and from occasional day labour in agriculture, con-struction or fishing, or as rickshaw driver or van puller. Their starting position and subsequent losses depend to a large extent on where they live. The current situation is (much) worse for most households than in the past. As per our sur-vey, in SHS1 large farms made up 7 % of households (with land > 3 ha) in 1960 but after consecutive flooding events, this was reduced to only 2 % in 2015 (Fig. 5). Those who owned most land in the past (>3 ha) gradually saw a decline in their farm land to medium (1–2.99 ha) or small (0.2–0.99 ha), with some even becoming landless. There were only 16 % landless households in 1960, but this increased to 28 % in 2015.
In SHS2 and SHS3 a comparable pattern can be observed. The number of large farm households reduced from 18 % to 1 % and landless farmer households increased from 7 % to 48 % in SHS2. In SHS3 the proportion of large landowners reduced from 10 % to 2 % and that of landless farmers in-creased from 18 % to 41 %. More than 80 % of the respon-dents from SHS2 reported that they could not recover from the losses due to flooding and riverbank erosion. Many of them have to change their occupation temporarily, and 3 % of the respondents in SHS2 changed their occupation per-manently from farmer to day labourer. This is less than the reduction in land ownership would suggest because landless farmers will try to rent land to be able to cultivate their own crops. If this is the case, they share crops with the land own-ers or pay a fixed amount per year.
There is a possibility that some respondents exaggerated reported losses in the hope that the research would help to mobilise funds. The focus group discussions clarified this issue. They revealed that cropping patterns in SHS1, SHS2 and SHS3 are different. Respondents in SHS1 are cultivat-ing three crops per year. In SHS3 people used to cultivate three crops in the past, but due to flooding, they now culti-vate either two crops or only one crop per year, only in the dry season after floods have subsided. From the survey data it appears that in SHS1 only 15 % of the respondents changed cropping patterns between the 1960s and the 2010s, com-pared to 53 % in SHS3 and 40 % in SHS2. A very small num-ber of people have changed land use completely, for exam-ple from agriculture to homestead, from low elevation land
to high elevation land by filling silts, or from agriculture to fallow etc.
6.6 Migration
The population density census data for the three spaces show much higher densities in SHS1 than in SHS2 and SHS3. In SHS1 it is 1500 people per square kilometre (varying be-tween 1000 to 3000 people per square kilometre in the dif-ferent villages in SHS1), while population density in SHS3 is 800 people per square kilometre (between 100 to 2000 people per square kilometre, the lowest figure being for very few villages adjacent to the east bank). It is lowest in SHS2 at 400 people per square kilometre (varying between 30 to 1000 people per square kilometre) (BBS, 2013). The histori-cal population data from 1961 to 2011 show that population density has increased in most of the unions, except in SHS2 (CPP, 1961; BBS, 1974, 1986, 1994, 2001 and 2013). Un-fortunately, there are no official records of the exact num-ber of people who migrate out of the area on a temporary or permanent basis. From our survey, we found that temporary or permanent migration is most frequent in SHS2, mostly to SHS1 and SHS3. From 1988 to 2015, 17 % of respondents had migrated to SHS1 and 8 % to SHS3.
The study shows that riverbank erosion (Fig. 4d), more than flooding (Fig. 4b), is one of the main drivers for relo-cation from a place of origin (Fig. 4f). We found that 80 % of the households in SHS2 had moved at least once. Most of them moved within 5 km, but in focus groups it was said that about 25 % of people of that area had migrated away to other districts. About 68 % of respondents were born in SHS1 and still live there, while 25 % migrated to SHS1 from other places due to riverbank erosion. In SHS3, about 58 % were born locally and the rest moved into the area, again mostly due to riverbank erosion. The respondents who re-located within the study area knew that their destination was flood-prone and at risk from riverbank erosion. However, the lack of available land is a major problem so they contend with sub-optimal conditions.
6.7 Homestead types
7 20
40 17 16 2 13
37 20 28
Large farmer
Medium farmer
Small farmer Marginal farmer
Landless
SHS1
1960 2015
18 28
40 8 7 1 6
35 11 48
Large farmer
Medium farmer
Small farmer Marginal farmer
Landless
SHS2
1960 2015
10 26
37 9 18
2 9
37 12 41
Large farmer
Medium farmer
Small farmer Marginal farmer
Landless
SHS3
1960 2015
Farmer categories by Bangladesh government:
[1 acre = 0.405 hectare]
[image:11.612.129.465.68.307.2]- Large farmer (land > 7.5 acre) - Medium farmer (land, 2.5–7.5 acre) - Small farmer (land, 0.5–2.5 acre) - Marginal farmer (land, 0.05–0.5 acre) - Landless (land, 0 acre)
Figure 5.Agricultural land changes with time of the different types of farmer (% of HH respondents).
SHS3
Well-constructed building using modern masonry materials Houses made of brick and tin
House made of earthen floor, wood, paddy straw and bamboo mats Houses made of straw
2 12
77 9
SHS1
0 3
76 21
SHS2 0
1
89 10
SHS3
Figure 6.Homestead type of households.
7 Discussion
Based on thorough in-depth knowledge of the natural, tech-nical and social conditions of the study area in the floodplain of the Jamuna River in Bangladesh, we proposed distinguish-ing between three SHSs as the basic spatial units each with distinct socio-hydrological characteristics. Human–flood dy-namics are different in each space, ranking from “adapt to floods” (SHS3), to more (SHS1) or less (SHS2) “fighting floods” in combination with “adapt to floods” to the extent necessary. We then proceeded to demonstrate, through statis-tical analysis of primary and secondary data, that the SHSs show significant differences in the following hydrological and social variables: perceptions of the sources of flooding,
flood frequency, flood damages, average household income and wealth, river bank erosion, migration, and homestead types.
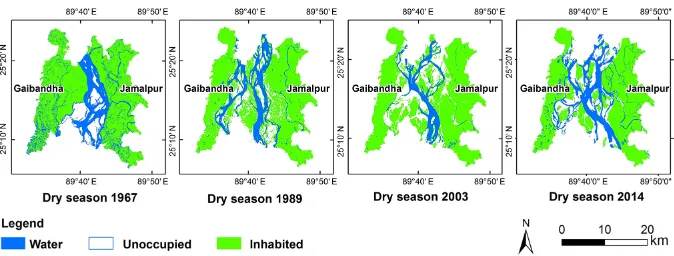
[image:11.612.130.465.340.478.2]Figure 7.Time series dry season satellite images of the case study area.
instead of three spaces. The categorisation of the study area into spaces therefore depends on the focus of the study, but this does not invalidate the results. Rather, it shows that every abstraction, whether to find patterns or causal relationships, requires selective treatment of reality.
The issue of drawing boundaries around the SHS gives rise to another qualification. We started by outlining the bound-aries of three SHSs based on the presence of distinct physi-cal features in the landscape: the embankment on the west bank, the natural levee on the east bank and the riverbed in between. The exact boundaries were drawn on pragmatic grounds, using the administrative boundaries that best align with the physical features. These boundaries might show the approximate SHS in the present, but the boundaries of the physical and social systems are not fixed in time. The physical boundaries of the SHS are quite dynamic due to continuing bank erosion along both banks of the Jamuna (CEGIS, 2007). In particular, by analysing satellite images of the case study area from the late 1960s up to now, it ap-pears that the west bank has been migrating westward and the east bank has been migrating eastward. As a result, the length-averaged width of the river has increased from 8.17 to 11.68 km (CEGIS, 2007). Since the construction of the BRE in the 1960s, many breaches have occurred due to river bank erosion, forcing relocation of the embankment in many places (RBIP, 2015). At the same time, due to erosion of the east bank the natural levee also moved somewhat over time. Thus, the physical boundaries between SHS1-SHS2 and SHS2-SHS3 are not fixed in time, while our statisti-cal analyses assume that they are since they use the current physical boundaries. The social boundaries of the SHS in the Jamuna floodplain are also dynamic. Due to frequent relo-cations and migrations, the current inhabitants of the SHS may not have lived there throughout the study period since in every extreme event some migration occurs among the spaces (see Sect. 6.6). Therefore, the social boundaries be-tween SHS1–SHS2 and SHS2–SHS3 are not fixed in time ei-ther, while our statistical analyses assume that they are since they relate to the current inhabitants. The dynamic nature of the boundaries of the SHS is unavoidable and indeed
intrin-sic to the highly dynamic socio-hydrology of the floodplain system. It is therefore important to remember that the SHSs are defined by their unique socio-hydrological characteristics compared with the surrounding area, not by their exact coor-dinates. For example, SHS2 is defined as a char within the river. If the river moves a kilometre and the char moves with it (or a different char forms), this does not change the defini-tion of SHS2 as a char within the river. The same holds for the social boundaries, if one person moves to another SHS and adopts the strategies of that SHS, then the SHS does not change1. Ideally, the data collection and analyses of time se-ries in Step 2 would follow these shifting boundase-ries, but this will most likely not be possible due to data scarcity or time constraints.
8 Conclusions
We introduced the concept of socio-hydrological spaces (SHSs) and applied it to a floodplain area along the Jamuna River in Bangladesh. SHSs delineate areas where the inter-action between social and hydrological processes show dis-tinct characteristics, which in the case of floodplains can be classified as different combinations of two basic responses identified in the literature: “fight floods” or “adapt to floods”. SHS are therefore primarily a research tool that helps to iden-tify patterns in a specific case. However, when SHS are ap-plied to other floodplains this will enable global comparison of human–flood interactions elsewhere. For example, similar SHSs to the ones found in the Jamuna floodplain are known to exist further down and upstream along the same river (known as Brahmaputra in India), so it would be worthwhile to compare socio-hydrological characteristics and analyse their differences and similarities.
Applying the SHS concept draws attention to the histor-ical patterns in the co-evolution of social behaviour, natural processes and technological adoptions that give rise to differ-ent landscapes, differdiffer-ent styles of living and differdiffer-ent ways
1We would like to thank one of the anonymous reviewers for
of organising livelihoods in specific geographical locations. The SHS concept suggests that the interactions between soci-ety and water are place-bound and specific because of differ-ences in social processes, technological choices and oppor-tunities, and hydrological dynamics. Such attention is useful anywhere in the world and also for other socio-hydrological systems than floodplains. It will be therefore be worthwhile to see whether SHSs can also be used to analyse physical processes other than floods, such as droughts, salt intrusion, irrigated catchments or urban systems.
The usefulness of SHSs does not only result from what it allows us to see, as explained above, but also from the relative ease of application in situations where data are too sparse to use fully deterministic models (which is the case nearly any-where in the world). Compared with existing approaches in socio-hydrology, the concept allows an intermediary (narra-tive and/or statistical) position to be taken between complex realities and generic models. As such, it is argued that SHSs and generic models are complementary approaches with their respective advantages and disadvantages, making them use-ful for different purposes in different contexts.
Because SHSs are place-bound and can only be found (lit-erally) on the ground, the use of SHSs forces the researcher to actually go to the field, talk to inhabitants and officials, and obtain a thorough understanding of the specifics of the location. This also means that the use of SHSs will make socio-hydrological analyses more policy-relevant. In terms of practical use, it can be added as an additional element to rapid rural appraisals, or other social assessments, to draw attention to how material conditions (hydrological and tech-nical/infrastructure) co-shape social situations. The applica-tion of SHSs is particularly useful to avoid broad-brush gen-eralisations that do not take account of locality-bound prob-lems due to the physical environment, without the need to interview every single household. SHSs are therefore useful for developing interventions under disaster management, but also other development goals. In summary, SHSs provide a new way of looking at and analysing socio-hydrological sys-tems.
Data availability. Household data used in this research
are stored in OSFHOME and are publicly available
(https://doi.org/10.17605/OSF.IO/C7RQY, Ferdous, 2018).
Population data used in this research are publicly available at Bangladesh Bureau of Statistics (BBS), Dhaka, Bangladesh. Dry season satellite images were collected from CEGIS, Dhaka, Bangladesh.
Supplement. The supplement related to this article is available online at: https://doi.org/10.5194/hess-22-5159-2018-supplement.
Author contributions. MRF has planned, coordinated and collected data from field for this research. All the co-authors (MRF, AW, LB, KS, MZ and GDB) contributed to analysing data and writing and revising the paper.
Competing interests. The authors declare that they have no conflict of interest.
Acknowledgements. This research was funded by NWO-WOTRO grant W 07.69.110 “Hydro-Social Deltas: Understanding flows of water and people to improve policies and strategies for disaster risk reduction and sustainable development of delta areas in the Netherlands and Bangladesh”. Giuliano Di Baldassarre was supported by the European Research Council (ERC) within the project “HydroSocialExtremes: Uncovering the Mutual Shaping of Hydrological Extremes and Society” (ERC Consolidator Grant, no. 761678).
Edited by: Murugesu Sivapalan Reviewed by: five anonymous referees
References
Allison, M. A.: Historical Changes in the Ganges-Brahmaputra Delta Front, J. Coast. Res., 14, 1269–1275, 1998.
Barendrecht, M. H., Viglione, A., and Blöschl, G.: A dy-namic framework for flood risk, Water Security, 1, 3–11, https://doi.org/10.1016/j.wasec.2017.02.001, 2017.
BBS: Bangladesh Population Census 1974, Village Population Statistics, Bangladesh Bureau of Statistics, Dhaka, 1974. BBS: Bangladesh Population Census 1981, Community Tables of
all Thanas, Bangladesh Bureau of Statistics, Dhaka, 1986. BBS: Bangladesh Population Census 1991, Socio-economic and
de-mographic report, Bangladesh Bureau of Statistics, Dhaka, 1994. BBS: Bangladesh Population and Housing Census 2001,
Commu-nity report, Bangladesh Bureau of Statistics, Dhaka, 2001. BBS: Bangladesh Population and Housing Census 2011,
Commu-nity report, Bangladesh Bureau of Statistics, Dhaka, 2013. Blair, P. and Buytaert, W.: Socio-hydrological modelling: a review
asking “why, what and how?”, Hydrol. Earth Syst. Sci., 20, 443– 478, https://doi.org/10.5194/hess-20-443-2016, 2016.
Brammer, H.: Can Bangladesh be Protected from floods?, The Uni-versity Press Ltd., Dhaka, 1–262, 2004.
Castree, N., Adams, W. M., Barry, J., Brockington, D., Büscher, B., Corbera, E., Demeritt, D., Duffy, R., Felt, U., Neves, K., Newell, P., Pellizzoni, L., Rigby, K., Robbins, P., Robin, L., Rose, D. B., Ross, A., Schlosberg, D., Sör-lin, S., West, P., Whitehead, M., and Wynne, B.: Chang-ing the intellectual climate, Nat. Clim. Change, 4, 763–768, https://doi.org/10.1038/nclimate2339, 2014.
CEGIS: Long-term Erosion Process of the Jamuna River, Jamuna-Meghna River Erosion Mitigation Project, Bangladesh Water De-velopment Board, Dhaka, 1–73, 2007.
Chen, X., Wang, D., Tian, F., and Sivapalan, M.: From
channelization to restoration: Sociohydrologic modeling
with changing community preferences in the Kissimmee River Basin, Florida, Water Resour. Res., 52, 1227–1244, https://doi.org/10.1002/2015WR018194, 2016.
Ciullo, A., Viglione, A., Castellarin, A., Crisci, M., and Di
Baldassarre, G.: Socio-hydrological modelling of
flood-risk dynamics: comparing the resilience of green and
technological systems, Hydrol. Sci. J., 62, 880–891,
https://doi.org/10.1080/02626667.2016.1273527, 2017. CPP: Census of Pakistan Population 1961: Volume 2, East Pakistan,
Tables & Report, Ministry of Home & Kashmir Affairs, Karachi, 1961.
Di Baldassarre, G., Montanari, A., Lins, H., Koutsoyiannis, D., Brandimarte, L., and Bölschl, G.: Flood fatalities in Africa: From diagnosis to mitigation, Geophys. Res. Lett., 37, 2–6. https://doi.org/10.1029/2010GL045467, 2010.
Di Baldassarre, G., Kooy, M., Kemerink, J. S., and Brandimarte, L.: Towards understanding the dynamic behaviour of floodplains as human-water systems, Hydrol. Earth Syst. Sci., 17, 3235–3244, https://doi.org/10.5194/hess-17-3235-2013, 2013a.
Di Baldassarre, G., Viglione, A., Carr, G., Kuil, L., Salinas, J. L., and Blöschl, G.: Socio-hydrology: conceptualising human-flood interactions, Hydrol. Earth Syst. Sci., 17, 3295–3303, https://doi.org/10.5194/hess-17-3295-2013, 2013b.
Di Baldassarre, G., Kemerink, J. S., Kooy, M., and Brandimarte, L.: Floods and societies: the spatial distribution of water-related dis-aster risk and its dynamics, Wiley Interdisciplinary Reviews: Wa-ter, 1(April), 133–139, https://doi.org/10.1002/wat2.1015, 2014. Di Baldassarre, G., Viglione, A., Carr, G., Kuil, L., Yan, K., Brandimarte, L., and Blöschl, G.: Debates – Perspectives on socio-hydrology: Capturing feedbacks between physical and social processes, Water Resour. Res., 51, 4770–4781, https://doi.org/10.1002/2014WR016416, 2015.
Di Baldassarre, G., Saccà, S., Aronica, G. T., Grimaldi, S., Ciullo, A., and Crisci, M.: Human-flood interactions in Rome over the past 150 years, Adv. Geosci., 44, 9–13, https://doi.org/10.5194/adgeo-44-9-2017, 2017.
Elshafei, Y., Sivapalan, M., Tonts, M., and Hipsey, M. R.: A pro-totype framework for models of socio-hydrology: identification of key feedback loops and parameterisation approach, Hydrol. Earth Syst. Sci., 18, 2141–2166, https://doi.org/10.5194/hess-18-2141-2014, 2014.
Ferdous, M. R.: Data set to: Socio-hydrological Spaces
in the Jamuna River floodplain in Bangladesh,
https://doi.org/10.17605/OSF.IO/C7RQY, 2018.
FFWC/BWDB: Annual Flood Report 2016, Flood Forecasting and Warning Centre, Bangladesh Water Development Board, Dhaka, 88 pp., 2017.
Gober, P. and Wheater, H. S.: Socio-hydrology and the science-policy interface: a case study of the Saskatchewan River basin, Hydrol. Earth Syst. Sci., 18, 1413–1422, https://doi.org/10.5194/hess-18-1413-2014, 2014.
Goodbred, S. L., Kuehl, S. A., Steckler, M. S., and Sarker, M. H.: Controls on facies distribution and stratigraphic preservation in the Ganges – Brahmaputra delta sequence, Sediment. Geol., 155, 301–316, 2003.
Grames, J., Prskawetz, A., Grass, D., Viglione, A., and Blöschl, G.: Modeling the interaction between flooding events and economic growth, Ecol. Econ., 129, 193–209, 2016.
Hazarika, N., Das, A. K., and Borah, S. B.: Assessing land-use changes driven by river dynamics in chronically flood affected Upper Brahmaputra plains, India, using RS-GIS techniques, The Egyptian Journal of Remote Sensing and Space Science, 18, 107–118, https://doi.org/10.1016/j.ejrs.2015.02.001, 2015. Hofer, T. and Messerli, B.: Floods in Bangladesh: History, dynamics
and rethinking the role of the Himalayas, United Nations Univer-sity Press, United Nations UniverUniver-sity, Tokyo, 1–468, 2006. Hornberger, G. M., Hess, D. J., and Gilligan, J.: Water
conservation and hydrological transitions in cities in
the United States, Water Resour. Res., 51, 4635–4649, https://doi.org/10.1002/2015WR016943, 2015.
Huq, H.: Flood action plan and NGO protests in Bangladesh: An assessment, in: Water governance and civil society responses in South Asia, edited by: Narayanan, N. C., Parasuraman, S., and Ariyabandu, R., New Delhi, India: Routlege, 2014.
Kandasamy, J., Sounthararajah, D., Sivabalan, P., Chanan, A., Vi-gneswaran, S., and Sivapalan, M.: Socio-hydrologic drivers of the pendulum swing between agricultural development and en-vironmental health: a case study from Murrumbidgee River basin, Australia, Hydrol. Earth Syst. Sci., 18, 1027–1041, https://doi.org/10.5194/hess-18-1027-2014, 2014.
Kates, R. W., Colten, C. E., Laska, S., and Leatherman, S. P.: Reconstruction of New Orleans after Hurricane Katrina?: A research perspective, P. Natl. Acad. Sci., 103, 14653–14660, https://doi.org/10.1073/pnas.0605726103, 2006.
Kreibich, H., Di Baldassarre, G., Vorogushyn, S., Aerts, J. C. J. H., Apel, H., Aronica, G. T., Arnbjerg-Nielsen, K., Bouwer, L. M., Bubeck, P., Caloiero, T., Chinh, D. T., Cortès, M., Gain, A. K., Giampá, V., Kuhlicke, C., Kundzewicz, Z. W., and Llasat, M. C. B.: Adaptation to flood risk – results of interna-tional paired flood event studies, Earth’s Future, 5, 953–965, https://doi.org/10.1002/2017EF000606, 2017.
Liu, Y., Tian, F., Hu, H., and Sivapalan, M.: Socio-hydrologic per-spectives of the co-evolution of humans and water in the Tarim River basin, Western China: the Taiji-Tire model, Hydrol. Earth Syst. Sci., 18, 1289–1303, https://doi.org/10.5194/hess-18-1289-2014, 2014.
Magliocca, N. R., Ellis, E. C., Allington, G. R. H., de Bre-mond, A., Dell’Angelo, J., Mertz, O., Messerli, P., Meyfroidt, P., Seppelt, R., and Verburg, P. H.: Closing global knowledge gaps: Producing generalized knowledge from case studies of social-ecological systems, Glob. Environ. Change, 50, 1–14, https://doi.org/10.1016/j.gloenvcha.2018.03.003, 2018. Mehta, V. K., Goswami, R., Kemp-Benedict, E., Muddu, S., and
Malghan, D.: Metabolic urbanism and environmental justice: the water conundrum in Bangalore, India, Environmental Justice, 7, 130–137, https://doi.org/10.1089/env.2014.0021, 2014. Milly, P. C., Betancourt, J., Falkenmark, M., Hirsch, R. M.,
Kundzewicz, Z. W., Lettenmaier, D. P., and Stouffer, R. J.: Sta-tionarity is dead: Whither water management?, Science, 319, 573–574, https://doi.org/10.1126/science.1151915, 2008. Mirza, M. M. Q, Warrick, R. A., and Ericksen, N. J.: The
Montanari, A., Young, G., Savenije, H. H. G., Hughes, D., Wa-gener, T., Ren, L. L., Koutsoyiannis, D., Cudennec, C., Toth, E., Grimaldi, S., Blöschl, G., Sivapalan, M., Beven, K., Gupta, H., Hipsey, M., Schaefli, B., Arheimer, B., Boegh, E., Schy-manski, S. J., Di Baldassarre, G., Yu, B., Hubert, P., Huang, Y., Schumann, A., Post, D. A., Srinivasan, V., Harman, C., Thompson, S., Rogger, M., Viglione, A., McMillan, H., Charack-lis, G., Pang, Z., and Belyaev, V.: Panta Rhei – Everything Flows: Change in hydrology and society – The IAHS Sci-entific Decade 2013–2022, Hydrol. Sci. J., 58, 1256–1275, https://doi.org/10.1080/02626667.2013.809088, 2013.
Mostert, E.: An alternative approach for socio-hydrology: case study research, Hydrol. Earth Syst. Sci., 22, 317–329, https://doi.org/10.5194/hess-22-317-2018, 2018.
O’Connell, P. E. and O’Donnell, G.: Towards modelling flood pro-tection investment as a coupled human and natural system, Hy-drol. Earth Syst. Sci., 18, 155–171, https://doi.org/10.5194/hess-18-155-2014, 2014.
Pande, S. and Sivapalan, M.: Progress in socio-hydrology: a meta-analysis of challenges and opportunities, Wires Water, 4, 1–18, https://doi.org/10.1002/wat2.1193, 2017.
Peel, M. C. and Blöschl, G.: Hydrological modelling in
a changing world, Prog. Phys. Geogr., 35, 249–261,
https://doi.org/10.1177/0309133311402550, 2011.
RBIP: River Bank Improvement Program: Annex A, Vol 1, Mor-phology, Feasibility Report and Detailed Design Priority Reach, Bangladesh Water Development Board, Dhaka, 2015.
Reuber, J., Schielen, R., and Barneveld, H. J.: Preparing a river for the future-The River Meuse in the year 2050, Floods, from De-fence to Management, edited by: Van Alphen, J., van Beek, E., and Taal, M., Taylor & Francis Group, London, 687–692, 2005. Sarker, M. H., Huque, I., Alam, M., and Koudstaal, R.: Rivers, chars
and char dwellers of Bangladesh, Int. J. River Basin Manage., 1, 61–80, https://doi.org/10.1080/15715124.2003.9635193, 2003. Sivapalan, M.: Debates – Perspectives on socio-hydrology:
Changing water systems and the “tyranny of small prob-lems” – Sociohydrology, Water Resour. Res., 51, 4795–4805, https://doi.org/10.1002/2015WR017080, 2015.
Sivapalan, M. and Blöschl, G.: Time scale interactions and the co-evolution of humans and water, Water Resour. Res., 51, 6988– 7022, https://doi.org/10.1002/2015WR017896, 2015.
Sivapalan, M., Savenije, H. H. G., and Blöschl, G.: Socio-hydrology: A new science of people and water, Hydrol. Process., 26, 1270–1276, https://doi.org/10.1002/hyp.8426, 2012. Srinivasan, V.: Reimagining the past – use of
counterfac-tual trajectories in socio-hydrological modelling: the case of Chennai, India, Hydrol. Earth Syst. Sci., 19, 785–801, https://doi.org/10.5194/hess-19-785-2015, 2015.
Sultana, P., Johnson, C., and Thompson, P.: The impact of major floods on flood risk policy evolution: Insights from Bangladesh, Int. J. River Basin Manage., 6, 339–348, https://doi.org/10.1080/15715124.2008.9635361, 2008. Tingsanchali, T. and Karim, M. F.: Flood hazard and risk analysis in
the southwest region of Bangladesh, Hydrol. Process., 19, 2055– 2069, https://doi.org/10.1002/hyp.5666, 2005.
Treuer, G., Koebele, E., Deslatte, A., Ernst, K., Garcia, M., and Manago, K.: A narrative method for analyzing transitions in urban water management: The case of the Miami-Dade Wa-ter and Sewer Department, WaWa-ter Resour. Res., 53, 891–908, https://doi.org/10.1002/2016WR019658, 2017.
Troy, T. J., Pavao-Zuckerman, M., and Evans, T. P.: Debates – Perspectives on socio-hydrology: Socio-hydrologic modeling: Tradeoffs, hypothesis testing, and validation, Water Resour. Res., 51, 4806–4814, https://doi.org/10.1002/2015WR017046, 2015. van Staveren, M. F. and van Tatenhove, J. P. M.: Hydraulic
engi-neering in the social-ecological delta: understanding the inter-play between social, ecological, and technological systems in the Dutch delta by means of “delta trajectories”, Ecol. Soc., 21, 8, https://doi.org/10.5751/ES-08168-210108, 2016.
van Staveren, M. F., van Tatenhove, J. P. M., and Warner, J. F.: The tenth dragon?: controlled seasonal flooding in long-term policy plans for the Vietnamese Mekong delta, Journal of Environmental Policy & Planning, 20, 267–281, https://doi.org/10.1080/1523908X.2017.1348287, 2017a. van Staveren, M. F., Warner, J. F., and Khan, M. S. A.: Bringing
in the tides. From closing down to opening up delta polders via Tidal River Management in the southwest delta of Bangladesh, Water Policy, 19, 147–164, https://doi.org/10.2166/wp.2016.029, 2017b.
Viglione, A., Di Baldassarre, G., Brandimarte, L., Kuil, L., Carr, G., Salinas, J. L., Scolobig, A., and Blöschl, G.: Insights from socio-hydrology modelling on dealing with flood risk – Roles of collective memory, risk-taking attitude and trust, J. Hydrol., 518, 71–82, https://doi.org/10.1016/j.jhydrol.2014.01.018, 2014. Vis, M., Klijn, F., De Bruijn, K. M., and Van Buuren,
M.: Resilience strategies for flood risk management in the Netherlands, Int. J. River Basin Manage., 1, 33–40, https://doi.org/10.1080/15715124.2003.9635190, 2003. Walsham, M.: Assessing the evidence: environment, climate change
and migration in Bangladesh. International Organization for Mi-gration (IOM), Regional Office for South Asia, Dhaka, 2010. Wesselink, A., Warner, J., and Kok, M.: You gain some funding, you
lose some freedom: the ironies of flood protection in Limburg (The Netherlands), Environmental Science and Policy, 30, 113– 125, https://doi.org/10.1016/j.envsci.2012.10.018, 2013. Wesselink, A., Kooy, M., and Warner, J.: Socio-hydrology and
hy-drosocial analysis?: toward dialogues across disciplines, WIREs Water, 4, 1–14, https://doi.org/10.1002/wat2.1196, 2017. Wesselink, A. J., Bijker, W. E., de Vriend, H. J., and Krol, M. S.:
Dutch dealings with the Delta, Nature and Culture, 2, 188–209, https://doi.org/10.3167/nc2007.020203, 2007.
White, G. F.: Human Adjustment to Floods: Department of Ge-ography Research, Paper No. 29, The University of Chicago, Chicago, 1945.