ScholarWorks @ Georgia State University
ScholarWorks @ Georgia State University
Chemistry Dissertations Department of Chemistry
Spring 5-1-2012
Rational Design and Application of Genetically Encoded
Rational Design and Application of Genetically Encoded
Fluorescent Reporters in Cellular Physiology
Fluorescent Reporters in Cellular Physiology
Shen Tang
Georgia State University
Follow this and additional works at: https://scholarworks.gsu.edu/chemistry_diss
Recommended Citation Recommended Citation
Tang, Shen, "Rational Design and Application of Genetically Encoded Fluorescent Reporters in Cellular Physiology." Dissertation, Georgia State University, 2012.
https://scholarworks.gsu.edu/chemistry_diss/65
This Dissertation is brought to you for free and open access by the Department of Chemistry at ScholarWorks @ Georgia State University. It has been accepted for inclusion in Chemistry Dissertations by an authorized
administrator of ScholarWorks @ Georgia State University. For more information, please contact
CENT REPORTERS IN CELLULAR PHYSIOLOGY
by
SHEN TANG
Under the Direction of Jenny Yang
ABSTRACT
Fluorescent protein based genetically encoded fluorescent reporters play an im-protant role in understanding the cellular physiology by directly monitoring real-time cel-lular signaling pathways with fluorescent microscope.
Quantitative analysis of Ca2+ fluctuations in the endoplasmic/sarcoplasmic reticu-lum (ER/SR) is essential to defining the mechanisms of Ca2+-dependent signaling under
-chemical exchange between two chromophore states. CatchER reported considerable differences in ER Ca2+ dynamics and concentration among epithelial HeLa, kidney HEK
293, and muscle C2C12 cells, enabling us to monitor SR luminal Ca2+ in flexor digito-rum brevis (FDB) muscle fibers to determine the mechanism of diminished SR Ca2+ re-lease in aging mice. Moreover, the structure of CatchER has been investigated by nu-clear magnetic resonance spectroscope (NMR) and high-resolution X-ray crystal struc-tures to understand the novel mechanism of Ca2+ induced fluorescent enhancement of
GFP.
It is crucial to investigate the metal selectivity of Ca2+/Mg2+ of these metallopro-teins to understand cellular physiology. The major Mg2+ binding sites of proteins have
been reviewed and classified based on structural differences, and identified several key factors to determine Mg2+/Ca2+ selectivity with binding constants difference up to 104 in
several types of metalloproteins.
Thrombin is involved in numerous cellular signaling pathways and plays a crucial role in blood coagulation. I designed a novel class of single EGFP-based thrombin sen-sors by inserting a thirty-amino acid short peptide with a thrombin cleavage site into the fluorescent sensitive location of EGFP. These designed protease sensors exhibited op-timized kcat/Km up to 104 magnitudes higher than that of small peptide based absorption
indicator EGR-pNA. The measured Km value is in below 10 µM, in the same magnitude
as that of natural thrombin substrate Fibrinogen A.
RATIONAL DESIGN AND APPLICATION OF GENETICALLY ENCODED Fluorescent REPORTERS IN CELLULAR PHYSIOLOGY
by
SHEN TANG
A Dissertation Submitted in Partial Fulfillment of the Requirements for the Degree of Doctor of Philosophy
in the College of Arts and Sciences Georgia State University
Copyright by Shen Tang
RATIONAL DESIGN AND APPLICATION OF GENETICALLY ENCODED Fluorescent REPORTERS IN CELLULAR PHYSIOLOGY
by
SHEN TANG
Committee Chair: Jenny Yang
Committee: Osvaldo Delbono Govanni Gadda Donald Hamelberg Mary Wagner
Electronic Version Approved:
ACKNOWLEDGEMENTS
I am grateful to my advisor, Dr. Jenny J. Yang helping me and guiding me to com-plete a Ph.D. degree, and motivating me to achieve success in interdisciplinary projects by acquiring multiple techniques. I would like to thank Dr. Osvaldo Delbono for his cru-cial scientific guidances and help in the application of CatchER in skeletal muscles to push my research to a high level. I want to thank Dr. Giovanni Gadda for scientific guid-ance of kinetic study of both enzymology and Ca2+ binding proteins. I want to thank Dr.
TABLE OF CONTENTS
ACKNOWLEDGEMENTS………..iv
CHAPTER 1: GENERAL INTRODUCTION: FLUORESCENT PROTEINS AND THEIR APPLICATION IN MODERN CELLULAR BIOLOGY………...…1
1.1 The discovery of fluorescent proteins (FPs) and their structural proper-ties……….…...1
1.2 Application of fluorescent proteins in cell biology……….…....4
1.3 Biological roles of Ca2+ and its relevance to heart diseases and ag-ing……….……5
1.4 Role of ER/SR in Ca2+ signaling………..………...10
1.5 Tuning Ca2+ binding affinities by rational design………..13
1.6 Factors contribute to kinetic properties of Ca2+ binding……….20
1.7 Criteria of a Ca2+ sensor in cells………...….23
1.8 Current Ca2+ indicators.……….……….…..26
1.9 Our strategy to design a genetically encoded fluorescent indicator of Ca2+………...……….30
1.10 Limitations and challenges in designing Ca2+ sensors…….………….….34
1.11 Biological functions of thrombin and Structural basis of thrombin sub-strate specificity………..………...35
1.12 Our objectives and purpose of designing single EGFP-based thrombin sensors………..………...36
1.13 Objective and overview of this dissertation………...37
CHAPTER 2: DESIGNING GENETICALLY ENCODED FLUORESCENT INDICATOR TO STUDY ENDOPLASMIC RETICULUM CA2+ DYNAMICS…………..……….41 2.1 Abstract………...41 2.2 Introduction of designing approaches and challenges of kinetic study.………...41 2.3 Methods………..54 2.4 Results………66
2.4.1 Designing Ca2+ binding sites on the surface of beta-sheet protein
as-sisted with the computational algorithms.………..………..66
2.4.2 Designing different DNA sequences of EGFP-based calcium sensors with Dezymer………..72
2.4.3 Study the optical properties of designed variants by fluorescence and absorption spectroscope. ………..………...77
2.4.4 Ca2+-induced changes in CatchER’s optical properties……….79
2.4.5 Metal binding affinity and selectivity of designed indicators with optical spectroscopes………...82
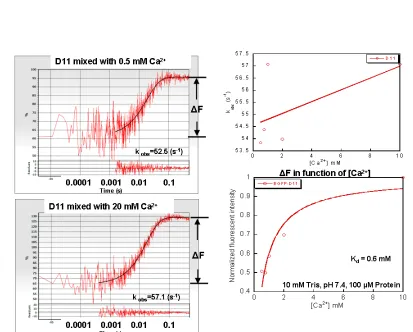
2.4.6 Kinetics study of CatchER in response to Ca2+ with stopped-flow tech-nique……….83
2.4.7 Determination of calcium and CatchER interaction stoichiometry…….91
2.4.8 The pKa measurement of CatchER in the presence and absence of
2.4.9 Ca2+ binding CatchER investigated by equilibrium dialysis and an
In-ductively Coupled Plasma Optical Emission Spectrometer
(ICP-OES)………99
2.4.10 Co-localization of CatchER and DsRed2-ER with confocal
micro-scope………113
2.4.11 In situ measurement of calcium binding affinity of CatchER expressed
in endoplasmic reticulum of BHK and C2C12 cells……….115
2.4.12 Resting ER Ca2+ concentration in HeLa, HEK-293 and C2C12 cells
cali-brated by CatchER………119
2.4.13 Ionomycin induced ER Ca2+ depletion and reloading……...…………..121
2.4.14 InsP3 induced ER Ca2+ release in permeabilized BHK cells measured
by CatchER……….122
2.4.15 InsP3 induced ER Ca2+ release in intact and permeabilized C2C12 cells
measured by CatchER……….124
2.4.16 ER Ca2+ release triggered by thapsigargin inhibition of SERCA pump.
………...127
2.4.17 4-CmC induced ER Ca2+ release in C2C12 cells measured by CatchER……….……..130
2.4.18 ATP and Histamine induced transient ER Ca2+ release measured by Fura-2 and CatchER………...135
2.4.19 CPA reversible inhibition and thapsigargin inreversible inhibition of
SERCA pump………..136
2.4.21 Targeting CatchER to microdomain of receptors………142
2.4.22 Constructing the lentivirus transfection system of CatchER and pre-liminary results of Ca2+ imaging………...147
2.4.23 Constructing the ratiometric CatchER………151
2.5 Discussion………..152
2.5.1 Kindle fluorescence change mechanism by designing of metal binding instead of protein-protein interaction………..152
2.5.2 Implications in developing calcium sensors with desired metal binding properties for the high Calcium environment………...155
2.5.3 Implications for kinetic properties of calcium sensors………..155
2.5.4 Implications in SR/ER calcium and calcium release………...156
2.5.5 Theoritical calculation of the diffusion-control limit kon value, and esti-mation of the koff value of the sensor with submilimolar Kd………….156
2.5.6 The reported rate constant in cell and how the crowding condition in cell influences the kinetic properties? ………..158
2.5.7 Calculating the Gibbs free energy change of Ca2+ binding CatchER, and comparing the binding energy changes with other Ca2+ binding proteins………...160
2.5.8 Comparing the kinetic parameters between CatchER and other Ca2+ indicators………162
2.5.9 Further increasing the binding affinity of CatchER……….164
2.5.10 The metal selectivity between Ca2+ and Mg2+ of CatchER……….166
2.7 Acknowledgement….……….………..170
CHAPTER 3: RESIDUAL SARCOPLASMIC RETICULUM CA2+ CONCENTRATION AFTER CA2+ RELEASE IN SKELETAL MYOFIBERS FROM YOUNG-ADULT AND OLD MICE………....……….173
3.1 Abstract……….173
3.2 Introduction………...174
3.3 Materials and methods……….….176
3.4 Results……….….178
3.4.1 RyR1 mediates SR Ca2+ release recorded with CatchER………178
3.4.2 High cytosolic EGTA concentration does not affect SR Ca2+ recov-ery………...180
3.4.3 Brief and prolonged SR Ca2+ release tracked with CatchER…………..182
3.4.4 Voltage-dependent CatchER luminal signal and cytoplasmic Ca2+ tran-sients………..184
3.4.5 CatchER’s fluorescence amplitude increases with the duration of sar-colemmal depolarization………..187
3.4.6 Ca2+ remaining in the SR after prolonged depolarization differs in myo-fibers from young and old mice………..189
3.4.7 In situ determination of kinetic parameters of CatchER………..192
3.4.8 Expected Ca2+ association rate constant to CatchER in situ based on the activity of SERCA pumps………..194
3.5.1 CatchER is a low-affinity Ca2+ biosensor suitable for measuring luminal
SR Ca2+………..197
3.5.2 The concentration of residual SR Ca2+ after Ca2+ release in skeletal myo-fibers from senescent mice is unknown………...….…………..……198
3.5.3 Residual SR Ca2+ after prolonged myofiber depolarization………200
3.6 Acknowledgements………201
3.7 References………202
CHAPTER 4: STRUCTURAL ANALYSIS AND DETERMINATION OF DESIGNED IN-DICATOR CATCHER BY NUCLEAR MAGNETIC RESONANCE SPECTROSCOPY (NMR)……….205
4.1 Abstract……….205
4.2 Introductions………...206
4.3 Methods……….213
4.4 Results………..216
4.4.1 1D NMR Ca2+ titration of CatchER……….216
4.4.2 Diffusion NMR by pulse-field-gradient (PFG)……….220
4.4.3 Temperature-dependent peak disperse………...222
4.4.4 Protein concentration dependent peak disperse………..227
4.4.5 HSQC Ca2+ titration of CatchER……….229
4.4.7 Bacterial expression of 2H-13C-15N isotopic triple labeled and 13C-15N
double labeled CatchER and purification of double labeled sample by
his-tag...246
4.4.8 3D NMR HNCA and CBCACONH for maichain assignment of CatchER………....247
4.4.9 T1, T2 and NOE of CatchER………..251
4.4.10 Tau C calculation………...253
4.5 Discussion………254
4.6 References………261
CHAPTER 5: PINPOINTING A CLAW-SHAPED METAL BINDING SITE IN CATCHER BY X-RAY CRYSTAL STRUCTURES……….262
5.1 Introduction……….………..262
5.2 Experimental Section……….264
5.3 Results & Discussion………...…..267
5.3.1 Crystallographic analysis of CatchER structures………..267
5.3.2 Identification of metal ions in CatchER………268
5.3.3 Structural changes around the chromophore………271
5.3.4 Relationship between mutations and chromophore fluorescence excita-tion……….273
5.4 Acknowledgements………...274
CHAPTER 6: MAGNESIUM-BINDING SITES IN PROTEINS……….…282
6.1 Biological functions of Mg2+ ………..282
6.2 Metal coordination chemistry………282
6.3 Metal selectivity and affinities of metalloproteins……….………..284
6.4 Major types of Mg2+ binding protein sites….………....….285
6.4.1 The conserved continuous non-EF-hand peptide containing multiple acidic residues…..……….285
6.4.2 EF-hand binding motif and Ca2+ /Mg2+ selectivity………..….….286
6.4.3 The discontinuous binding site formed by sequentially distant resi-dues………..…………290
6.4.4 Protein motif binding multiple Mg2+ ions…..………..…………290
6.4.5 Mg2+ binding site assembled by different subunits…..………..……….291
6.4.6 Hybrid phosphate and protein ligand binding site……….……….293
6.5 Computational algorithm to predict and design Mg2+/Ca2+ binding sites..………293
6.6 Acknowledgements….……….294
6.7 References………...………...294
6.8 Figures and legends………...………..295
CHAPTER 7: DESIGNING A NOVEL CLASS OF THROMBIN SENSORS WITH FAST RATIOMETRIC RESPONSE……….298
7.1 Abstract………...298
7.3 Structural analysis of complementary interaction between the active
site of thrombin and cleavage site of substrates.………..………..302
7.4 Our strategy to design single GFP-based ratiometric protease sen-sors.………..302
7.5 Key factors to determine the substrate specificity.……….304
7.6 Methods………306
7.7 Results……….308
7.7.1 Expression and purification of our designed thrombin sensors…….308
7.7.2 Comparison of dynamic range………..308
7.7.3 Thrombin cleavage monitored by SDS PAGE.………..309
7.7.4 The steady state kinetic study of thrombin sensor with Michaelis Men-ton equations.………313
7.8 Discussion………..317
7.9 Conclusions..……….321
7.10 References.……….322
CHAPTER 8: CONCLUSIONS AND MAJOR FINDINGS………..………..333
8.1 Conclusions……….……….….…….333
8.2 Major findings in rational design of Ca2+ binding sites on the surface of beta sheet protein….………334
8.3 Major Findings in ER/SR Ca2+ signalings of non-excitable and excitable cells measured by CatchER………...335
8.5 Major findings in structural determination of CatchER by X-ray crystal-lography………...337 8.6 Major findings in analyzing Ca2+ and Mg2+ binding sites of protein…337 8.7 Significance and impact of design Ca2+ sensor studies………338 8.8 Major findings in designing a novel class of thrombin biosensors with
fast ratiometric responses………..340
LIST OF TABLES
Table 1.1 Major parameters of Ca2+ indicators………….………...22 Table 1.2 Summary of the protein variants………39 Table 2.1 Summary-1 of rate constants of CatchER measured from
stopped-flow technique……….……….……….………….83 Table 2.2 Summary-2 of rate constants of CatchER measured from
stopped-flow technique……….……….………..83 Table 2.3 Summary-3 of rate constants of CatchER measured from
stopped-flow technique……….……….………..84 Table 2.4 Numerical results of Ca2+ concentration in buffer, myoglobin, EGFP, CatchER and alpha-lactalbumin measured in ICP-OES…………...102 Table 2.5 Numerical results of Ca2+ concentration measured by ICP-OES at
different wavelengths………106 Table 2.6 Measured calcium concentration by ICP-OES with calcium standard
curve 0-20 ppm………106 Table 2.7 Recipe of Ca2+ standard for ICP-OES experiments………..107 Table 2.8 Fitting equations of Ca2+ standard calibrations………108 Table 4.1 Ca2+ triggered mainchain amine 1H and 15N chemical shift changes
of CatchER by 600 MHz NMR (GSU)…….……….………187 Table 4.2 Summary of Ca2+ triggered mainchain amine 1H and 15N chemical
Table 4.4 Assignment of mainchain 13CO, 13Cα, 13Cβ, 1H-15N, and 1H by 800 MHz NMR (CCRC)……….……….………...…..…212 Table 4.5 T1 values of CatchER measured by 600 MHz NMR (GSU)…….…...221 Table 4.6 T2 values of CatchER measured by 600 MHz NMR (GSU)……...….228 Table 4.7 The peak integration of CatchER at NOE on/off measured by 600 MHz NMR (GSU)……….……….……….234 Table 4.8 τc value of CatchER calculated from the beta-sheet backbone
col-lected both in 600 MHz (GSU) and 800 MHz (CCRC) NMR spectro-scope…..……….……….……….….240 Table 5.1 Major parameters of CatchER crystal structures.………..287 Table 6.1 Classification of representative Mg2+ binding proteins based on the number of sidechain carboxylate….……….……….309 Table 7.1 The extinction coefficient constants of absorbance at 490 nm of
de-signed thrombin sensors……….……….318 Table 7.2 The dynamic range in term of absorption ratio 490 nm/ 398 nm of
de-signed thrombin sensors after and before cleaved by thrombin. ……….……….……….……….…….……319 Table 7.3 The detected initial velocity (V0) and ratio of initial velocity to enzyme
LIST OF FIGURES
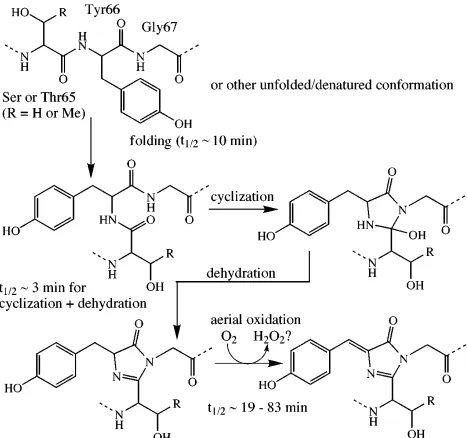
Figure 1.1 The secondary structure of green fluorescent protein (GFP)……...2 Figure 1.2 Mechanism for the intramolecular biosynthesis of the GFP chromo-phore……….……3 Figure 1.3 A whole platelet of fluorescent proteins covering UV to infrared
emission spectra derived from green fluorescent protein and
DsRed………5 Figure 1.4 The Ca2+ pathways in the cell………..8 Figure 1.5 The Ca2+ gradients among different subcellular organelles……….10 Figure 1.6 The SR calcium release triggered by excitation-contraction
cou-pling (E-C coucou-pling) of skeletal muscle……….13 Figure 1.7 Strategies of the major Ca2+ indicators……….……….25 Figure 1.8 Scheme of design strategies of genetically encoded Ca2+
indica-tors in our lab………...…33 Figure 2.1 Kinetic study of Fura-2 in response to Ca2+ by stopped flow…….50 Figure 2.2 The proposed scheme of chemical reaction kinetics of the calcium
saturated Fura-2 mixing with calcium chelators……….51 Figure 2.3 Analysis of rate constants of calcium bound Fura-2 interacting with
different concentration of EGTA measured from the stopped-flow techniques……….53 Figure 2.4 Selected binding sites on the surface of EGFP by Dezymer…… ...68 Figure 2.5 Representative Ca2+ binding sites designed by Dezymer on the
Figure 2.6 Scheme of GFP excited state proton transfer (ESPT)………....70 Figure 2.7 Map of EGFP neighboring residues connected by mainchain
hydro-gen bonds……….…….…71 Figure 2.8 Scheme of Strategy 1. Add additional calcium binding site to
en-hance calcium response of G1-EGFP………73 Figure 2.9 Scheme of Strategy 2. Designing new calcium binding site on EGFP………74 Figure 2.10 Proposed schematic structure and in vitro optical properties of
de-signed Ca2+ biosensor variants………...76 Figure 2.11 The optical properties of designed variants investigated by
absorp-tion and fluorescence spectroscopes………...77 Figure 2.12 The optical properties of designed variants investigated by
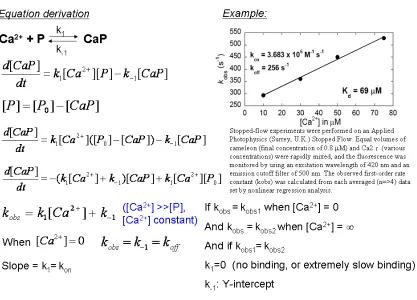
fluores-cence spectroscopes…………..……….………..78 Figure 2.13 Optical characterization of CatchER in vitro………79 Figure 2.14 Fluorescence responses of various physiological molecules……81 Figure 2.15 Analysis of rate constants of CatchER interacting Ca2+…………...84 Figure 2.16 Model I proposed that protein and calcium interaction directly
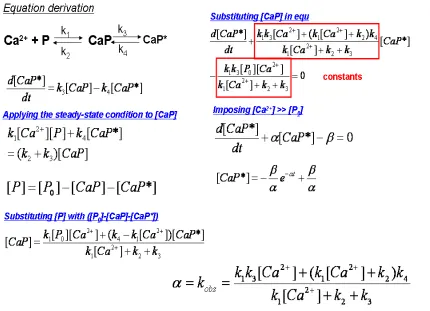
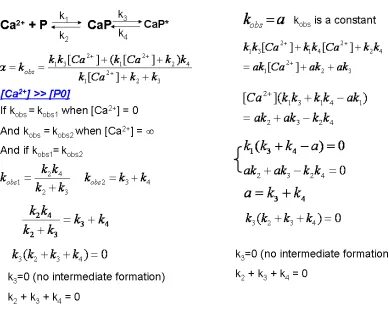
in-duced fluorescent intensity change and equation derivation…….85 Figure 2.17 Model II proposed that an intermediate formation during calcium
Figure 2.19 Kinetics study of CatchER has been conducted at two protein con-centrations.………..….89 Figure 2.20 Kinetics study of Ca2+ loaded CatchER with EGTA………...91 Figure 2.21 The stoichometry of CatchER determined by Job’s Plot…………..94 Figure 2.22 The pH stability of CatchER before and after binding Ca2+………..96 Figure 2.23 Ca2+ binding CatchER investigated by equilibrium dialysis and an Inductively Coupled Plasma Optical Emission Spectrometer (ICP-OES).………99 Figure 2.24 Representative spectra of ICP-OES………..101 Figure 2.25 Scheme of equilibrium dialysis……….103 Figure 2.26 Spectra of ICP-OES measued calcium concentrations in different
dialysis samples………105 Figure 2.27 Correlation of ICP-OES readout intensities of spectra peaks at indi-vidual wavelength with standard Ca2+ concentration…...……….109 Figure 2.28 Spectra of ICP-OES measured calcium concentration in different
dialysis samples………110 Figure 2.29 The fluorescent emission spectra of competing Ca2+ binding be-tween CatchER and alpha-lactalbumin or EGTA………..111 Figure 2.30 The fluorescent intensity change of CatchER in the competition of
Figure 2.32 In situ determination of Kd and endoplasmic reticulum Ca2+ dynam-ics of HeLa and HEK293 cells………115 Figure 2.25 ER calcium depletion of BHK living cells monitored by
mag-fura2.………...94 Figure 2.26 C2C12 myoblast endoplasmic reticulum Ca2+ dynamics monitored with CatchER………97 Figure 2.27 Cytosolic Ca2+ signaling monitored by Fura-2 in HeLa cells…….100 Figure 2.28 ER Ca2+ signaling of Hela cells detected by CatchER……….101 Figure 2.29 ER Ca2+ signaling of HEK293 cells detected by CatchER………..101 Figure 2.30 Representative fluorescent imaging of C2C12 co-expressing
CatchER and mCherry………..102 Figure 2.31 4-CmC evoked Ca2+ release in the absence and presence of
thap-sigargin……….………...106 Figure 2.32 Representative ER Ca2+ signaling detected by CatchER in HeLa cells triggered by ATP and histamine.……….107 Figure 2.33 Reversible Ca2+ release triggered by 15 µM CPA in HEK293 cells.………..108 Figure 2.24 Quantification of irreversible ER Ca2+ release in HEK293 cells in-duced by 2 µM thapsigargin.………..109 Figure 2.25 Comparison of ER Ca2+ depletion by ATP, 4-CmC and Ionomycin of
amplitude but does not affect SR Ca2+ recovery.……….143 Figure 3.3 CatchER tracks SR Ca2+ release in response to single or repetitive
prolonged stimulation.……….144 Figure 3.4 SR and cytosolic Ca2+ transients recorded in the same FDB
fi-bers.………..145 Figure 3.5 CatchER’s peak Ca2+ transient depends on pulse duration.,,…..,146 Figure 3.6 Maximal SR Ca2+ depletion evoked by 4-CmC………...147 Figure 4.1 Stacked 1D NMR spectra of Ca2+ titration of CatchER, from 6.3 to 8.7 ppm of proton dimension.………153 Figure 4.2 Stacked 1D NMR spectra of Ca2+ titration of CatchER, from -2.0 to 12.0 ppm of proton dimension.……….155 Figure 4.3 Stack plot of 1D NMR spectra of CatchER from -1.0 ppm to 10.0
ppm in proton dimension with the increased pulse field gradient (PFG) strength.………..156 Figure 4.4 The NMR intensity of CatchER decreased according to the
incre-ment of PFG strength.……….156 Figure 4.5 Temperature dependent peak disperse of CatchER detected by 500
MHz NMR (GSU) HSQC spectroscopy.………158 Figure 4.6 Protein concentration dependent peak disperse of CatchER
de-tected by 800 MHz NMR (UGA, CCRC) HSQC spectroscopy…….162 Figure 4.7 The overlay of the HSQC spectra of CatchER in the presence of 0.1
Figure 4.9 Representative chemical shift of cross-peak Y143.……….168 Figure 4.10 Q69 chemical shift perturbation induced by Ca2+ titration……….170 Figure 4.11 Scheme of hydrogen bond interaction between E222 and L42…171 Figure 4.12 Scheme of hydrogen bond interaction between Y151 and N164..173 Figure 4.13 Scheme of two pairs of hydrogen bonds between I167 and A179,
V163 and Q183.………..174 Figure 4.14 Combined chemical shift changes in combining a backbone amide
proton and nitrogen between the Ca2+-saturated and Ca2+-free form.………..175 Figure 4.15 CatchER 2D {1H-15N} HSQC spectrum recorded at 0 mM Ca2+ and 6 mM Ca2+.………...176 Figure 4.16 Summary of the mainchain H-NH chemical shift perturbation
trig-gered by Ca2+ of the CatchER.………..177 Figure 4.17 The overlay HSQC spectra of 20 uM Mn2+ peak broaden effect of
CatchER.………..179 Figure 4.18 Structure scheme based on EGFP (pdb code: 1EMA) of the Mn2+
broaden effect results.……….180 Figure 4.19 Selected strips of NMR HNCA-HSQC assignment.………..182 Figure 4.20 Selected CatchER 3D HNCA spectra from I14 to E17, with
sequen-tial and intraresidual Cα–Cα connections indicated by red lines.………..183 Figure 4.21 Difference in Cα chemical shift between published and our
Figure 4.22 Representative fitting of peaks integrations collected at 0, 30, 60, 100, 240, 480, 720, 1000, and 1500 ms T1 delays.……….185 Figure 4.23 Overlay of T1 delay spectra from selected region: 0 ms, 1500
ms.……….185 Figure 4.24 The monomerization of CatchER is supported by measured rota-tional correlation time τC with high-field nuclear magnetic reso-nance spectroscopy.………186 Figure 5.1 Structure of EGFP CatchER with the locations of mutated residues (red sticks) Glu147, Asp202, Glu204, Glu223 and Glu225………..289 Figure 5.2 Fo-Fc omit map showing the chromophore from CatchER-Ca2+ con-toured at 4.0σ.………290 Figure 5.3 The hydrogen bonding interactions and selected Fo-Fc omit maps
contoured at 4.0σ.……….291 Figure 5.4 Structural scheme of protonated chromophore of CatchER……292 Figure 6.1 Comparison of coordination difference between Ca2+ binding site
and Mg2+ binding site………...307 Figure 6.2 Major classes of Mg2+ binding sites……….308 Figure 7.1 The major biological functions of thrombin and related
dis-eases……….313 Figure 7.2 The statistic analysis of the cleavage sequence from P4 to P3’ of natural thrombin protein substrates………....314 Figure 7.3 Scheme of grafting approach to engineering single EGFP-based
Figure 7.4 The design strategy of thrombin sensors to optimize steady state kinetics………...…..315 Figure 7.5 The molecular size of thrombin sensors investigated by
SDS-PAGE………….………321 Figure 7.6 Overlap of the absorption spectra of sensor 1 before and after 25 units of thrombin for overnight cleavage………322 Figure 7.7 Steady-state kinetic study of designed thrombin indicator 5 by
LIST OF ABBREVIATIONS GFP: green fluorescent protein
EGFP: enhanced green fluorescent protein BFP: blue fluorescent protein
CFP: cyan fluorescent protein YFP: yellow fluorescent protein RFP: red fluorescent protein
DsRed: tetramer form of red fluorescent protein from coral
DsRed2-ER: commercial available ER-targeted DsRed fluorescent protein mCherry: mCherry fluorescent protein
mCherry-ER: ER targeted mCherry protein FRET: fluorescent resonance energy transfer ESPT: excited state proton transfer
Ca2+: Ca2+ ion, Calcium Gd3+: Gadolinium Tb3+: Terbium
Ln3+: Lanthanide CaM: Calmodulin TnC: Troponin C
ER: Endoplasmic reticulum SR: Sarcoplamsic reticulum
EC-coupling: excitation contraction coupling
Asp: asparate, D, aspartic acid Glu: glutamate, E, glutamic acid Kd: dissociation constant
koff: dissociation rate
kon: association rate
ms: milli-second
EGTA: ethylene glycol tetraacetic acid
BAPTA: 1,2-bis(o-aminophenoxy)ethane-n,n,n’,n’-tetraacetic acid 4-CmC: 4-Chloro-m-Cresol
InsP3: IP3, Inositol 1,4,5-trisphosphate RyR: ryanodine receptor
RyR1: ryanodine receptor isoform-1
SERCA: sarco(endo)plasmic reticulum Ca2+-ATPase
FDB: flexor digitorum brevis TEA: tetraethylammonium
di-8-ANEPPS: di-8-amino naphthyl ethenyl pyridinium CPA: cyclopiazonic acid
LB medium: lysogeny broth medium, luria broth, lennox broth, luria-bertani me-dium.
SV medium: minimal medium of bacterial expressing isotopic labeling protein SDS-PAGE: sodium dodecyl sulfate polyacrylamide gel electrophoresis NMR: nuclear magnetic resonance (spectroscopy)
HNCA: The magnetization of the amide proton of an amino acid residue is trans-ferred to the amide nitrogen, and then to the alpha carbons of both the starting residue and the previous residue in the protein’s amino acid sequence.
CBCACONH: A special NMR 3D experiment designed to correlate the 1H and
15N amide resonances of one residue with both 13CA and 13CB resonances of its
preceding residue via the intervening 13CO spin by means of the 1J(NH), 1J(N,
CO), 1J(CA, CO) and optional 1J(CA, CB) coupling constants. vol/vol: The ratio in terms of volume of two solution.
PDB: protein data bank
HEPES: N-[2-hydroxyethyl]piperazine-N’-2-ethanesulfonic acid IPTG: Isopropyl-β-D-thio-galactoside
Tau C: τc, correlation time
SCT-CCR: shared constant-time cross-correlated relaxation T1: longitudinal relaxation
T2: transverse relaxation
NOE: nuclear overhauser effect CSP: chemical shift perturbation PFG: pulse-field-gradient
O.D.: optical density
SV medium: minimal medium for bacteria expression of isotopic labeling protein. FDB: Flexor digitorum brevis muscle fibres
CHAPTER 1: GENERAL INTRODUCTION: FLUORESCENT PROTEINS AND THEIR AP-PLICATION IN MODERN CELLULAR BIOLOGY
1.1 The discovery of fluorescent proteins (FPs) and their structural properties.
The green fluorescent protein (GFP) is a photosensitive protein composed of 238 amino acids first isolated from Aequorea Victoria jellyfish(3). GFP has a cylindrical beta-can structure folded by eleven β-strands connected with mainchain hydrogen bonds. The chromophore is formed by autocatalytic cyclization of residues S65, T66 and G67 and is deeply buried inside the hydrophobic core of GFP. The complex of hydrogen bonds between chromophore and its neighboring residues is assumed to generate the distinguished fluorescence of GFP, which exhibits an emission wavelength at 510 nm and an excitation of 398 or 475 nm. GFP and its variants have been widely expressed in established cell lines, primary cells and transgenic animals for the targeted imaging or detection of specific molecules(8).
The most important part of GFP is the chromophore, which emits the green fluorescence and is also an important indicator of the activity or the correct folding of protein. It is reported that the chromophore of GFP consists of 3 residues: Ser65, Tyr66 and Gly67. The menchanism for the intramolecular biosynthesis is shown in (Figure 1.2) After these three residues correctly fold with the help of an internal tripe tide motif, the protein is able to emit fluorescence without other cofactors. The formation of chromophore is a slow and calling for high requirement of the environment.
1.2 Application of fluorescent proteins in cell biology.
1.3 Biological roles of Ca2+ and its relevance to diseases and aging.
Calcium is a second messenger in regulating many biological processes by the interac-tion with calcium binding protein in cellular signal transducinterac-tion. The biological funcinterac-tions of cal-cium include cell division, differentiation and apoptosis. The regulation of calcal-cium is influenced by the intracellular calcium concentration, which ranges from submi
cromolar to millimolar levels. Ca2+ binding affinity to specific proteins has been shown to be
important in determining the concentration of calcium. The dynamic effects of Ca2+ binding have been investigated using EF-hand proteins, which are engineered into the enhanced
green fluorescence protein (EGFP) to see the fluorescence signal change. Ca2+ is the most ubiquitous signaling molecule in the human body, regulating numerous
biological functions including heart beat, muscle contraction, neural function, cell development, and proliferation, by fluxing between the subcellular compartments with different amplitudes and durations(12). This signaling is encoded by changes in Ca2+ concentration and fluxes be-tween the intracellular and extracellular space and intracellular organelles(13, 14). The time scale for cytosolic calcium transients varied from us for neuron transmitter release or 0.1 ms
for muscle contraction to days for fertilization/development(15). Such temporal and spatial changes of calcium signaling are controlled by communication among different cellular com-partments such as extracellular space, intracellular stores, endosomes, and golgi via channels, gap junctions and pumps.The membrane-based organelle endoplasmic reticulum (ER), func-tioning as the primary intracellular Ca2+ store, can produce intrinsic Ca2+ release and propaga-tion of Ca2+ oscillations(16-18). Ca2+-mobilization agonists such as ATP, ionomycin, histamine,
and glutamine will activate the Ca2+ receptors and pumps, such as inositol 1,4,5-trisphosphate receptor (IP3R), to release Ca2+ from ER into cytosol(19-21), which results in a rapid decrease
of ER (from mM at the resting state to µM in excited state). The removal of these agonists will help Ca2+ refill the ER through membrane channels such as sarco(endo)plasmic reticulum Ca2+-ATPase (SERCA). The alternation of Ca2+ concentration activates various intracellular
Ca2+ sensing (trigger) proteins, such as calmodulin (CaM), troponin C (TnC) and other ion channels, by their conformational changes upon binding to Ca2+(22). These activated Ca2+
-sensor receptors will further regulate numerous cellular processes and events. Recent studies indicate that Ca2+ signaling is important for homeostatic handling of cardiovascular functions(23-25). In cardiomyocytes, cardiac relaxation and contraction is regulated by the pe-riodic change of intracellular Ca2+ concentration and the proteins associated with the sarco-plasmic reticulum (SR), a homologue of ER(26, 27). The cardiac ryanodine receptor (RyR2), inositol (1,4,5)-trisphosphate receptor (IP3R) and the sarcoplasmic reticulum Ca2+-ATPase 2a
(SERCA2a) are three pivotal portals for the Ca2+ mobilization during this agonist-induced proc-ess. Heart failure caused by dysfunction of these two proteins, featured with abnormal Ca2+
Cellular aging is a fundamental biological process to cause the loss of skeletal muscle strength during contractility in vivo and in vitro. The mechanisms underlying the impairment of the aging skeletal muscle, termed sarcopenia, are partially understood. The original hypothesis
on the relationship between excitation contraction uncoupling and sarcopenia was proposed by Delbono and co-workers(32), suggesting that the number of RYR1 (ryanodine receptor 1) un-coupled to DHPR (dihydropyridine receptor) increases with age, and the SR Ca2+ depletion
dur-ing the EC coupldur-ing declined in agdur-ing skeletal muscle. This hypothesis was initially demon-strated by high affinity ligand binding studies in soleus, extensor digitorum longus (EDL) and in a pool of several skeletal muscles consisting of a mixture of fast- and slow- twitch muscle fibers in middle-aged (14-month) and old (28-months) Fisher 344 Brown Norway F1 hybrids rats. The number of DHPR, RYR1, the coupling between both receptors expressed as the DHPR/RYR1 maximum binding capacity, and their dissociation constant for high affinity ligands were meas-ured. The DHPR/RYR1 ratio was significantly reduced in the three groups of muscles(32). Fur-thermore, using cytosolic Ca2+ indicator Rhod-2, the significant reduction (around 50%) in the
1.4 Role of ER/SR in Ca2+ signaling.
The endo/ sarcoplasmic reticulum (ER/SR) lumen, which occupies less than 10% of cell volume, stores >90% of intracellular Ca2+ and is pivotal in controlling Ca2+ signaling(34-36). The ER/SR Ca2+ store is pivotal in regulating Ca2+ signaling and maintaining Ca2+ gradients
[image:40.612.85.544.82.355.2]men with a four-order magnitude gradient. Changes in free cytosolic [Ca2+] modulate proteins
such as calmodulin (CaM) and troponin C (TnC), which switch on and off numerous biological processes(37).
Sarcoplasmic Reticulum Ca2+ release in the fast twitch skeletal muscle is very important in regulating skeletal muscle contraction. The ER/SR Ca2+ depletion controls SR Ca2+ release, channel/ryanodine receptor (RyR) activity, and/or SR Ca2+ release termination. It is also
es-sential in determining the role of store Ca2+ depletion in activating store-operated Ca2+ entry (SOCE). Due to the unique feature of high free calcium content in the SR of the skeletal mus-cle (~ 1 mM) and fast release kinetics (ms), there are several important questions regarding lumen calcium that have yet to be answered. How fast does ER/SR Ca2+ depletion occur in re-sponse to cell depolarization? What is the ER/SR Ca2+ buffer capacity? What is the resting SR
Ca2+ concentration in muscle cells from young and old species? In addition, understanding the role of calsequestrin and calreticulin in buffering luminal SR free [Ca2+] and release kinetics is
crucial to elucidate the mechanisms underlying ryanodine receptor mutants-related diseases(38).
Studying Ca2+ signaling in this organelle requires highly specific andtargeted indicators.
A qualified Ca2+ indicator is required to monitor fast ER/SR Ca2+ depletion in response to cell activation, quantifying the role of calsequestrin in buffering luminal Ca2+ and its influence on
SR Ca2+ depletion in excitable and non-excitable cells. Additionally, these studies should en-able identifying specific Ca2+ pathways involved in different biological states. A Ca2+ indicator to monitor ER/SR Ca2+ concentration with fast release kinetics especially in excitable cells is
known that free calcium concentration in SR of skeletal muscle cell is around 1 mM, with extra 20 mM calcium bound by calsequestrin. There is a strong need to design a SR calcium sensor with lower binding affinity which is appropriated to measure SR calcium in the muscle cells or tissues. Ideally, the calcium binding affinity should be around 1 mM or sub-millimolar range, similar to the overall calcium binding affinity of SR calcium buffer protein calsequestrin, which is based on the strategy that the cytosolic calcium indicators such as Fura-2, camelone and GCamP2 exhibit Kd around sub-micromolar range within the same magnitude of Kd as
1.5 Tuning Ca2+ binding affinities by rational design.
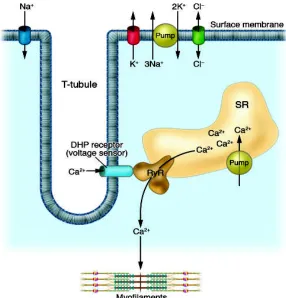
Understanding the key determinants for calcium binding is essential for designing calcium sensors with different affinities. According to the study of putative calcium binding sites fea-tured by pentagonal bipyramidal geometry structure(42), two factors can influence the calcium binding affinity, 1) the coordination number of the binding ligands, 2) the geometric arrange-Figure 1.6 The SR calcium release triggered by excitation-contraction coupling
(E-C coupling) of skeletal muscle. Excitation-contraction coupling of skeletal muscle. A muscle fiber is excited via the nerve by an endplate potential and generates an action potential, which spreads out along the surface membrane and the transverse tubular system into the deeper parts of the muscle fiber. The dihydropyridine (DHP) receptor senses the membrane depolarization, alters its conformation, and activates the ryanodine receptor, which releases Ca2+ from the SR, a Ca2+ store. Ca2+ binds to troponin and activates the so-called contrac-tile machinery. Adopted from (6).
[image:43.612.143.429.73.371.2]ment of the negative charged residues in the binding site. The statistic work done by our labo-ratory and others indicates that calcium has a preference to bind oxygen atoms provided by the carboxyl or hydroxyl groups from the sidechain or mainchain, which can be explained by its hard Lewis acid definition presenting less convalent interaction with a more rigid ionic radius. (43) Compared to other divalent metal ions such as zinc or cooper, the optimal coordination number of calcium is as high as seven.
Our lab has developed the grafting approach for probing site specific Ca2+ binding affinity. We have shown that CD2 is an excellent scaffold protein(42, 44-61). It retains the native struc-ture after the insertion of the EF-hand motif both in the absence and presence of Ca2+ ions. After optimizing the length of two glycine linkers that connect the Ca2+ binding loop and CD2 to provide sufficient freedom for the loop, we have shown that the grafted EF-hand loop retains its native Ca2+ binding property using high resolution NMR and 15N labeled protein(45). Contri-bution of flanking helices to the metal binding affinity of CaM have been investigated by in-serting the EF-loop, the loop with the existing F-helix, and the loop with both EF-helices of Site III of CaM into CD2. In contrast to the largely unfolded structure of the isolated peptide frag-ment, the inserted flanking helices are partially formed, as revealed by both CD and NMR. Ca2+ affinity is enhanced about 3-10 fold when the flanking helices are attached. We have first estimated the intrinsic Ca2+ affinities of the four EF-hand loops of CaM (I-IV) by individually
de-terminants for the Ca2+ binding affinities of EF-loops in CaM. Our grafting method provides a
new strategy to obtain site-specific Ca2+ binding properties and to estimate the cooperativity and conformational change contributions of coupled EF-hand motifs. We have shown that the contribution of the cooperativity and conformational change to the Ca2+ affinity for the C-terminal is 40% greater than that for the N-C-terminal. The same approach will be used to probe the site-specific Ca2+ affinity and kinetic properties of engineered calcium binding proteins and
sensors.
Based on the common features of calcium binding sites from detailed structural analy-sis of calcium binding proteins, our lab has successfully designed a calcium binding site on the surface of a beta-sheet non Ca2+ binding cell adhesion protein CD2 by site-directed mutage-nesis of four to five residues to negatively charged. The first generation of the designed Ca2+
binding CD2 variants having five negatively charged residues as the binding ligands, by fluo-rescent energy transfer between Tb3+ and aromatic residues Tyr81 and buried Trp32, the
hydropho-bic interactions is required. Fourth, three or four negatively charged residues at the primary coordination shell are preferred. The designed calcium-binding site is constructed by ligand residues from three different sequence regions (two anti-parallel beta-sheets and one from a flexible region) with a total of four negatively charged ligands. The metal selectivity of CD2.Ca1 was verified by metal replacement titration, and 1D NMR spectroscope. Adding 10 mM Ca2+ or 0.1 mM La3+ can significantly reduced the fluorescent intensity of CD2.Ca1 pre-loaded with 30
µM Tb3+, while 10 mM Mg2+ or or 100 mM K+ reduced fluorescent intensity only 10-20%, in contrast to 5-10% fluorescent decrement by adding these metals without protein. The metal selectivity further verified by the 1D NMR spectra by observing conformational change induced by Ca2+ in the presence of other metal ions. And the Ca2+ /Mg2+ selectivity was verified by add-ing Ca2+ or Mg2+ in the presence of 130 mM KCl. Mg2+ does not induce conformational change
even up to 10 mM, however, the spectra of 1.0 mM Ca2+ in the presence of 1.0 mM Mg2+ is identical to that of Ca2+ loaded form. A consequential work of designed Ca.CD2 was used to
investigate the effect of designed Ca2+-binding sites on the biological function of CD2. There are different affinities of Ca.CD2-binding to CD48 by surface plasmon resonance in the ab-sence and preab-sence of Ca2+. Using CD2 as the control (100%), the binding of Ca.CD2 to the
conformation-dependent antibody OX34 is 104 and 106% with Ca2+ and EGTA, respectively. The binding to OX55 is 90 and 101% with Ca2+ and EGTA, respectively. These results strongly
colleagues. Although L63 is not located at the functional surface, upon binding to CD48, nuclei in this residue exhibit substantial chemical shift changes that are comparable to those of func-tional surface residues. The Ca2+ binding dissociation constant of Ca.CD2 was measured to
1.4 mM by 2D NMR Ca2+ titration, while the Tb3+ and La3+ binding dissociation constant was 6.6 µM and 5.0 µM, respectively. Metal selectivity of Ca.CD2 between divalent and trivalent metal are more than 200 folds(47). The thermal stability of the designed CD2 variants was also investigated. The Tm of -5 negative charged residues of CD2 variants decreased to 41 °C in
compared to 61 °C of WT CD2, this decrement was partially restored by Ca2+ binding, without
substantial conformational change of the secondary structure(62). The local conformational change of protein was investigated by Ca2+ and Ln3+ titration of CD2.6D79, with similar trend of Tm value changes in the presence and absence of Ca2+ (63), with tuned K
ds ranging from tens
of micromolar to millimolar (47, 52). The secondary structure and spartial distribution of the de-signed Ca2+ binding ligands on the surface of CD2 are different from those in tranditional
EF-hand based a 12-amino acid sequential loop which wraps around a Ca2+ ions, but protruding to the ourside of the protein with high solvent accessibility. We have further shown that calcium binding affinity can be changed by the ligand types and number of charged residues. Moreo-ver, the thermostability of the designed CD2 variants was significantly enhanced after Ca2+ binding investigated by the ITC of the decreased Tm values, in concondence with the
computa-tional simulation results (Yang, W. et. al., 2005, JACS).
In addition to calcium binding affinities and protein folding, metal selectivity is also im-portant. Mg2+ concentration in the intracellular environment is maintained at 0.3-0.6 mM(64)
and 10-6 M for Ca2+). Hence, calcium binding proteins such as EF-hand proteins are likely to be
Mg2+ filled(65-67). Upon activation by the first messages, such as the binding of a hormone or a transmitter, or the passing of a Na+/K+ nerve signal, a dramatic increase in calcium
concen-tration in cells (from ~10-7 M at resting state to ~10-5 M at excited state) causes the removal of pre-bound Mg2+ of calmodulin and TnC upon calcium-binding. In contrast to the marked struc-tural transitions induced by Ca2+ binding, Mg2+ binding causes only localized conformational
changes within the four Ca2+-binding loops of CaM and not able to result in significant struc-tural effects required for the interaction of CaM with target proteins(67). The selectivity of pro-teins to Ca2+ over Mg2+ is defined as a ratio of their association constant, KCa/KMg. The values
of the ratio of KCa/KMg for the first two EF-hand motifs of CaM is about 2.5 x 10² (68). The values
of the KCa/KMg ratio for motif 3 and 4 of TnC and that of Ca-Mg sites of Parv are much higher,
around 4 x 10³. The two motifs of the TnC (N-terminal) are Ca(II)-specific with KCa about 105 M -1. Selectivity against these cations requires the calcium affinity to be superior by several
or-ders of magnitude. In EF- proteins, Ca(II)/Mg(II) exchange appears closely related to physio-logical processes that involve cell excitation and relaxation, such as muscle contraction(69, 70).Therefore, In order to specifically detect calcium, biosensors are required to have strong metal selectivity. Currently, the metal selectivity of the genetically encoded calcium sensors has not been determined quantitatively, though a cytosolic Ca2+ sensor, TnC-XXL, created by
replacing the Mg2+ sensitive domain of TnC by a nonsensitive domain, has been found to ex-hibit improved divalent metal selectivity.
Ca2+ binding affinities and metal selectivities by fluorescent intensity change and HSQC-NMR
chemical shift perturbation with the established methods.The overall Ca2+ binding affinity of designed sensors will be obtained by fluorescence spectrophotometer (Photon Technology In-ternational, Inc.) with the purified protein samples, while the individual Kd of each ligand will be
investigated by chemical shift perturbation of HSQC spectra with NMR 600 MHz in our school as described in the preliminary results. The emitted fluorescent intensity as a function of Ca2+
concentration was fitted by equation 1 and 2 with 1:1 binding model(71), where F represents fraction of Ca2+-bound protein, R is the detected fluorescence intensity, [P]
T is the total protein
concentration and Kd is the dissociate constant. In addition, metal selectivity will be investi-gated by purposely adding different metal ions such as Zn2+, Cu2+, Mg2+ with various concen-trations into protein solution, and examining whether designed sensor can differentiate these metals from calcium according to the fluorescent change. The structural basis of major classes of Mg2+ binding proteins, their capability in binding Ca2+ and Mg2+/Ca2+ selectivity are reviewed
in Chapter VI.
1.6 Factors contribute to kinetic properties of Ca2+ binding.
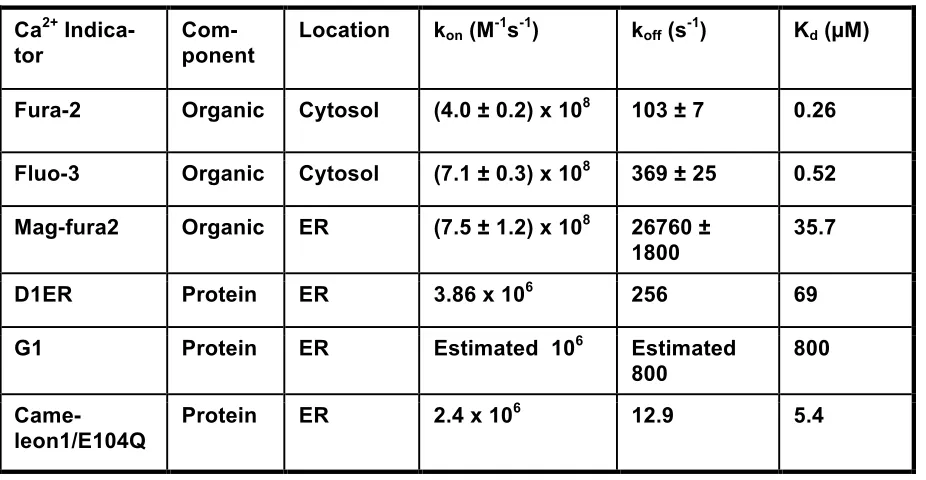
The dissociation time constants of currently reported sensors are GCaMP1 188 ms (72), TN-L15 860 ms, TN-L15 D107A 580 ms, YC2.3 870 ms, TN-hum TnC 560 ms (73), TN-XL two phases, 142 ms, 867 ms (74), YC 3.6 2900 ms and BRET pair 210 ms.
Ca2+ Indica-tor
Com-ponent
Location kon (M-1s-1) koff (s-1) Kd (µM)
Fura-2 Organic Cytosol (4.0 ± 0.2) x 108 103 ± 7 0.26
Fluo-3 Organic Cytosol (7.1 ± 0.3) x 108 369 ± 25 0.52
Mag-fura2 Organic ER (7.5 ± 1.2) x 108 26760 ± 1800
35.7
D1ER Protein ER 3.86 x 10⁶ 256 69
G1 Protein ER Estimated 106 Estimated
800
800
Came-leon1/E104Q
Protein ER 2.4 x 10⁶ 12.9 5.4
[image:51.612.65.528.97.337.2]Additional difficulties and limitations in the tuning kinetics of calcium sensors are origi-nated from multiple coupled calcium binding sites and natural calcium binding proteins used in currently reported sensors (77). The biological function of the CaM and TnC determines the intrinsic kinetics of the calcium binding process. Hence, the up-limit kinetics of signals detected by these indicators can be predicted by the fastest calcium signaling conducted by these pro-teins. TnC sequentially responds to calcium release from the SR and converts calcium signal-ing to physical movements dursignal-ing EC couplsignal-ing with a theoretical delay (75). Further, the multi-ple calcium binding processes of these two proteins usually become the rate-limited step in addition to their complicated stoichiometric interaction mode as well as the potential in pertur-bation of calcium signaling network. In contrast, calcium dye and designed calcium binding site have a single coordination is likely to have adjustable kinetics (78) (79) and affinity.
The mechanism of kinetical properties of Ca2+ binding was reviewed in the introduction
part of Chapter 2, including both the synthesized Ca2+ dyes and genetically encoded Ca2+ indi-cators, and the experimental methods were summarized in the method part of Chapter 2. 1.7 Criteria of a Ca2+ sensor in cells.
The basic criteria of a functional Ca2+ sensor require it to 1) specifically recognize Ca2+ without being influenced by the other metal ions, especially for the divalent metal ions such as Mg2+ and Zn2+, which are in excessive of physiological condition. In addition, it should also ex-hibit 2) an appropriate binding affinity fit for Ca2+ concentration detection, due to the diverse
magnitudes of Ca2+ concentrations present in different subcellular organelles. 3) The optical signal change caused by the different concentration of Ca2+ requires sufficient magnitude for instrument detection and to be easily distinguishable from the noise. Once the above require-ments are satisfied, the designed molecule is able to sense the Ca2+ concentration in vitro with physiological buffer conditions. An advanced sensor, which can be applied for the living cell imaging, should 4) neither be toxic to cells, nor perturb the original function of cells. 5) With re-spect to tissue targeting, the designed Ca2+ sensor should be specifically delivered to the tar-geted organelle without branching, and must subsequently be retained at the targets. 6) The detected signal change must represent the immediate Ca2+ signaling that occurs as a function of time. Some agonists can induce Ca2+ depletion within several macro seconds, so the
One of the major objectives of this dissertation is to design advanced, genetically en-coded Ca2+ biosensors to quantitatively detect Ca2+ signaling in specific subcellular organelles. This will have a significant impact on the understanding of the molecular basis of Ca2+
1.8 Historical development and classification of fluorescent indicators of Ca2+. 1.8 Current Ca2+ indicators
1.8 Current Ca2+ indicators
1.8 Current Ca2+ indicators
As shown in Figure 1.7, current calcium sensors can be classified to synthesized or-ganic chemicals based on the BAPTA scaffold, and genetically encoded fluorescent reporters either by native protein aequorin or chimeric proteins containing fluorescent proteins.
Organically synthesized Ca2+ sensors. This class of Ca2+ sensors was pioneered by Dr. Robert Tsien and evolved from single-wavelength intensity change to ratiometric signal change (78, 80, 81). The majority of these sensors exhibit greater signal dynamic range (e.g. 30-50 fold for fluo-3 (81)) compared with other classes. However, the major barrier of the application to living cells is that they cannot be unambiguously targeted to specific subcellular organelles and easily leak out (82), due to their non-specific membrane-permeable targeting strategy. Thus, the precise cytological location cannot be guaranteed due to limitations associated with both delivery and retention. In addition, it is difficult to load the dyes into denser or thicker tis-sues, hindering further research with animals or even humans.
Bioluminescent Ca2+ indicators are based on Ca2+-binding photoproteins originating from jellyfish which generate luminescence as a result of Ca2+-induced conformational change, but incompatible results have been reported using photoproteins in measuring ER Ca2+
con-centration compared with other methods (83-86). In addition, even after modifying the Ca2+ binding ligands on EF-hands, the Ca2+ binding affinity was still beyond the optimal ER
meas-urement range(87, 88). Moreover, a microinjection of cofactor or cosubstrates is required for the luminescence, which is inconvenient for thick tissue measurement.
pro-teins, characterized by significant overlap between the emission wavelength of the donor and the excitation wavelength of the acceptor, were linked by native CaM and a CaM binding pep-tide from either their N- or C-terminals. The fluorescence resonance can be efficiently trans-ferred from one fluorescent protein to the other upon Ca2+ binding to CaM, which has endured a large conformational change and to bring these two fluorescent proteins closer with an ap-propriate orientation. Unfortunately, the FRET pair-based Ca2+ sensor has only a small signal
change in the detection of Ca2+. A recent development of this kind of sensor has been re-ported, based on computational design, which has increased the dynamic range around 100-fold(90).
of cofactors during the experiment and opened new area of rational design of genetically en-coded biosensors.
easily fused to protein of interest by adding peptides. SNAP-tag (a 20 kDa mutant of the DNA repair protein O6-alkylguanine-DNA alkyltransferase that reacts specifically with benzylguanine (BG) derives) based targeting for example, requires a protein with 182 amino acids as a linker. This is a size that is unfortunately much bigger than the dye itself, and would cause difficulties of flexibly adjusting the distance between the dyes and the targeted protein, thereby hamper-ing the detection of the signals of microdomains with high spatial and temporal resolution. This would not be a problem with genetically encoded indicators. Here, we are not trying to evoke rivals between small organic chemical-base indicators and genetically encoded indicators, but we frankly point out the advantages and disadvantages of each strategy and try to seek solu-tions to existing problems in an unbiased way.
Genetically encoded Ca2+ biosensors based on fluorescent proteins exhibiting high local
specificity have significantly promoted the exploration of subcellular Ca2+ signaling with high accuracy and resolution. Moreover, taking the advantage of gene transfection and in situ pro-tein expression, genetically encoded Ca2+ biosensors have been applied successfully in vari-ous cell types and in animals. However, some Ca2+ signals occur within a very short time such as muscle contraction and neural transmission, and even subtle alternation of the signal pat-tern will result in serious diseases. To differentiate various Ca2+ signal patterns is crucial to probe the mechanisms of Ca2+ mishandling related diseases on a molecular level, so that fast
fluorescent response is required for biosensors to detect these signals in real time, which is also a challenge for current genetically encoded Ca2+ biosensors.
which is a bulk complex with several different binding processes. The calcium binding affinities to C- and N- domain of calmodulin are of different magnitudes. Moreover, holo-form calmodulin and M13 peptide interact will add an additional dissociation constant (Kd) to the overall binding
process, so the apparent Kd of the sensors does not directly come from the calcium binding,
but in a mixture of two Kds with different magnitudes from calcium and calmodulin interaction
and a sequential Kd from the calmodulin and M13 peptide interaction. The calmodulin based
calcium indicator cannot quantitatively measure the calcium change, as the equation of D1ER binding process involving several constants such as Kd1, Kd2 and hill coefficients which are
difficult to measure in situ. Furthermore, the kinetics of CaM and M13 peptide interaction could not be further accelerated due to complex delay.
1.9 Our strategy to design a genetically encoded fluorescent indicator of Ca2+.
In our laboratory, an EGFP-based Ca2+ sensor was successfully created by grafting an EF-hand motif with a continuous Ca2+ binding site into wild type EGFP as scaffold protein(71).
The generated Ca2+ sensor (G1) exhibits a dual 510 nm fluorescence intensity ratiometic change accordingly when excited at 398 and 490 nm was monitored to decide the concentra-tion of Ca2+. Although the dynamic range is relative small (only 10-15% change) in mammalian
cell imaging, this work strongly supports our hypothesis that the GFP chromophore can be al-tered by introducing a Ca2+ induced conformational change. Recently, with exploring the
![Figure 1.5 The Ca2+ gradients among different subcellular organelles. The cytosol [Ca2+] was estimated to 10-7~10-6 M, the lysozyme [Ca2+] was estimated to 10-4 M, the mitochondria [Ca2+] was estimated to 10-4 M, the Golgi [Ca2+] was estimated to 10-3 M, t](https://thumb-us.123doks.com/thumbv2/123dok_us/9221369.990125/40.612.85.544.82.355/gradients-different-subcellular-organelles-estimated-estimated-mitochondria-estimated.webp)