www.hydrol-earth-syst-sci.net/12/1323/2008/ © Author(s) 2008. This work is distributed under the Creative Commons Attribution 3.0 License.
Earth System
Sciences
From near-surface to root-zone soil moisture using an exponential
filter: an assessment of the method based on in-situ observations
and model simulations
C. Albergel1, C. R ¨udiger1,*, T. Pellarin2, J.-C. Calvet1, N. Fritz1, F. Froissard1, D. Suquia1, A. Petitpa1, B. Piguet1, and E. Martin1
1CNRM/GAME (M´et´eo-France, CNRS), Toulouse, France 2LTHE (UMR 5564), Grenoble, France
*now with: Department of Civil and Environmental Engineering, The University of Melbourne, Melbourne, Australia
Received: 16 May 2008 – Published in Hydrol. Earth Syst. Sci. Discuss.: 24 June 2008 Revised: 4 November 2008 – Accepted: 4 November 2008 – Published: 10 December 2008
Abstract. A long term data acquisition effort of profile soil moisture is under way in southwestern France at 13 auto-mated weather stations. This ground network was developed in order to validate remote sensing and model soil moisture estimates. In this paper, both those in situ observations and a synthetic data set covering continental France are used to test a simple method to retrieve root zone soil moisture from a time series of surface soil moisture information. A recur-sive exponential filter equation using a time constant,T, is used to compute a soil water index. The Nash and Sutcliff coefficient is used as a criterion to optimise theT parameter for each ground station and for each model pixel of the syn-thetic data set. In general, the soil water indices derived from the surface soil moisture observations and simulations agree well with the reference root-zone soil moisture. Overall, the results show the potential of the exponential filter equation and of its recursive formulation to derive a soil water index from surface soil moisture estimates. This paper further in-vestigates the correlation of the time scale parameterT with soil properties and climate conditions. While no significant relationship could be determined betweenT and the main soil properties (clay and sand fractions, bulk density and or-ganic matter content), the modelled spatial variability and the observed inter-annual variability ofT suggest that a weak cli-mate effect may exist.
Correspondence to: J.-C. Calvet ([email protected])
1 Introduction
Microwave remote sensing provides a means to quantita-tively describe the water content of a shallow near-surface soil layer, wg(Schmugge, 1983). However, the variable of
interest for applications in short- and medium-range meteo-rological modelling and hydmeteo-rological studies over vegetated areas is the root-zone soil moisture content (w2), which
con-trols plant transpiration. Since the near-surface soil moisture is related to the root-zone soil moisture through diffusion processes, assimilation algorithms may allow the retrieval ofw2from observedwg (Entekhabi et al., 1994; Houser et
factors such as soil texture or vegetation coverage (Calvet and Noilhan, 2000) and the analysed profile soil moisture is model-dependent. The chosen assimilation method may also affect the results (Sabater et al., 2007).
Wagner et al. (1999) proposed to use an exponential filter to estimate the soil water index (SWI) of the root-zone from remotely sensed surface soil moisture time series. A single parameter (T) has to be determined, which implicitly takes many physical parameters into account. The rationale for re-trieving a SWI, instead of root-zone soil moisture values is that over a large footprint, the variability of soil characteris-tics may be very high and may not be represented accurately. In this context, only the relative dynamic range of the soil water content can be represented (R¨udiger et al., 2008). Data assimilation methods are based on unbiased observations. In the case of soil moisture, this is tantamount to using SWI val-ues. A number of studies have already shown the potential of this method using data from the scatterometer on board the European Remote Sensing Satellite (Wagner, 1999; Ceballos et al., 2005; Pellarin et al., 2006). Consequently, this ap-proach may be tested using other existing or future remotely sensed data sets.
The SMOS satellite (Soil Moisture and Ocean Salinity, ESA/CNES), scheduled for launch in 2009, consists of a spaceborne L-band interferometric radiometer able to pro-vide global estimates of surface soil moisture with a sam-pling time step of 2–3 days at the equator and a ground reso-lution of 50 km (Kerr et al., 2001). It is the first satellite de-signed with the intention to measure soil moisture over land. Ground-truth measurements of soil moisture at various loca-tions and covering large climatic gradients (several hundreds of km) will permit to validate the SMOS surface soil mois-ture products and to analyse w2, once the SMOS data are
available at a global scale.
This will be achieved by making use of several soil moisture observation networks, such as the SMOS-MANIA (Soil Moisture Observing System-Meteorological Automatic Network Integrated Application) network in southwestern France (Calvet et al., 2007). With SMOSMANIA, soil moisture profile measurements at 12 locations of the automatic weather station network of M´et´eo-France, the RADOME (R´eseau d’Acquisition de Donn´ees d’Observations M´et´eorologiques Etendu) network, have been obtained since early 2007. This group of sta-tions forms a 400 km transect along the climatic gradi-ent between the Atlantic Ocean and the Mediterranean Sea, with all stations being equipped with probes mea-suring the volumetric soil moisture content at various depths. SMOSMANIA is a long-term data acquisition effort of profile soil moisture observations that will be used to support the validation of soil moisture estimates derived from SMOS observations. Other remote sens-ing products from AMSR-E (Advanced Microwave Scan-ning Radiometer for Earth Observing System), WindSAT (a satellite based polarimetric microwave radiometer), or
ASCAT (Advanced Scatterometer on METOP) may be val-idated by SMOSMANIA as well, together with model soil moisture estimates over France (R¨udiger et al., 2008).
The SMOSREX (Surface Monitoring Of the Soil Reser-voir EXperiment) experimental site (De Rosnay et al., 2006) is located along the same transect and is also included in the validation effort, as SMOSREX includes profile soil mois-ture measurements.
In this paper, the SMOSMANIA project and its scientific objectives are first presented. This is followed by a definition of an exponential filter (Wagner et al., 1999) which allows to estimate the SWI from intermittent surface soil moisture measurements, as well as its recursive formulation (Stroud, 1999). The exponential filter equation, which is the opera-tional filtering method for ERS and ASCAT data, uses a sin-gle tuning parameter: a time constant,T. In this study, the recursive formulation is used and the filter is applied to the surface soil moisture measurements obtained with SMOS-MANIA and SMOSREX to estimate the root-zone soil mois-ture at a depth of 30 cm. In order to explore the link between T and the local environmental characteristics (such as soil properties, depth, etc.), a similar study is performed with synthetic data from the SAFRAN-ISBA-MODCOU (SIM; SAFRAN atmospheric forcing data base; ISBA land surface model; MODCOU hydrological routing model) model suite applied over continental France (Habets et al., 2008).
2 Material and methods
2.1 Definition of soil moisture variables
Different soil moisture variables are used in this study: – wg is the water content (m3m−3) of a surface soil
layer, 5 cm for SMOSMANIA stations, 0-6 cm for SMOSREX, a few mm for SIM.
– w2 is the root-zone soil moisture content (m3m−3),
measured at 30 cm (SMOSMANIA), at various depths (SMOSREX), or integrated over the root-zone profile (SIM and SMOSREX).
– Prior to filtering, surface soil moisturewgobservations
or simulations are scaled between [0, 1] using maximum and minimum values of each time series (ms, dimen-sionless).
– The dimensionless root-zone SWIobsused in Sect. 3.1,
Eq. (7), to assess the quality of the results, is the refer-encew2(either observed in situ or simulated by SIM)
scaled to [0, 1] using maximum and minimum values of each time series. SWImis the result of the
the surface may show soil moisture values below the wilting point and above field capacity, while the profile soil moisture is generally bound by those two parame-ters.
2.2 SMOSMANIA
The main objective of the SMOSMANIA network is to val-idate remote sensing soil moisture products. However, the use of observations obtained from SMOSMANIA is not lim-ited to satellite validation and other objectives include: (i) the validation of the operational soil moisture products of M´et´eo-France, produced by the hydrometeorological model SIM (Habets et al., 2005, 2008), (ii) the validation of new ver-sions of the land surface model of M´et´eo-France (ISBA), and (iii) ground-truthing of future airborne Cal/Val campaigns in support of the SMOS mission. For the first time, automatic measurements of soil moisture have been integrated in an op-erational meteorological network which results in a unique data set.
[image:3.595.315.540.124.681.2]The SMOSMANIA network is based on the existing auto-matic weather station network of M´et´eo-France (RADOME). The RADOME stations observe air temperature and relative humidity, wind speed and precipitation. At some stations the downwelling shortwave radiation is also measured. Twelve existing stations of RADOME in southwestern France were chosen. They are listed in Table 1, from East to West. The stations form a Mediterranean-Atlantic transect (Fig. 1) fol-lowing the marked climatic gradient between the two coast-lines. The locations of the chosen stations are in rela-tively flat areas (mountainous areas are avoided as much as possible) and the altitude of the highest station (MTM) is 538 m a.s.l. The three most eastward stations (NBN, LZC and MTM) are representative of a Mediterranean climate. The average distance between two neighbouring stations is approximately 45 km which is consistent with the spatial res-olution of the future SMOS footprints. The vegetation cover at those sites consists of natural fallow, cut once or twice a year. Four soil moisture probes were horizontally installed per station at depths of 5, 10, 20 and 30 cm. The ThetaProbe ML2X of Delta-T Devices was chosen because it has suc-cessfully been used during previous long-term campaigns of M´et´eo-France and because it can easily be interfaced with the RADOME stations. The ThetaProbe is a capacitance probe using the dielectric permittivity properties of the soil to estimate the volumetric soil moisture content (White et al., 1994). The impedance of its array of four prongs varies with the two components of the soil impedance: the appar-ent dielectric constant and the ionic conductivity. As out-put, the ThetaProbe provides a voltage signal in unit of V (White et al., 1994) and its variation is virtually proportional to changes in the soil moisture content over a large dynamic range.
Table 1. Soil characteristics of the 12 stations of the SMOSMANIA network at four depths (5, 10, 20 and 30 cm): clay and sand frac-tions, organic matter, and bulk density. The stations are listed from East to West (Narbonne to Sabres).
Stations Depth Clay Sand Organic matter Bulk density (cm) (g kg−1) (g kg−1) (g kg−1) (kg m−3) Narbonne (NBN)
5 464 262 62.4 1260 10 492 232 54.6 1545 20 455 268 45.6 1237 30 428 315 44.6 1237 L´ezignan Corbi`eres (LZC)
5 273 440 29.6 1383 10 251 490 20.8 1498 20 262 497 18.3 1468 30 278 510 17.0 1468 Mouthoumet (MTM)
5 294 420 71.0 1438 10 305 411 61.8 1540 20 278 452 59.5 1561 30 298 419 47.5 1600 St F´elix de Lauragais (SFL)
5 228 435 19.6 1575 10 224 403 14.2 1533 20 239 397 16.5 1524 30 294 320 11.9 1553 Montaut (MNT)
5 150 283 33.2 1405 10 153 313 19.4 1444 20 146 299 14.2 1562 30 154 276 10.8 1458 Savenes (SVN)
5 194 361 12.8 1425 10 193 339 11.6 1453 20 195 346 10.7 1532 30 353 239 5.6 1532 Lahas (LHS)
5 353 278 27.2 1518 10 410 207 25.8 1500 20 404 223 25.3 1535 30 395 217 19.2 1370 Condom (CDM)
5 410 148 17.2 1419 10 442 134 25.5 1522 20 456 124 20.5 1460 30 460 133 19.2 1574 Peyrusse Grande (PRG)
5 417 158 39.8 1285 10 423 156 31.3 1476 20 440 175 18.1 1449 30 501 121 15.1 1536 Cr´eon d’Armagnac (CRD)
5 57 881 44.5 1305 10 53 884 27.1 1435 20 47 898 28.3 1615 30 50 878 23.2 1412 Urgons (URG)
5 157 159 27.6 1370 10 158 154 21.9 1500 20 152 164 19.8 1530 30 172 144 8.1 1590 Sabres (SBR)
Fig. 1. Map illustrating the SMOSMANIA network located in southwestern France (full dots) forming a 400 km transect between the Atlantic ocean and the Mediterranean sea. The “+” symbol is for the SMOSREX station. The stations are equipped with sensors measuring volumetric soil moisture content and soil temperature at various depths.
Site-specific calibration curves were developed using in-situ gravimetric soil samples in order to convert the voltage signal into volumetric soil moisture content (m3m−3). As calibrations have to be performed for each soil type (i.e. for all stations) and for each depth, 48 calibrations curves were obtained for the SMOSMANIA network. The calibration was performed both in-situ (through regular gravimetric sam-pling around the station performed in 2006 and 2007) and in a laboratory set-up (monitoring of a given sample in various controlled conditions). Exponential calibration curves were found to represent best the relationship between the volumet-ric soil moisture content and the voltage measured by the sensor. The ThetaProbes are set to perform measurements at regular intervals of 12 min. They were installed in 2006 and have been operational since then, so that data covering the whole 2007 annual cycle and the two first months of 2008 are available for this study.
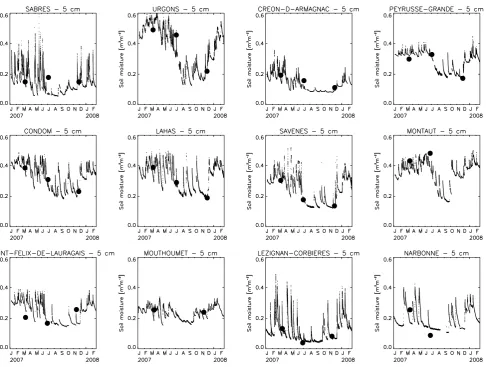
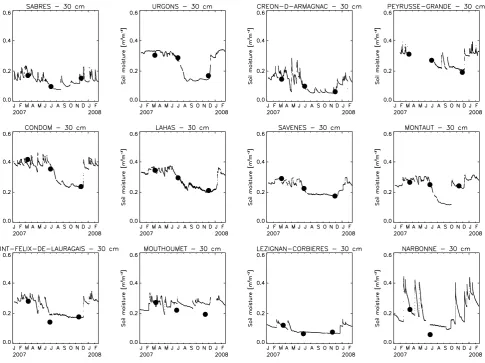
Figures 2 and 3 show the 5 cm (wg) and 30 cm
(w2) volumetric soil moisture content (m3m−3) for the
12 SMOSMANIA stations, respectively, over a period of 14 months (January 2007–February 2008) and at 12 min time
intervals. Except for the stations of LHS, MTM and LZC, there is a good agreement between surface soil moisture and deepest soil moisture. The squared correlation coefficient (r2) betweenwgandw2is greater than 0.5.
During the installation of the soil moisture probes, soil samples where collected for each of the four depths of the soil moisture profile (5, 10, 20 and 30 cm). Those samples were used to determine soil texture, soil organic matter and bulk density (see Table 1).
2.3 SMOSREX
Located at the ONERA (Office National d’Etudes et de Recherches A´erospatiales) site of Fauga-Mauzac, near Toulouse in southwestern France (Fig. 1), the SMOSREX experiment (De Rosnay et al., 2006) aims at improving the modelling of the microwave L-band emission of the soil-vegetation system as well as improving the understanding of soil-plant-atmosphere interactions. The SMOSREX site consists of two plots (one of bare soil, one with fallow), ob-served by an L-band radiometer (LEWIS) installed at the top of a central structure, 15 m a.g.l. Operations began in January 2001 with the monitoring of soil moisture and tem-perature profiles. Soil moisture measurements are taken by ThetaProbes at depths of 0–6 cm, 10, 20, 30, 40, 50, 60, 70, 80 and 90 cm and are available from January 2001 to De-cember 2007 with an half-hourly time step. Using the soil moisture observations at each depth the integrated soil mois-ture in the root-zone is defined as the arithmetic average of those observations.
2.4 SIM
In the present study, the SIM model suite SAFRAN-ISBA-MODCOU is used to compute a surfacewg and a root-zone
w2 soil moisture data base over continental France from 1
August 2002 to 31 August 2004.
SAFRAN (Syst`eme d’analyse fournissant des renseigne-ments atmosph´eriques `a la neige) (Durand et al., 1993) is a mesoscale atmospheric analysis system for surface variables and was initially developed in order to provide an analysis of the atmospheric forcing in mountainous areas for snow depth and avalanche forecasting. The SAFRAN analysis provides the main atmospheric forcing parameters (precipitation, air temperature, air humidity, wind speed, incident radiation) us-ing information from more than 1000 meteorological stations and more than 3500 daily rain gauges throughout France. An optimal interpolation method is used to assign values for each analysed variable. It was shown that a good correlation be-tween the SAFRAN data base and in-situ observations exists (Quintana-Segui et al., 2008).
Fig. 2. Volumetric soil moisture measured for the 12 stations of the SMOSMANIA network over a 14 month period (from January 2007 to February 2008), at a depth of 5 cm: continuous observations with an automatic probe (solid line), and soil moisture obtained through gravimetric measurements (dots).
The soil layer and soil moisture dynamics are modelled within a 3-soil-layer model (Boone et al., 1999) with the soil and vegetation parameters being derived from a global data base of soils and ecosystems (ECOCLIMAP; Masson et al., 2003). For the purpose of the land surface simulations, the ISBA parameters, provided by ECOCLIMAP at a resolution of 1 km, were aggregated to the model resolution of 8 km. The ISBA model simulations were performed at this resolu-tion.
MODCOU is a hydrogeological model and was not used in the current study.
SIM was extended to the whole of continental France in 2002 in order to monitor water resources at the national scale in near real-time (Habets et al., 2008). In total, SIM con-sists of a 9892 pixel data base. For each pixel, data such as surface and rootzone soil moisture, the thickness of the soil layer, fraction of clay and sand, LAI (Leaf Area Index), and the atmospheric forcing are available. For hydrological
pur-poses, the database exceeds the political borders and covers, in particular, regions of Germany and Switzerland (over these regions, the quality of the atmospheric forcing is reduced as no ground observation is used in the analysis).
Thewg data set is used to derive a spatially and
tempo-rally distributed SWImproduct, described in Sect. 3.4, which
is based on the exponential filter. In Sect. 4, the retrieved SWImis compared to the referencew2, scaled to [0, 1] using
maximum and minimum values of the time series. 2.5 The exponential filter
Fig. 3. Volumetric soil moisture measured for the 12 stations of the SMOSMANIA network over a 14 month period (from January 2007 to February 2008), at a depth of 30 cm: continuous observations with an automatic probe (solid line), and soil moisture obtained through gravimetric measurements (dots).
the use of a water movement simulation model to compute the vertical moisture distribution in the soil profile. Assum-ing that hydrologic equilibrium conditions are satisfied, and provided soil properties are known, it is possible to estimate the profile soil moisture content from instantaneous surface observations. However, this assumption of near-equilibrium does not occur after rainfall and is not likely to be valid at daytime due to the high variability of the energy and wa-ter budget. To avoid the decoupling betweenwg andw2
af-ter rainfall events, long time series may be correlated to the root-zone, and to avoid the daytime decoupling, surface soil moisture measurements should be taken during the morning (Jackson et al., 1980).
Several approaches can be used in order to relate profile soil moisture to surface soil moisture (Houser et al., 1998; Walker et al., 2001b; Sabater et al., 2007). In a simplified two-layer water-balance approach, the root-zone soil ture can be estimated by convoluting the surface soil
mois-ture time series with an exponential filter (Wagner et al., 1999). The top layerwgis regarded as the remotely sensed
surface layer and the second layerw2as a “reservoir” below.
Once assuming that the water flux between those two layers is proportional to the difference in soil moisture content be-tween the two layers, a simple water balance equation Eq. (1) can be used to establish a connection betweenw2andwg:
Ldw2(t )
dt =C·[wg(t )−w2(t )] (1)
whereL is the depth of the second layer,t represents time andC is an area-representative pseudo-diffusivity constant. Under the assumption that C is constant and T=L/C, the integration of Eq. (1) is:
w2(t )=
1 T
Z t
−∞
wg(τ )exp
−t−τ
T
dτ (2)
parameter for all the processes affecting the temporal dynam-ics of soil moisture, such as the thickness of the soil layer, soil hydraulic properties, evaporation, run-off and vertical gradient of soil properties (texture, density).T represents the time scale of soil moisture variation, in units of day (Ceballos et al., 2005). Different important processes such as transpira-tion are not considered in Eq. (2). Additranspira-tionally, it is assumed that the soil hydraulic conductivity is constant while it may vary in reality by several orders of magnitude depending on the soil moisture conditions (Wagner et al., 1999).
Remotely sensed data provide measurements at irregular time intervals, thus the continuous formulation of Eq. (2) is replaced by a discrete equation (Wagner et al.,1999):
SWIm(tn)= n
P
i
ms(ti)e−
tn−ti T
n
P
i
e−tn
−ti T
(3)
where ms(ti) is surface soil moisture, estimated from
re-mote sensing at timeti. The scaled and therefore
dimen-sionless surface soil moisture content is retrieved in Wagner et al. (1999) by first extrapolating the observed backscatter to a reference angle of 40 degrees and then scaling this servation between the maximum and minimum values ob-served during the instrument’s lifetime. This discontinuous time series replaces the continuous parameterwg(t ). The
quantityw2(t )is replaced by the Soil Water Index (SWIm).
The SWIm at time tn is calculated if there is at least one
measurement in the time interval [tn−T, tn] and at least
4 measurements in the interval [tn−3T, tn] (Pellarin et al.,
2006).
SWIm is a trend indicator ranging from 0 to 1. For
esti-mating the water in deeper layer, auxiliary information like soil physical properties are required. In Wagner et al. (1999) a plant available water (PAW) content is derived from the SWIm by using auxiliary information about the soil
physi-cal properties (wilting point, field capacity and total water capacity), and thus converting relative values into absolute soil moisture content. Equation (3) was validated against in-situ measurements by Ceballos et al. (2005) in the semi-arid region of the Duero Basin in Spain. They found a statisti-cally significant coefficient of determination (r2=0.75) and a RMSE of 0.022 m3m−3when comparing the PAW values derived from scatterometer and area-averaged field measure-ments (0–100 cm).
2.6 Recursive formulation of the exponential filter
In contrast to Wagner et al. (1999), Stroud (1999) presents a recursive formulation of the exponential filter. In the case of soil moisture, the following recursive equation can be writ-ten:
SWIm(n)=SWIm(n−1)+Kn(ms(tn)−SWIm(n−1)) (4)
where the gainKat timetnis given by:
Kn=
1 1+
n−1
P
i
e−(tn
−ti ) T
(5)
This gain may also be written in a recursive form as:
Kn=
Kn−1
Kn−1+e− (tn−tn−1)
T
(6)
The range of the gainK is [0, 1]. In the presence of ex-tensive temporal data gaps (relative to the filter time scale), Eq. (6) tends toward unity. In that particular case, the pre-vious estimates are disregarded when new observations are obtained and the new estimate takes on the value of the new observation. For the initialisation of the filter, K1=1 and
SWIm(1)=ms(t1).
This recursive formulation can handle data more easily than the original exponential filter (Eq. 3), as the only re-quirement for an update of the SWImis (apart from the
pre-vious SWIm andK values) the availability of a new ms(tn)
observation and the time interval since the last observation (tn−tn−1).
In this study, the recursive formulation of the exponential filter, as proposed by Stroud (1999), was used. Both meth-ods are mathematically equal. However, the initialisation and the implementation of the recursive and non-recursive filters differ (the recursive formulation suppresses the need to pre-scribe an integration interval and to store past time series). It was verified that the two methods yield similar results for the SMOSMANIA network and at the SMOSREX station.
3 Application of the exponential filter
3.1 Statistical scores
In order to assess the quality of the exponential filter, the cor-relation coefficient (r), the root mean square error (RMSE), the bias and the Nash-Sutcliffe coefficient (N) were deter-mined. The Nash-Sutcliffe coefficientN is defined as
N=1−
P
i
(SWIobs(i)−SWIm(i))2
P
i
(SWIobs(i)−µSWIobs)2
(7)
where SWIm(i) and SWIobs(i) are the modelled and
ob-served SWI at timei. TheµSWIobsvalue is the overall
aver-age of the observed (reference) SWI.Ncan range from−∞
to 1. A value of 1 corresponds to a perfect match between modelled and observed data. A value of 0 indicates that the model predictions are as accurate as the mean of the observed data, whereas a value of less than 0 occurs if the observed mean is a better predictor than the model output (Nash and Sutcliffe, 1970).
3.2 SMOSMANIA
For each SMOSMANIA station, thewgsoil moisture
obser-vations at a depth of 5 cm, scaled between [0, 1] using the minimum and maximum values of each time series, are used to calculate SWIm. The calculated SWImis then compared
tow2(soil moisture observations at 30 cm, the deepest
obser-vation at the SMOSMANIA stations) scaled to [0, 1] using the minimum and maximum values of each time series, for different values ofT (up to 40 days). At SMOSREX, soil moisture observations are available from the surface down to 90 cm, and a SWIobsrepresenting the fully integrated scaled
root-zone soil moisture can be computed. The analysis of SMOSREX data (not shown) indicates that local soil mois-ture observations at depths ranging from 20 cm to 50 cm are significantly correlated to the root-zone soil moisture inte-grated over the whole profile. Ther2values over a period of three years (2001–2003) exceed 0.9. For the SMOSMANIA network, it is assumed that scaled soil moisture observations at 30 cm are a good proxy of the scaled root-zone soil mois-ture.
For each station theT parameter corresponding to the best value of a statistical score (Norr) is determined and is called Topt. In general theN value was used to optimiseT, except
for the stations of MTM and SBR. While the highestNvalue retrieved for the former is negative for any value ofT , the retrievals of the latter always result in an underestimation of the root-zone soil moisture and is very low, 0.016. Conse-quently, theT values at those stations were optimised using rbetween the retrieved SWImandw2.
3.3 SMOSREX
The values of wg (surface (0–6 cm) soil moisture
observa-tions) at SMOSREX are used to calculate SWImover a 7 year
period (2001–2007) using the exponential filter for different values ofT (up to 40 days). The SWImvalues are compared
tow2 (the soil moisture observations at 30 cm and then at
other depths from 10 cm down to 90 cm) and to the soil mois-ture integrated over the root-zone.
3.4 SIM
Surface soil moisture information from the 9892 grid cells of the SIM database are used to compute SWIm. In SIM,wg
corresponds to a skin soil moisture (a few mm at the soil sur-face), andw2corresponds to the total soil moisture content
of the second soil layer of ISBA. The thickness of this layer may vary from one grid cell to another. For each grid cell, different T values are used in order to retrieve Topt
corre-sponding to the highest value ofN.Toptwas optimised over
the two year period of the data base (2003–2004). Negative values ofN are sometimes observed over mountainous and dense urban areas (not shown). Over mountainous areas, per-turbing physical factors (snow, soil freezing) affect the sensi-tivity ofwgtow2. Over dense urban areas, the soil moisture
simulated by SIM is not relevant. The grid cells for which the maximumNis negative are excluded from the database. As a consequence, a 9258 grid cell database is available with Topt, and the scores of the SWImretrieval (r, RMSE, bias and
N) versus the reference simulatedw2.
4 Analysis of the results
In this section, theToptvalues obtained with the
methodol-ogy described in Sect. 3 are presented, along with the corre-spondingr, RMSE, bias andN, in Tables 2 and 3 for SMOS-MANIA (the 12 stations) and SMOSREX, respectively. Fig-ures 4 to 12 illustrate the results obtained with the in situ data of SMOSMANIA and SMOSREX, and with the syn-thetic data of SIM.
4.1 Performance of the exponential filter
Fig. 4. Soil water index (SWIm[-]) at 30 cm derived fromwg[-] (scaled surface soil moisture observations at 5 cm, large dots) andw2[-] (scaled soil moisture observations at 30 cm, small dots), for the 12 stations of SMOSMANIA over a 14 month period. The characteristic time length of the exponential filterT=6 days is used, i.e. the mean value of the 12 optimisedT parameters.
4.1.1 SMOSMANIA
Table 2 shows good SWIm retrieval results for the majority
of the SMOSMANIA stations, at a depth of 30 cm: 7 stations presentN values higher than 0.7 (SFL, MNT, SVN, LHS, CDM, PRG, URG). Fair values ofN are obtained for NBN and CRD (0.675 and 0.635, respectively). Results for LZC are poor (N=0.376) and negative or very low values ofN are obtained for MTM and SBR (see Sect. 3.2). Despite the biased retrieval of MTM and SBR, seasonal dynamics in the root-zone soil moisture are well retrieved. It is interesting to note that mostN values lower than 0.7 are observed at the stations presenting the highest fraction of sand (Table 1): the average fraction of sand at LZC, MTM, CRD, SBR is higher than 40%.
The values of r and RMSE are less contrasting than N, from one station to another. The averager and RMSE are 0.88 and 0.16, respectively. The average bias is 0.076.
The RMSE represents the relative error of the soil mois-ture dynamical range. With an average dynamic range of 0.194 m3m−3 for the SMOSMANIA network at 30 cm
depth, and an average RMSE value of 0.163, an estimate of the average error of the root-zone soil moisture retrieval is about 0.031 m3m−3.
The retrievedToptvalues presented in Table 2 range from
1 to 23 days, with an average of 6 days. In order to test the sensitivity of the exponential filter to changes inTopt(or to
the use of a singleToptvalue for all the stations),T was set to
6 days for all sites. The new value ofN for each site is also shown in Table 2. The SWImfor all stations of the
SMOS-MANIA network, calculated withToptset to 6 days, are
pre-sented on Fig. 4 along with the referencew2. Although the
initialToptranges from 1 to 23 days, peaks and troughs are
still well represented with the averagedTopt=6 days. The
ma-jority of the sites maintain a high value ofN, which suggests that the sensitivity to changes inT is limited.
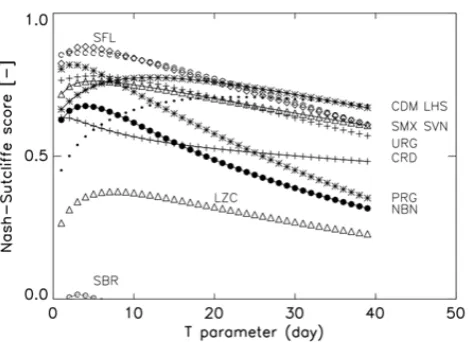
The evolution of N as a function of T for the 12 SMOSMANIA stations is shown in Fig. 5. It is obvious that several monitoring sites have a large range of possible Topt values with a highN. These results support the
Fig. 5. Nash-Sutcliffe score of the SWIm[-] at 30 cm derived from
wg[-] (scaled surface soil moisture observations at 5 cm) versus the
characteristic time lengthT used in the exponential filter for the 12 SMOSMANIA stations (Table 1) and for the SMOSREX station (SMX) from 2001 to 2007. SBR, open circles and full line, SMX, open circles, URG, +, CRD, + and full line, PRG,∗, CDM,∗and full line, LHS, dots, SVN, triangles and full line, SFL, diamonds, LZC, triangles, NBN, solid circles and full line, MNT, diamonds and full line,Nvalues for MTM station are negative (see Table 2).
4.1.2 SMOSREX
As the SMOSREX time series of soil moisture covers 7 annual cycles,Toptwas determined for each individual year,
to gain an understanding of the inter-annual variability of this parameter. Table 3 presents Toptfor each year and for the
whole period (Topt=6 days), and the corresponding w2
sta-tistical scores. The value ofN ranges from 0.557 to 0.935, with a mean of 0.845. ForTopt=6 days aN value of 0.858
is obtained. The averager and RMSE are 0.946 and 0.113, respectively. The bias for the whole period is 0.026. The difference between theNvalues corresponding to the annual Topt or to Topt=6 days is low, which is consistent with the
results obtained with the data from the SMOSMANIA net-work (Sect. 4.1.1). The optimisation of the calculated SWIm
on the basis of the SWIobsobtained from the integrated soil
moisture observations over the complete root-zone depth at SMOSREX yields aToptof 11 days and anNvalue of 0.837,
which is only marginally lower than theN value for 30 cm. The retrieval of SWImat 30 cm for the SMOSREX site is
shown on Fig. 6 forTopt=6 days along with the scaled
obser-vations at 30 cm for the period of January 2001 to December 2007 (minimum and maximum values over the 7 year period are used to scale the observations). The two time series com-pare generally well but two shortcomings are observed:
– In order to assess the impact of the interannual vari-ability on the method,wg is scaled between [0, 1]
us-ing the minimum and maximum values of the whole 7 year period. At wintertime, while the observations
Table 2. The retrieved optimum characteristic time lengthToptof the recursive formulation of an exponential filter for each SMOS-MANIA station, atw2 (a depth of 30 cm). Statistical scores are given for each station: the correlation coefficientr, the root mean square error (RMSE), the bias, the Nash-Sutcliffe coefficient (N) corresponding toTopt, and to the averageTopt(6 days).
Stations Topt r RMSE bias N Nfor
Topt=6days
NBN 4 0.887 0.145 0.074 0.675 0.672 LZC 8 0.826 0.231 0.126 0.376 0.367 MTM 1 0.495 0.193 0.043 negative negative SFL 4 0.940 0.102 -0.008 0.882 0.879 MNT 2 0.958 0.134 0.080 0.796 0.777 SVN 5 0.952 0.161 0.098 0.762 0.762 LHS 23 0.926 0.180 0.067 0.706 0.591 CDM 12 0.888 0.137 0.009 0.774 0.743 PRG 2 0.932 0.126 0.057 0.818 0.798 CRD 1 0.912 0.151 0.105 0.635 0.605 URG 5 0.931 0.183 0.086 0.780 0.780 SBR 4 0.895 0.217 0.184 0.016 negative
reach saturation, a saturation of the retrieved SWImis
not achieved every year. However this condition is ob-tained ifwgis scaled separately on a year by year basis.
– At summertime, the retrieved SWImoverestimates the
observations during the relatively wet years of 2001 and 2002. These periods display strong, but short precipi-tation events that resulted in a wet surface and conse-quently a high estimated SWIm, whereas the in situ soil
moisture profile observations show that those precipita-tion were not strong enough to increasew2.
A possible seasonal impact on theT parameter for the 7 year period of SMOSREX was investigated. Instead of apply-ing the filter with T=6 days to the whole period, the filter was applied season by season (winter, spring, summer, au-tumn, withT values optimised for each season pooled over the 7 year period, of 2, 3, 4 and 6 days, respectively). The seasonal SWIm values were then aggregated and compared
to the scaled observations at 30 cm. The obtainedN value (0.717) is lower than for the standard method (0.858). 4.1.3 SIM
The spatial variability of Topt over continental France was
analysed thanks to the SIM database. Figure 7 shows maps of NandToptover the SIM domain for all the grid cells (i.e. for
spatially varying values of thickness of the root-zone and soil texture). Median values ofN andToptare 0.68 and 15 days,
respectively.
An example of retrieval is given in Fig. 8 for one grid cell (4.96◦E, 43.68◦N) of the SIM data base. The SWImderived
fromwgand the corresponding root-zone soil moisture
[image:10.595.319.538.144.277.2]Fig. 6. Soil water index (SWIm[-]) at 30 cm derived fromwg[-] (scaled surface soil moisture observations at 0–6 cm, solid line) andw2[-] (scaled soil moisture observations at 30 cm, dashed line), for the SMOSREX station over a 7 year period (from January 2001 to December 2007). The characteristic time length of the exponential filterT=6 days is used, i.e. the best-fit value for the 7 year period.
Table 3. The retrieved optimum characteristic time lengthToptof the recursive formulation of an exponential filter for each year (2001 to 2007) of the SMOSREX data set, and for the pooled (2001–2007) data set, atw2(a depth of 30 cm). Statistical scores are given for each period: the correlation coefficientr, the root mean square error (RMSE), the bias, the Nash-Sutcliffe coefficient (N) corresponding toTopt, and to theToptof the pooled data set (6 days).
Period Topt r RMSE bias N Nfor
(days) T=6 days
2001 11 0.792 0.101 0.0001 0.557 0.512
2002 11 0.966 0.141 −0.004 0.863 0.847
2003 9 0.953 0.140 0.066 0.839 0.834
2004 5 0.976 0.140 0.030 0.880 0.878
2005 3 0.969 0.097 0.035 0.904 0.893
2006 6 0.978 0.086 −0.035 0.927 0.927
2007 6 0.979 0.077 0.001 0.935 0.935
2001–2007 6 0.956 0.121 0.026 0.858 0.858
and because it is a representative grid cell compared to the average properties of each individual grid cell. For this grid cellTopt=10 days, which is less than the average value (14.2),
the thickness of the root-zone is 1.4 m and the fractions of clay and sand are 0.32 and 0.38, respectively.
Across the full data set, the performance of the filter is good (N is higher than 0.7 for about 50% of the grid cells), and the variability of Topt throughout the SIM domain is
rather small with 50% of the values ranging mostly from 10 to 15 days. The highest values ofTopt are found in the
mountainous areas of the Alps and Pyrenees, and this may be explained by contrasting climatic conditions (snow cover, freezing, thawing etc.) compared to the plain areas (Fig. 7). 4.2 Impact of soil depth/thickness
Equation (1) shows thatToptdoes depend on the soil depth
or thickness for which SWImis computed. Soil moisture
[image:11.595.53.283.346.449.2]ob-servations at SMOSREX are available at depths between 10 and 90 cm, and the SIM derived SWIm may correspond to
Fig. 7. Results of the recursive formulation of the exponential fil-ter over France based on modelled soil moisture (SIM) for a 2-year period: Nash-Sutcliffe coefficientN of the SWIm[-] derived from
wg[-] (scaled surface soil moisture simulations left), optimised
characteristic time lengthToptof the recursive formulation of the exponential filter (right). The results are given for variable values of the soil thickness (from 0.2 to 2.0 m). Dark to light-grey classes correspond to values ofNandToptbinned in 4 intervals of decreas-ing value: [good (N >0.7), fair (0.5>N >0.7), poor (0.2>N >0.5), inadequate (N <0.2)] and [>15d, 12–15d, 10–12d,<10d], respec-tively.
contrasting soil thickness values. Therefore, it is possible to compare the SWIm derived from the surface soil moisture
observations at several depths or for several soil thickness values and to obtain the correspondingToptvalues.
Figure 9(left) presents the retrievedToptfor the individual
sensors installed at different depths within the SMOSREX soil moisture profile (from 10 cm to 90 cm). As expected, it is found thatToptincreases with the considered soil depth. In
Fig. 9(right) theToptvalues are presented as a function of the
soil thickness, for SMOSREX (integrated from the surface to 10 cm and up to 90 cm deep), and for SIM. In the case of SIM, binned and averaged values ofToptare presented, for
different soil thickness values (19 classes of soil thickness are used, from 22 cm to 197 cm). TheToptderived from the
4.3 Impact of soil characteristics
Other parameters with a potential impact onToptare soil
tex-ture (clay and sand fraction), the bulk density, and the or-ganic matter content, as they influence the infiltration capac-ity of the soil. Observed soil characteristics are available for SMOSMANIA (Table 1). For SIM, the model simulations account for soil texture, only.
In the case of SMOSMANIA, despite the results discussed in Sect. 4.1.1 where it was shown that sandy soils tended to have the lowestN values, a detailed analysis of correlation of particle size distribution withN did not present any con-clusive results.
In the case of SIM, over France, soil texture has little in-fluence onTopt, as shown by Fig. 10. In Fig. 10, the retrieved
Toptis displayed as a function of clay and sand fractions, for
the dominant soil thickness class (1.50±0.05 m). In order to reduce the influence of climatic conditions on the retrieval of Topt, attempts were made to analyse the correlation over
re-gions of 80×80 km. The results obtained (not shown) were similar to those presented in Fig. 10. Consequently, it is con-cluded that soil texture may not play a significant role in the determination ofTopt.
4.4 Impact of climate
As mentioned earlier,Toptmay be affected by local climate
conditions. This assumption is further supported by the re-sults in Table 3, where a rather large inter-annual variabil-ity ofTopt is observed for SMOSREX. In order to explore
this climate impact on Topt, the SIM data base was used.
All the Topt values of the main depth class (1.50±0.05 m)
were extracted over a south-north transect extending from the Mediterranean part of the Rhˆone valley to the Saˆone plain (44.8◦N–46.9◦N, 4.6◦E–5.4◦E). This transect presents a strong climatic gradient, with higher temperatures in the southern part (subject to a Mediterranean climate) than in the northern part (subject to a more temperate, continental climate), and a different precipitation regime. The average wind speed is also stronger in the southern part (Troen and Patersen, 1989). The extractedToptvalues were binned and
averaged over regular intervals of 50 km. Figure 11 shows thatTopttends to increase from the Mediterranean region to
the Saˆone plain. Lower values ofToptare representative of a
faster response of SWImtowgand this is consistent with the
higher evaporation demand (higher temperatures and wind speed) and the less frequent, but more intense, precipitation events observed in the southern part of the transect.
5 Discussion
This study provides several insights into the use of the semi-empirical approach developed by Wagner et al. (1999) to re-trieve the root-zone soil moisture from remote sensing sur-face soil moisture estimates. It is shown that the main factor
impacting on the retrieval is soil depth or soil thickness (Topt
increases with soil depth or soil thickness). TheToptvalues
vs. soil thickness as derived from the simulated profiles or from the observed ones at SMOSREX are consistent. This study does not permit to establish a link betweenTopt and
soil texture (fraction of clay or sand).
The dominant climatic conditions within a region may in-fluenceTopt. The data on Fig. 11, are obtained from model
simulations throughout the Rhˆone valley, which suggests that a climate factor may exist. However, it is difficult to find a climate effect onToptderived from the full SIM data set.
The Rhˆone valley example is a rather extreme case. The Rhˆone gradient found onToptfrom model simulations only
suggests that a climate factor may exist. Further investigation is needed to consolidate this result.
The exponential filter was shown to significantly lack sen-sitivity toTopt. The results presented in Tables 2 and 3 have
different Nash-Sutcliffe coefficients corresponding to differ-entT values (Toptand averagedTopt). Particularly the results
of Table 3 show this lack of sensitivity. While an interannual variability ofToptexists, the difference between the two
val-ues ofN calculated for each year withToptorT= 6 days at
SMOSREX is low. The actual difference between the values ofNis less than 2% and thereforeN remains at a high level. Similarly, using the averagedToptfor the twelve stations of
the SMOSMANIA network instead of their station-specific Topt values causes a difference of less than 4%. The high
accuracy of the result using eitherTopt or a globally
aver-agedT and the apparent insensibility of the retrieval method to changes in Topt are interpreted as an advantage of this
method, as a range of T values may be applied to obtain good estimates of SWIm. However these results may also
lead to the interpretation that this insensitivity shows that the method is not fully adequate.
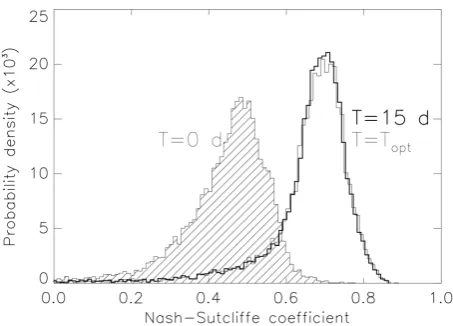
In order to assess the added value of the filter, the scores were calculated forT=0 day, which is the equivalent of a direct replacement of the modelled root-zone soil moisture data with the surface soil moisture observations, without fil-tering. At the SMOSMANIA stations and at SMOSREX, the comparison of the two time series shows high correlations (r2>0.5), except for three stations (LHS, MTM, LZC). It is interesting to note that for these stations, the filter scoreN (Table 2) is rather low, also. This is not a general rule: al-thoughN is low for SBR, the 5 cm vs. 30 cm correlation is high (r2=0.66).
Regarding the correlation between the surface soil mois-ture and deeper layers simulated by ISBA, a number of fac-tors (soil texture, vegetation coverage, time) were investi-gated by Calvet and Noilhan (2000). A decoupling be-tween the two layers may occur for low vegetation cover-age (favouring direct soil evaporation). The decoupling is more pronounced before dusk, and for sandy soils. Fig-ure 12 shows the distribution of SIMN values forT=Topt,
T=0 day, and T=15 days (i.e. the median Topt value) over
Fig. 8. Results of the recursive formulation of the exponential filter over a SIM grid cell (chosen among the 9258 pixels of the SIM database) for a 2-year period (2003–2004): SWIm[-] derived fromwg[-] (scaled surface soil moisture simulations, dashed line) and the reference
root-zone soil water content,w2[-], simulated by SIM (scaled root zone soil moisture simulations, solid line).
Fig. 9. Optimised characteristic time length of the recursive formulation of the exponential filter (Topt) for reference scaled root-zone soil moisture (left) observations at individual depths of the SMOSREX soil moisture profile (from 10 to 90 cm), (right) integrated profile observations of SMOSREX (full circles) and simulations of SIM (open circles) for various soil thicknesses. In the case of SIM, averageTopt values are plotted.
and forT=Topt. Indeed, the soil thickness (the main driver of
Topt, as discussed in Sect. 4.2) used in SIM is predominantly
(65%) distributed between 1.35 m and 1.65 m. The compari-son of the simulated surface vs. deep scaled soil moisture (i.e. T=0 day) shows that surface values may be fair estimates of root-zone values: N >0.5 for 32% of the grid cells. On the other hand, good estimates (N >0.7) are never achieved with this method. ForT=15 days, the proportions of fair and good estimates reach 49% and 37%, respectively. An attempt (not shown) was made to assess the SIMN values forT=6 days, i.e. for the medianToptfor SMOSMANIA and SMOSREX.
The proportions of fair and good estimates reach 56% and 29%, respectively. This shows that while the proportion of good estimates is sensitive toT, the proportion of acceptable estimates (either fair or good) does not vary much withT (86% and 85% forT=15 days andT=6 days, respectively).
6 Conclusions
In this paper, the use of an exponential filter to retrieve the scaled root-zone soil moisture (SWIm)from surface soil
moisture observations or simulations, was assessed using modelled and real data over France. The recursive formu-lation of the exponential filter was implemented as it reduced computational time and eliminated the need to store and re-process long data records (all data in the interval [tn−3T,
tn]) each time a new observation was available. Generally,
the use of this method was satisfactory, after the character-istic time length of the filter (T) was optimised (Topt). The
main features of the seasonal and interannual variability of SWImwere captured by the filtering method.
Combining the rich SMOSMANIA and SMOSREX in situ data sets with synthetic data from land surface simulations over France, the impact of different factors on the single pa-rameter of this approach (Topt) could be assessed:
– Toptwas found to vary with the soil depth (soil
thick-ness) at (over) which SWImwas considered.
– No clear link betweenToptand soil and climate
proper-ties was found.
– The exponential filter was not very sensitive to interan-nual or spatial variations ofTopt, and the application of
a constant average value ofT did not significantly affect the quality of the retrievals.
[image:13.595.114.483.201.322.2]Fig. 10. Results of the recursive formulation of the exponential filter over the SIM domain for a 2-year period: mean clay and sand fraction versus the optimised characteristic time length of the exponential filter (Topt) for the most frequent thickness of the root-zone soil layer of SIM (1.50 m±0.05 m). The error bars correspond to the standard deviation.
Fig. 11. Results of the recursive formulation of the exponential filter over the SIM domain for a 2-year period: average optimised char-acteristic time length of the exponential filter (Topt) along a South-North transect from the Rhˆone valley to the Saˆone plain. Binned values are presented each 50 km for the most frequent thickness of the root-zone soil layer of SIM (1.50 m±0.05 m) and the most fre-quent fraction of clay (12 to 21%). The vertical bars indicate the standard deviation of the binnedTopt.
the discussed method relies solely on surface soil moisture estimates. As surface soil moisture can be observed from space by remote sensing techniques, the performance of the exponential filter is particularly interesting in areas with at-mospheric information of poor quality.
Acknowledgements. The development of the SMOSMANIA
net-work was co-funded by M´et´eo-France, CNES, and ESA. The net-work of C. Albergel and C. R¨udiger at CNRM was supported by CNES. The authors want to acknowledge the contribution of a number of M´et´eo-France colleagues to SMOSMANIA: P. Gr´egoire, M. Leroy, J. L. Ajas, F. Baillet, Y. Balaguer, D. Bettinelli, J. Y. Caillaud, P. Caseau, C. Genevier, P. G´erard, G. Hertz, C. Izard, P. L´eon, J. C. Maillard, D. Malet, J. L. Marino, G. Moreau, J. Poitevin, P. Salvetat, P. Taurel, and R. Voirin. The authors thank A. Chanzy (INRA) for fruitful discussion. The SMOSREX project was
co-Fig. 12. Performance of the recursive formulation of the exponen-tial filter over France based on modelled soil moisture (SIM) for a 2-year period: statistical distribution of the Nash-Sutcliffe coefficient
Nof the SWImderived fromwg(scaled surface soil moisture
sim-ulations), for different values of the characteristic time length (T) of the filter, optimised valueTopt, single median value of 15 days, andT=0 day. Note that positive values ofNare presented, only.
founded by the “Programme National de T´el´ed´etection Spatiale” and by the “Programme Terre, Oc´ean, Surfaces Continentales et Atmosph`ere (CNES)”, and by participants to the experiment: CES-BIO (CNES, CNRS, IRD, UPS), CNRM/GAME (M´et´eo-France, CNRS), INRA, and ONERA.
Edited by: N. Verhoest
References
Boone, A., Calvet, J.-C., and Noilhan, J.: Inclusion of a third soil layer in a land surface scheme using the force-restore method, J. Appl. Meteorol., 38, 1611–1630, 1999.
[image:14.595.314.541.250.413.2] [image:14.595.53.281.251.417.2]Calvet, J.-C., Fritz, N., Froissard, F., Suquia, D., Petitpa, A., and Piguet, B.: In situ soil moisture observations for the CAL/VAL of SMOS: the SMOSMANIA network, International Geoscience and Remote Sensing Symposium, IGARSS, Barcelona, Spain, 23–28 July 2007, 1196–1199, doi:10.1109/IGARSS.2007.4423019, 2007.
Ceballos, A., Scipal, K., Wagner, W., and Martinez-Fernandez, J.: Validation of ERS scatterometer derived soil moisture data in the central part of the Duero Basin, Spain, Hydrol. Process., 25(19), 1549–1566, 2005.
De Rosnay, P., Calvet, J.-C., Kerr, Y., Wigneron, J.-P., Lemaˆıtre, F., Escorihuela, M.J., Mu˜noz Sabater, J., Saleh, K., Barrie, J., Coret, L., Cherel, G., Dedieu G., Durbe, R.., Fritz, N., Frois-sard, F., Kruszewski, A., Lavenu, F., Suquia, D., and Wald-teufel, P.: SMOSREX: A long term field campaign experiment for soil moisture and land surface processes remote sensing, Re-mote Sens. Environ., 102, 377-389, 2006.
Durand, Y., Brun, E., Merindol, L., Guyomarc’h, G., Lesaffre, B., and Martin, E.: A meteorological estimation of relevant parame-ters for snow models, Ann. Glaciol., 18, 65–71, 1993.
Entekhabi, D., Nakamura, H., and Njoku, E. G.: Solving the Inverse problem for soil moisture and temperature profiles by sequen-tial assimilation of multifrequency remotely sensed observations, IEEE T. Geosci. Remote, 32, 438–448, 1994.
Escorihuela, M. J, de Rosnay, P., Kerr, Y., and Calvet, J.-C.: In-fluence of bound water relaxation frequency on soil moisture measurements, IEEE T. Geosci. Remote, 45(12), 4067–4076, doi:10.1109/TGRS.2007.906090, 2007.
Habets, F., Ducrocq, V., and Noilhan, J.: Pr´evisions hydrologiques et ´echelles spatiales: l’exemple des mod`eles op´erationnels de M´et´eo-France, C. R. Geosci., 337, 181–192, 2005.
Habets, F., Boone, A., Champeaux, J.-L., Etchevers, P., Franchis-teguy, L., Leblois, E., Ledoux, E., Le Moigne, P., Martin, E., Morel, S., Noilhan, J., Quintana-Segu´ı, P., Rousset-Regimbeau, F., and Viennot, P.: The SAFRAN-ISBA-MODCOU hydrome-teorological model applied over France, J. Geophys. Res., 113, D06113, doi:10.1029/2007JD008548, 2008.
Houser, P. R., Shuttleworth, W. J., Famiglietti, J. S., Gupta, H. V., Syed, K. H., and Goodrich, D. C.: Integration of Soil Moisture Remote Sensing and Hydrologic Modelling Using Data Assimi-lation, Water Resour. Res., 34(12), 3405–3420, 1998.
Jackson, T. J.: Profile soil moisture from space measurements, J. Irrig. Drain. E.-ASCE, 106, 81–92, 1980.
Jackson, T. J.: Soil water modelling and remote sensing, IEEE T. Geosci. Remote, GE-24, 37–46, 1986.
Kerr, Y., Waldteufel, P., Wigneron, J.-P., Martinuzzi, J.-M., Font, J., and Berger, M.: Soil Moisture retrieval from space: the Soil Moisture and Ocean Salinity (SMOS) mission, IEEE T. Geosci. Remote, 39, 1729–1736, 2001.
Kerr, Y.: Soil moisture from space: Where are we? Hydrogeol. J., 15, 117–120, 2007.
Masson, V., Champeaux, J.-L., Chauvin, F., Meriguet, C., and La-caze, R.: A global database of land surface parameters at 1 km resolution in meteorological and climate models, J. Climate, 9, 1261–1282, 2003.
Nash, J. and Sutcliffe, J.: River flow forecasting through conceptual models, part Ii – a discussion and principles, J. Hydrol., 10, 282– 290, 1970.
Noilhan, J. and Planton, S.: A simple parameterisation of Land
Sur-face Processes for meteorological model, Mon. Weather Rev., 117, 356–549, 1989.
Noilhan, J. and Mahfouf, J.-F.: The ISBA land surface parameteri-sation scheme, Global Planet. Change, 13, 145–149, 1996. Pellarin, T., Calvet, J.-C., and Wagner, W.: Evaluation of ERS
scatterometer soil moisture products over a half-degree re-gion in southwestern France, Geophys. Res. Lett., 33, L17401, doi:10.1029/2006GL027231, 2006.
Quintana-Segui, P., Lemoigne, P., Durand, Y., Martin, E., Habets, F., Baillon, M., Canellas, C., Franchisteguy, L., and Morel, S.: Analysis of near surface atmospheric variables: Validation of the SAFRAN analysis over France, J. Appl. Meteorol. Clim., 47, 92– 107, 2008.
Ragab, R.: Towards a continuous operational system to estimate the root-zone soil moisture from intermittent remotely sensed sur-face soil moisture, J. Hydrol., 173, 1–4, 1–25, 1995.
Robinson, D. A., Campbell, C. S., Hopmans, J. W., Hornbuckle, B. K., Jones, S. B., Knight, R., Ogden, F., Selker, J., and Wen-droth, O.: Soil moisture measurement for ecological and hydro-logical watershed-scale observatories: a review, Vadose Zone J., 7, 358–389, doi:10.2136/vzj2007.0143, 2008.
R¨udiger, C., Calvet, J.-C., Gruhier, C., Holmes, T., De Jeu, R., and Wagner, W.: An intercomparison of ERS-Scat and AMSR-E soil moisture observations with model simulations over France, J. Hydrometeorol., in press, 2008.
Sabater, J. M., Jarlan, L., Calvet, J.-C., Bouyssel, F., and De Rosnay, P.: From near surface to root zone soil moisture using different assimilation techniques, J. Hydrometeorol., 8, 94–206, 2007. Schmugge, T. J.: Remote Sensing of Soil Moisture: Recent
Ad-vances, IEEE T. Geosci. Remote, GE21, 145–146, 1983. Stroud, P. D.: A recursive exponential filter for time-sensitive data,
Los Alamos national Laboratory, LAUR-99-5573, available at: public.lanl.gov/stroud/ExpFilter/ExpFilter995573.pdf, (last ac-cess July 2008) 1999.
Troen, I. and Petersen, E. L.: European Wind Atlas, ISBN 87-550-1482-8, Risbø National Laboratory, Roskilde, 656 pp., 1989. Wagner, W.: Soil moisture retrieval from ERS scatterometer data,
Ph.D. thesis, University of Technology, Vienna, 101 pp., 1998. Wagner, W., Lemoine, G., and Rott, H.: A method for
estimat-ing soil moisture from ERS scatterometer and soil data, Remote Sens. Environ., 70, 191–207, 1999.
Wagner, W., Scipal, K., Pathe, C., Gerten, D., Lutch W., and Rudolph, B.: Evaluation of the agreement between the first global remotely sensed soil moisture data with model and precipitation data, J. Geophys. Res.-Atmos., 108(19), 4611, doi:10.1029/2003JD003663, 2003.
Walker, J. P., Willgoose, G. R., and Kalma, J. D.: One-dimensional soil moisture profile retrieval by assimilation of near-surface measurements: A simplified soil moisture model and field ap-plication, J. Hydrometeorol., 2, 356–373, 2001a.
Walker, J. P., Willgoose, G. R., and Kalma, J. D.: One-dimensional soil moisture profile retrieval by assimilation of near-surface ob-servations: a comparison of retrieval algorithms, Adv. Water Re-sour., 24(6), 631–650, 2001b.


![Fig. 4. Soil water index (SWIm [-]) at 30 cm derived from wg [-] (scaled surface soil moisture observations at 5 cm, large dots) and w2 [-](scaled soil moisture observations at 30 cm, small dots), for the 12 stations of SMOSMANIA over a 14 month period](https://thumb-us.123doks.com/thumbv2/123dok_us/9265606.996012/9.595.50.547.64.390/derived-surface-moisture-observations-moisture-observations-stations-smosmania.webp)
![Fig. 6. Soil water index (SWIm [-]) at 30 cm derived from wg [-] (scaled surface soil moisture observations at 0–6 cm, solid line) and w2 [-](scaled soil moisture observations at 30 cm, dashed line), for the SMOSREX station over a 7 year period (from Janua](https://thumb-us.123doks.com/thumbv2/123dok_us/9265606.996012/11.595.100.497.64.187/derived-surface-moisture-observations-moisture-observations-smosrex-station.webp)
![Fig. 8. Results of the recursive formulation of the exponential filter over a SIM grid cell (chosen among the 9258 pixels of the SIM database)root-zone soil water content,for a 2-year period (2003–2004): SWIm [-] derived from wg [-] (scaled surface soil moisture simulations, dashed line) and the reference w2 [-], simulated by SIM (scaled root zone soil moisture simulations, solid line).](https://thumb-us.123doks.com/thumbv2/123dok_us/9265606.996012/13.595.114.483.201.322/recursive-formulation-exponential-simulations-reference-simulated-moisture-simulations.webp)