Journal of Chemical and Pharmaceutical Research, 2013, 5(5):1-11
Research Article
ISSN : 0975-7384
CODEN(USA) : JCPRC5
UV-Spectrophotometry and RP-HPLC methods for the simultaneous
estimation of acetaminophen: Validation, comparison and application for
marketed tablet analysis in South West, Nigeria
1
Adewuyi Gregory
Olufemi and *
2Ogunneye Adeyemi Lawrence
1
Department of Chemistry, University of Ibadan, Ibadan, Nigeria
2
Department of Chemistry, Tai Solarin University of Education, Ijagun, Ogun State, Nigeria
_____________________________________________________________________________________________ABSTRACT
In the present study UV-Spectrophotometry and RP-HPLC methods were validated for the simultaneous analysis of acetaminophen in marketed tablets. The methods were validated in terms of linearity, sensitivity (Detection limit and Quantification limit) accuracy (% Recovery), precision (inter day, intraday and reproducibility). Both the methods were linear (r2 = 0.9993 for UV method and 0.9995 for HPLC) and accurate (% recovery was 99.48 % - 101.42 % for UV method and 101.85 % - 102.35 % for HPLC method). The detection limit and quantification limit were 0.192 µg/ml and 0.640 µg/ml for UV method and 0.0155 µg/ml and 0.0518 µg/ml. The method was also found precise (% RSD < 5%) and robust. Assay of five marketed brands of paracetamol were determined by both the methods and no statistically significant difference was noticed between the assay obtained from UV-Spectrophotometry and RP-HPLC methods by paired t - test at 5 % significance level. The results obtained from the mean percentage analysis of paracetamol tablets (%) containing 500 mg of acetaminophen shows that the mean percentage determined in three replicate analyses is more than the claimed amount by the manufacturers. The two methods were found to be linear, quantitative, reproducible and could be used as a more convenient, efficient and economical method for the trace analysis of drug in raw material, tablets and in biological fluids.
Keywords: Paracetamol, Acetaminophen, Tablets, Reverse phase High Performance Liquid Chromatography,
Validation studies, Spectrophotometry, South West Nigeria
_____________________________________________________________________________________________
INTRODUCTION
dosage forms: tablet, capsules, drops, elixirs, suspensions and suppositories [23]. The drug is official in different pharmacopoeia [25], [3].
Many methods for its determination have been described in literature, including chromatography (RP - HPLC) [12], [6], [19], [22], chemometric-assisted spectrophotometric [26], spectroscopy [9], [13], [18], Spectrophotometry [2], titrimetry [14] and electrochemistry [1]. In the standard method, paracetamol is determined titrimetrically with Ce (IV) in acidic medium, using ferroin as indicator. The titration is performed in cold conditions and hence the estimation takes long time with limited accuracy [4]. Thus, this method is what is commonly used by most of the pharmaceutical company in Nigeria and this method is tedious, troublesome, time wasting and not even accurate though it might be economical. Hence a quicker and accurate method is needed.
Thus, in the present study, the method of quantitative determination of paracetamol using UV Spectrophotometry is based on Griess reaction. Diazotization of aromatic amine and coupling the product with phenols or aromatic amines is a famous Griess reaction which has been extensively used to estimate nitrate in water, soil, vegetables, meat products etc [7]. Surprisingly very little work has been done to estimate paracetamol using Griess reaction. The following Griess reaction mechanism is assumed to be followed during the present study.
NHCOCH3
OH
Reflux
NH3
OH
Paracetamol P-aminophenol
Step 1
Step 2
NH3
OH
P-aminophenol
NN-Cl
-OH
NaNO2/HCl
Diazonium salt
Step 3: Resorcinol as coupling agent
NN-Cl
-OH
Diazonium salt
+
OH
OH
Resorcinol
OH
HO
OH
Azo dye H+,H20
N=N
Fig1: Reaction of Paracetamol with resorcinol
In this study, we have validated UV spectroscopic method, we also validated RP-HPLC method by using simple solvent and compare these two methods by paired t test. The proposed methods were validated for the parameters like linearity, accuracy and precision as per ICH guidelines [8].
EXPERIMENTAL SECTION
Chemicals and reagents
Acetaminophen reference standard and Sulphamethoxazole internal standard were obtained from Sigma – Aldrich (Milan, Italy), methanol (HPLC grade), orthophosphoric acid, sodium nitrite, ammonium sulphamate, resorcinol, Sodium Hydroxide and Hydrochloric acid were all obtained from Merck Ltd (Darmstadt, Germany). All reagents are of high analytical grade. Deionized, double distilled water was used for all solutions and mobile phase preparation. Marketed paracetamol tablets containing acetaminophen (500 mg) were purchased from local drug store across the south west zone of Nigeria after checking their manufacturing licence number, batch number, production and expiry date which was then labeled as shown in Table 1.
Table 1: Sample Labeling by Location
Location Sample code
Lagos PT-1 Lagos PT-2 Oyo PT-3 Kwara PT-4 Ogun PT-5
Validation of HPLC method
Equipment
An isocratic HPLC (“CECIL ADEPT SYDTEM 4200”) with pump , UV/VIS-1000 was used. The analytical column (C18) was stainless column (150 cm x 4.6 mm, 5 µm particle size) packed with reversed-phase “Hypersil Gold” aQ, a manual injector with a 20 µl loop was used for the injection of sample solution and the mobile phase.
Preparation of standard solutions
Stock solutions of acetaminophen (20 mg/100ml) were prepared in methanol. A stock solution of internal standard Sulphamethoxazole (40 mg/100ml) was also prepared in methanol. The two solutions were filtered through a 0.45 µm membrane following sonication for about 30 seconds before use [22].
Preparation of mobile phase and Chromatographic conditions
The mobile phase was prepared by adding 330 ml of methanol to 660 ml of the dimineralized water. The pH of this mixture was adjusted to pH of 3.0 with 20 % v/v orthophosphoric acid. The mobile phase was filtered through a Millipore 0.45 µm membrane and the degassed. Isocratic elution was applied at ambient temperature and a flow rate of 1.00 ml/mins and the pressure range from 21-22 mPa. The detector was set to the wavelength of 230 nm.
Calibration curve
Accurately pipette volumes of 0.5, 0.75, 1.0, 1.25 and 1.5 ml of the acetaminophen stock was placed in 10ml volumetric flasks and 1 ml of the internal standard stock solution was added to each flask. Following the addition of mobile phase to volume, these solutions were filtered through a 0.45 µm membrane before use. 20 µl of each solution were injected into the column. The five concentrations of the compound were subjected to regression analysis and the slope and intercept were calculated.
Assay of Paracetamol Tablets (Samples)
Validation of UV method Equipment
A JENWAY- SPEC/6400, 520 ×330 × 180 mm :Rs 232 output, band width of 5 nm Scanning Visible Spectrophotometer with recording unit and matched set of 1 cm. glass or quartz cuvettes was used for recording the spectra.
All the weighing measurements were made by a Shimadzu-AUX-220 model digital electronic balance.
Preparation of Standard Stock Solution
Accurately 250 mg of pure authentic sample (standard) of paracetamol was weighed out and then refluxed with 20 ml of 4 M Hcl with 30 ml of distilled deionised water for about 30 minutes to prepare a standard solution. The content was appropriately diluted and required aliquots were taken for preparation of calibration curve.
Calibration Curve
Accurately pipetted volumes of 2 ml, 4 ml, 6 ml, 8 ml and 10 ml respectively of the acetaminophen stock were taken in 25 ml volumetric flasks. To this aliquot, 0.6 ml of 4 M Hcl and 1 ml of 0.1 % w/v solution of sodium nitrite were added for diazotization. 1 ml of 0.5 % w/v solution of ammonium sulphamate was added after 3 minutes to destroy excess nitrous acid and then left for 2 minutes. Then, 1.5 ml of 0.55 w/v solution of resorcinol in 4 M sodium hydroxide was added as coupling agent. The absorbance of this azo dye was measured at 505 nm [5].
Assay of Paracetamol Tablets (Samples)
Ten tablets of paracetamol of each pharmaceutical firm under study were weighed and ground to a fine powder. From this, a sample of 250 mg of paracetamol was weighed out and exactly same process for hydrolysis and colour development was carried out as was carried out for standard. Absorbance was measured at appropriate wavelength and paracetamol was estimated from calibration curve.
Statistical Analysis
The values were expressed as mean ± SEM (Standard Error Measure). The Pearson values (p < 0.05) were considered significant using Statistical Package for Social Sciences (SPSS) version 18.
Validation Procedure
The study was conducted to obtain an affordable and convenient method for HPLC and Spectrophotometry determination of acetaminophen in marketed tablets. The experiment carried out according to the official specifications of Global Quality Guidelines -2002[10] and international conference on harmonization [8]. The methods validated for the parameters like system suitability, specificity, range and linearity, sensitivity (LOD and LOQ) accuracy and precision.
Accuracy
Accuracy was confirmed by recovery study as per ICH norms at three different concentration levels 75 %, 100 %, 125 % by replicate analysis (n = 3). Here to a preanalysed sample solution, standard drug solutions were added and then percentage of drug content was calculated. The result of accuracy study was reported in Table 4, 5 and 6. From the recovery study it is clear that the method is accurate for quantitative estimation of paracetamol in tablet dosage form as the statistical parameters are within the acceptance range (RSD < 5.0).
Precision
The precision of the method evaluated by determining the intra-day and inter-day CV percentage of the measured concentrations of acetaminophen using the two techniques. The reproducibility (intra-day precision) and repeatability of system (inter-day precision) checked by injecting the different concentrations of standard solution on the same day and different days respectively under the same experimental conditions, which shows in significant variation (Tables 4).
Robustness
Linearity
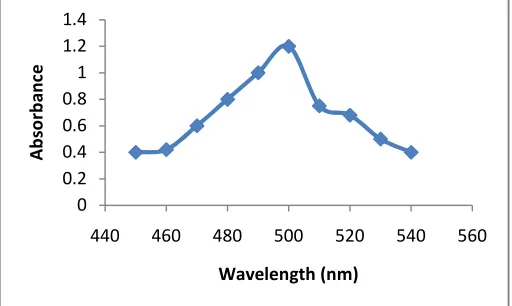
[image:5.595.122.473.179.244.2]Linearity of the methods was determined by constructing calibration curves from the absorbance of standard solutions of acetaminophen and chromatogram of standard solutions of acetaminophen plus internal standard at different concentrations level. The linearity is presented in Table 2 and 3 and Figure 2 and 3 respectively.
Table 2: Results of Regression Analysis, Linearity and Sensitivity from the Absorbance of Standard Solution
Compound Concentration (µg/ml)
Absorbance
Reading ± SD Calibration Line r
2 LOD
(µg/ml) LOQ (µg/ml) Acetaminophen 2 0.348 ± 0.142 y = 0.1579x + 0.0175 0.9993 0.192 0.640
4 0.626 ± 0.052 6 0.967 ± 1.024 8 1.279 ± 0.921 10 1.582 ± 1.142
[image:5.595.124.473.292.355.2]*Data represents 5 replicate analysis of standard solutions. * SD is standard deviation *y=mx+c; where y=absorbance, m=slope, x = concentration (µg/ml) and c = intercept.r2 = regression coefficient
Table 3: Results of Regression Analysis from the Chromatogram of Standard Solutions
Compound Concentration (µg/ml)
AD/A1
± SD
Calibration Line
r2 LOD
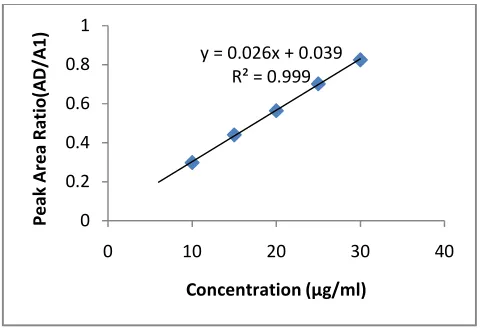
(µg/ml) LOQ (µg/ml) Acetaminophen 10 0.298 ± 0.004 y= 0.0263x + 0.0394 0.9995 0.0155 0.0518
15 0.440 ± 0.007 20 0.564 ± 0.013 25 0.702 ± 0.012 30 0.825 ± 0.010
*Data represents 5 replicate injections of standard solutions. AD/A1……….is the ratio of the integrated area or height of the drug peak at a given
concentration divided by the integrated area or height of internal standard (Sulphamethoxazole) peak at a respective concentration. * SD is standard deviation,*y=mx+c; where y=peak area ratio, m=slope=concentration (µg/ml) and c=intercept.r2=regression coefficient
.
Fig 2: Standard calibration curve obtained from chromatogram of standard solutions using RP-HPLC
y = 0.026x + 0.039 R² = 0.999
0 0.2 0.4 0.6 0.8 1
0 10 20 30 40
Pe
a
k
A
re
a
R
a
ti
o
(A
D
/A
1
)
[image:5.595.177.417.394.559.2].
Fig 3: Standard calibration curve obtained from absorbance of standard solutions using UV-visible Spectrophotometry
System suitability
This test was performed by collection of data from replicated injection of standard or resolution solution (acetaminophen plus Sulphamethoxazole) given in Table 7. The relative standard deviation of the retention times and of the peak areas of acetaminophen from the six consecutive injections of the resolution were evaluated. The mean theoretical plate count for acetaminophen and the resolution between the acetaminophen and the internal standard was also evaluated.
Theoretical plates ( ) = 5.54
/ ……….. (1)
Where
tR = the retention time of the marker peak in the standard solution or analyte peak in the test solution,
Wh / 2 = the peak width at half-height of the marker peak in the standard solution or analyte peak in the test solution.
Resolution ) = ) ……….. (2)
Where
tR1 and tR2 = the retention times of two adjacent peaks 1 and 2, respectively, W1 and W2 = the widths of two adjacent peaks 1 and 2, respectively.
Tailing factor = . ………. (3)
Where
W0.05h = the peak width at 0.05 of the peak height,
d1 = the distance between the perpendicular line passing through the peak maximum and the leading edge of the peak at 0.05 of the peak height.
Sensitivity
The detection limit (DL) and quantification limit (QL) were calculated from the calibration lines that defined linearity, using the Long and winefordner criterion [15] as expressed in Eqs. (1) and (2).
= ×!" ……….. (4)
# = $ ×!" ………. (5)
y = 0.157x + 0.017 R² = 0.999
0 0.2 0.4 0.6 0.8 1 1.2 1.4 1.6 1.8
0 2 4 6 8 10 12
A
b
so
rb
a
n
ce
Where a is the slope of the calibration line and S is the standard deviation of response. The results of the same are shown in Table 2 and 3.
Selectivity
Selectivity was the critical basis for analytical procedure. Chromatographic method was determined to ensure separation of active (acetaminophen) from internal standard in the presence of excipients used in formulation figure 3 and 4.
Comparison of the analytical methods
A comparison procedure was carried out to find significant differences among the mean values obtained using the two techniques. The least significant difference test was employed to determine differences among means at a 5 % significance level. More over paired t-test was also used to compare HPLC and Spectrophotometry techniques. A comparative study was also carried out in terms of linearity from the calibration lines with their respective r2 value, sensitivity by DL and QL, precision through the relative standard deviation values and accuracy through recovery.
RESULTS AND DISCUSSION
Validation of the methods
The two proposed methods were validated through their linearity, sensitivity, precision and accuracy.
Linearity and range
[image:7.595.131.464.480.538.2]Absorbance responses of standard acetaminophen were significantly linear from 2 µg/ml – 10 µg/ml according to the determination coefficient (r2) shown in Table 2. In addition, the residuals are randomly distributed around the line (Figure 2). Therefore the regression model represents the data correctly for the UV method. There is a good relationship between the concentration of standard acetaminophen and the peak area obtained throughout the HPLC method, C18 column with phase of methanol and water (1:2) adjusted to pH 3.0 using orthophosphoric acid as a mobile phase (Table 3). The coefficient of determination (r2) (figure 3) was higher (0.9995) with percentage coefficient of 99.5 % when compared with UV method. On the other hand, similar slopes of the calibration lines were observed between the two methods used i.e. sensitive enough to detect the smallest analyte concentration. However, slope was lower in HPLC method. The consequence of these is that the HPLC method will be more sensitive.
Table 4: Precision results of the UV method and RP-HPLC
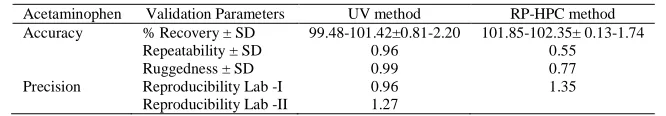
Acetaminophen Validation Parameters UV method RP-HPC method Accuracy % Recovery ± SD 99.48-101.42±0.81-2.20 101.85-102.35± 0.13-1.74
Repeatability ± SD 0.96 0.55 Ruggedness ± SD 0.99 0.77 Precision Reproducibility Lab -I 0.96 1.35
Reproducibility Lab -II 1.27
Detection (DL) and quantification (QL) limits
DL can be defined as the minimum concentration capable of giving a chromatographic/absorbance signal three times higher than background noise. The QL is the lowest amount of analyte in the sample which can be quantitavely determined with precision and accuracy. In addition, the sensitivity of any analytical instrument is also related to the limit of detection because high sensitivity often gives a low limit of detection. The DL and QL obtained for acetaminophen were 0.0155 µg/ml and 0.0518 µg/ml for HPLC while 0.192 µg/ml and 0.640 µg/ml for UV method respectively.
The DL and QL values achieved through the HPLC method were lower, thus they can be considered sensible enough for the analysis of acetaminophen. Although both methods were sensitive enough.
Precision
and different days respectively. All RSD obtained were satisfactory as they were less than 5 %. Thus the two methods may be considered precise for acetaminophen determination (Table 4).
Table 5: Accuracy i.e. recovery data of standard concentration solution of acetaminophen using UV method
Amount Spiked (µg) Found (µg/ml) % Recovery
% Meana
recovery RSD
(%) 75 74.60 99.47 99.48
74.00 98.67 0.81 75.22 100.29
100 103.30 103.30 101.42 98.96 98.96 2.20 102.00 102.00
125 124.42 99.54 100.21 123.78 99.02 1.62 127.58 102.06
[image:8.595.196.399.292.393.2]*RSD is relative standard deviation, a is n=3
Table 6: Accuracy i.e. recovery data of standard concentration solution of acetaminophen using RP-HPLC method
Amount Spiked (µg) Found (µg/ml) % Recovery
% Meana
recovery RSD
(%) 75 77.60 103.47 102.35
77.46 103.28 1.74 75.22 100.29
100 102.25 102.25 102.15 102.20 102.20 0.13 102.00 102.00
125 127.60 102.08 101.85 126.78 101.42 0.37 127.58 102.064
*RSD is relative standard deviation, a is n=3
Absolute recovery
The accuracy of an analytical method was given by the extent by which the value obtained deviates from the true value. In biological samples, the recovery should be ± 10 % and the acceptance criterion for recovery data is 98-102 % or 95 %-105 % for drug preparation [17]. Thus the mean absolute recovery of the methods at 75 µg, 100 µg and 125 µg respectively for both methods were shown in Table 5 and Table 6 respectively. Thus it can be concluded that both methods showed good recovery and therefore said to be accurate.
System suitability
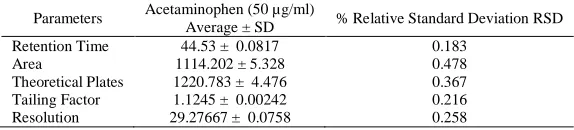
This test was performed by collection of data from replicated injection of standard solutions (acetaminophen plus sulphamethoxazole) given in Table 7. The relative standard deviation of the retention times and of the peak areas of acetaminophen from the six consecutive injections of the resolution were 0.183 % and 0.478 % respectively. The mean theoretical plates count based on the formula in the equation 1 for acetaminophen peak was 1220.783, and the resolution between acetaminophen and Sulphamethoxazole was 29.277 respectively.
Table 7: Results of System Suitability Study of RP-HPLC Method
Parameters Acetaminophen (50 µg/ml)
Average ± SD % Relative Standard Deviation RSD Retention Time 44.53 ± 0.0817 0.183
Area 1114.202 ± 5.328 0.478 Theoretical Plates 1220.783 ± 4.476 0.367 Tailing Factor 1.1245 ± 0.00242 0.216 Resolution 29.27667 ± 0.0758 0.258
Selectivity and specificity
[image:8.595.154.441.586.651.2]Table 8: Comparison of the mean results between HPLC and UV- Spec.
Brand Analyte Label Claimed (mg per tablet) RP-HPLC Method ± RSD UV-Spec. Method ± RSD Paired t-test Sig. (2-tailed) PT-1 518.59 ± 0.41 520.55 ± 0.53 1.13 0.377 PT-2 Acetaminophen 500 mg 518.75 ± 1.48 521.62 ± 1.37 1.81 0.212 PT-3 537.45 ± 0.52 534.74 ± 0.81 0.69 0.559 PT-4 624.35 ± 0.29 633.18 ± 0.67 2.58 0.123 PT-5 537.55 ± 0.42 537.96 ± 0.54 0.10 0.928
At the 0.05 level, the means obtained from the two techniques are not significantly different P>0.05 (2-tailed)
[image:9.595.171.427.556.709.2]Figure 3: Chromatogram of acetaminophen with internal standard from standard solution in mobile phase
Fig 4: Chromatogram of acetaminophen with internal standard from placebo formulation in mobile phase
0 0.2 0.4 0.6 0.8 1 1.2 1.4
440 460 480 500 520 540 560
A
b
so
rb
a
n
ce
Assay of acetaminophen tablets 500 mg
The two methods applied for the determination of acetaminophen content in marketed formulation (tablets 500 mg). The assay results showed that the two methods were sensitive and specific for the quantitative analysis of acetaminophen in raw material and also in dosage form (Table 8).
Comparison of the methods
The results obtained from the assay determination by UV method and RP-HPLC method was compared by paired t Test at 0.05 significance level (Table 8). The P-value was greater than the significance level, indicating that there was no statically significant difference between the two methods.
CONCLUSION
From this validation study we can conclude that the developed UV and RP-HPLC methods are accurate, rapid, precise, reproducible and inexpensive with acceptable correlation co-efficient, RSD (%) and standard deviation. Any one of the methods can be used for simultaneous determination of acetaminophen in pharmaceutical dosage form. Simplicity of sample preparation and use of low cost reagents are the additional benefit of this method. Although the UV method can be routinely used in pharmaceutical laboratory because it is very cheap and the easiest and also require lesser techniques to operate, but the best reliability was achieved by RP-HPLC method, though it is not as cheap as UV method (cost of analysis). So therefore both methods can be used in the quality control department for assay study. On the other hand all the tested brands are found equivalent in respected of assay determination.
REFERENCES
[1]KD, Altricia; NG, Claytonil; M, Hart; RC, Harden; J, Hevizi; JV, Makwana; MJ, Portsmouth; (1994), Chromatographia, vol 39, Pp 180-184
[2] Z,Bouhsain; S,Garrigues; A,Morales-Rubio; M,Guardia; (1996). Anal. Chim. Acta, vol. 33. Pp 59-69 [3] British Pharmacopoeia (2009). CD version 2; The British Pharmacopoeia Commission, London [4] British Pharmacopoeia. (1999). HM Stationary Office, London, Vol.1,Vol.2, Pp 483, Pp 1042- 1043 [5] RS,Buddha; RP,Raja; (2009) J. Nepal Chem. Soc., Vol. 24, Pp 39-44
[6] L,Carnevale; (1983). J. Pharma. Sci.,72, Pp 196-198
[7] LS,Clesceri; AE,Greenberge; AD, Eton; (1998). Standard methods for examination of water and waste water, APHA.
[8] Food and Drug Administration, “International conference on harmonisation ,( 1997) guideline on the validation of analytical procedures: methodology,” Federal Register, vol. 62, no. 96, pp. 27463– 27467
[9] G,Garg; S,Saraf ; S,Saraf; (2007). Indian J. Pharm. Sci. 69(5), 692-694.
[10] Global Quality Guideline (2002) Validation of analytical procedures; Number: G-6.9, Version 1.0. [11] Indian Pharmacopoeia (2007). The Indian pharmacopoeia commission, Ghaziabad, Vol III, Pp 1516. [12] R,Joshi; R,Sharma; (2008). Anal. Lett. 41(18), 3297-3308.
[13] K, Karla; S, Naik; G, Jurmal; N, Mishra; (2009). Asian J. Research Chem. 2(2), 112 - 115. [14] KG, Kumar; R, Letha; (1997). J. Pharm. Biomed. Anal., vol. 15, Pp 1725-1728.
[15] GL, Long, JD Winefordner, (1983). Analytical Chemistry, 55(7), 712-724 [16] Martindale (2007) The complete drug reference, 35th edition, Vol. 2, Pp 3322
[17] Y,Mohammad; I,Gunawan ( 2005) Validation of chromatographic methods of analysis. Profiles of drug substances, excipients, and related methodology, Vol 32.
[18] S Narayan; P,Kumar; R,Sindhu; A,Tiwari; M,Ghosh (2009). Der Pharma Chemica. 1(2), 72-78. [19] S,Sa’sa; A,Rashid, (1984). Talanta, vol. 31. Pp 397-399.
[20] M,Sarg; AD,Gross; A, Roberta, The Cancer Dictionary. Infobase Publishing. ISBN 978081606 4113 (2007). [21] RS, Satoskar; SD, Bandarkar; SS,Ainapare (1999). Pharmacology and Pharmacotherapeutics, Popularprakashan, Mumbai, 16th ed., Pp 164.
[22] S,Suzen; C,Akay; S,Tartilumis; SR, Erdol; A,Onal; S, Cevherogulu, (1998). J. Fac. Pharm. Ankara, vol 27 (2). Pp 93-100.
[23] SC, Sweetman; Martindale, (2005). The complete drug reference, 34th ed., Pharmaceutical Press, London, Pp. 1460-1461.
[24] KD,Tripathi; (2004). Essentials of Medical Pharmacology. Edn 5, Jaypee Brothers Medical Publishers, New Delhi, 2004, Pp. 142, 181 – 182.