Effects of modifier additions on the thermal properties,
chemical durability, oxidation state and structure of iron
phosphate glasses
P.A. Binghama, , , R.J. Handa, O.M. Hannanta, S.D. Forderb, S.H. Kilcoynec
a
Immobilisation Science Laboratory, Department of Engineering Materials, University of Sheffield, Mappin Street, Sheffield S1 3JD, UK
b Materials and Engineering Research Institute, Sheffield Hallam University, Howard Street, Sheffield S1 1WB, UK c
School of Computing, Science and Engineering, University of Salford, Salford, Greater Manchester M5 4WT, UK
Received 17 June 2008; revised 13 March 2009; Available online 17 June 2009.
Abstract
Modified iron phosphate glasses have been prepared with nominal molar compositions [(1−x)·(0.6P2O5–
0.4Fe2O3)]·xRySO4, where x = 0–0.5 in increments of 0.1 and R = Li, Na, K, Mg, Ca, Ba, or Pb and y = 1 or 2. In most
cases the vast majority or all of the sulfate volatalizes and quarternary P2O5–Fe2O3–FeO–RyOz glasses or partially
crystalline materials are formed. Here we have characterized the structure, thermal properties, chemical durability and redox state of these materials. Raman spectroscopy indicates that increasing modifier oxide additions result in
depolymerization of the phosphate network such that the average value of i, the number of bridging oxygens per –(PO4)–
tetrahedron, and expressed as Qi, decreases. Differences have been observed between the structural effects of different modifier types but these are secondary to the amount of modifier added. Alkali additions have little effect on density; slightly increasing Tg and Td; increasing α and Tliq; and promoting bulk crystallization at temperatures of 600–700 °C.
Additions of divalent cations increase density, α, Tg, Td, Tliq and promote bulk crystallization at temperatures of 700–800
°C. Overall the addition of divalent cations has a less deleterious effect on glass stability than alkali additions. 57Fe
Mössbauer spectroscopy confirms that iron is present as Fe2+ and Fe3+ ions which primarily occupy distorted octahedral sites. This is consistent with accepted structural models for iron phosphate glasses. The iron redox ratio, Fe2+/ΣFe, has a
value of 0.13–0.29 for the glasses studied. The base glass exhibits a very low aqueous leach rate when measured by Product Consistency Test B, a standard durability test for nuclear waste glasses. The addition of high quantities of alkali oxide (30–40 mol% R2O) to the base glass increases leach rates, but only to levels comparable with those measured for
a commercial soda-lime-silica glass and for a surrogate nuclear waste-loaded borosilicate glass. Divalent cation
additions decrease aqueous leach rates and large additions (30–50 mol% RO) provide exceptionally low leach rates that are 2–3 orders of magnitude lower than have been measured for the surrogate waste-loaded borosilicate glass. The P2O5–Fe2O3–FeO–BaO glasses reported here show particular promise as they are ultra-durable, thermally stable,
low-melting glasses with a large glass-forming compositional range.
PACS: 61.43.Fs; 65.60.+a; 76.80.+y; 63.50.−x
Keywords: Chemical durability; Composition; Nuclear and chemical wastes; Optical properties; Raman spectroscopy; Oxide glasses; Phosphates
1. Introduction
Alkali borosilicate glasses are currently the global material of choice for the safe immobilization of high-level radioactive waste (HLW) which is highly radioactive and heat-generating. Silicate glasses are also the obvious host matrix for the vitrification of toxic incinerator ashes given that these wastes are usually rich in SiO2. Phosphate glasses by comparison
phosphate glasses by vitrification of phosphate-rich sludges from the fabricated metal products industry has also recently been investigated [6] and [7].
Sodium aluminophosphate glasses can, in some cases, provide advantages over alkali borosilicate glasses. These advantages include lower melting temperatures and higher waste loading capacities. However, phosphate glasses are generally more corrosive towards refractory melter linings and have relatively low thermal stabilities [2] and [3] although recent work has demonstrated that small additions of B2O3 to sodium aluminophosphate [8] and SiO2, Al2O3 or B2O3 to
iron phosphate [9] and [10]glass compositions can substantially improve their thermal stability. Thermal stability is important because the incorporation of heat-generating wastes and/or the presence of high temperatures in underground repositories can cause glasses with low thermal stabilities to crystallize, which can in turn lead to volume changes and may impair the chemical durability and mechanical performance of the waste form. Published research into phosphate glasses for waste immobilization focussed largely on lead–iron phosphate glasses during the 1980s [1], [2] and [3]. However, concerns remain regarding lead–iron phosphate glasses in terms of their corrosivity during melting, thermal stability and their chemical durability [3].
Iron phosphate glasses have been studied for their potential waste immobilization applications since the mid-1990s [2]. A substantial proportion of this research has dealt with formulations based on the ternary P2O5–Fe2O3–FeO system, and
particularly around the familiar 60P2O5–40Fe2O3 (mol%) composition and derivatives there of. Due to the often complex
chemical nature of waste-loaded glasses it can be useful to simplify their compositions in order to study individual components and their effects on properties and structure. These data can provide useful information and around which specific experiments involving actual radioactive wastes or simulants may be based. Several published studies deal with P2O5–Fe2O3–FeO–RxOy glasses, for which R = Na [11], [12], [13], [14] , [15], [16], [17], [18], [19], [20] and [21],
K [19] and [22], Cs [16], [17], [23], [24] and [25], Ca [16], [26] and [27], Sr [17], [24] and [28], Ba [29], [30] and [31], Zn [20], [32] and [33], Pb [1], [2] and [3], Al [10], [13] and [21], B [9] and [10] and Si [10]. Despite this apparent depth of information there exists little published data which allows direct comparisons to be made between the effects of different types and different contents of modifier cations upon the properties of the resulting materials. Nor have the effects of components less commonly associated with ‘legacy’ nuclear wastes or with HLW been researched in any great depth. Documented glass formation, structure and property information for these systems is therefore far from comprehensive.
Recently we have studied glass formation and the solubility of SO3 in 60P2O5–40Fe2O3 (mol%) glasses to which have
been added oxides of monovalent (Li, Na, and K) and divalent (Mg, Ca, Ba, and Pb) cations. These oxides were supplied to the glasses through the use of sulfate batch materials. This has allowed assessments of the glass formation region (for glasses cooled in air on a 200 g scale) and sulfate solubility [34] and some effects of batch sulfate on iron
redox [35] in these materials. With few exceptions, low levels (<0.5 mol%) of sulfate remained in the resulting glassy or crystalline materials. Consequently these materials may be essentially regarded as occupying the P2O5–Fe2O3–FeO–
RxOy system. The research described in the present paper further describes our ongoing studies into the effects of doping iron phosphate glasses with RxOy, where R = selected R+, R2+, R3+ and R4+ cations, and their effects upon properties and structure. Primarily our motivation is the development and understanding of new glasses with potential applications in radioactive or toxic waste immobilization; however, the information that we have generated may also prove useful to those researching the use of iron phosphate glasses in other applications.
2. Experimental procedures
Glasses have been prepared from analytical grade >99 % purity NH4H2PO4, Fe2O3, Li2SO4, Na2SO4, Na2CO3, K2SO4,
MgSO4, CaSO4, BaSO4 and [PbO + (NH4)2SO4]. Batches to produce 200 g of glass with nominal molar composition
[(1−x)·(0.6P2O5–0.4Fe2O3)]·xR2SO4, where x = 0–0.5, were placed in mullite (3Al2O3·2SiO2) crucibles and heated
overnight to 1030 °C. Crucibles were then transferred to a furnace at 1150 °C and held at this temperature for 1 h. Melts were stirred at ∼60 rpm at 1150 °C for a further 2 h using Al2O3 stirrers. Samples were finally poured into preheated steel
molds, held at 450–475 °C for 1 h to relieve internal stresses, and cooled to room temperature at 1 °C/min. A glass of nominal composition 60P2O5–40Fe2O3 (mol%), named PFe1M, has been used as the baseline glass. Sample name
nomenclature is as follows: modifier added, and oxide quantity in mol%. Hence sample Ba30S was batched to produce a sample containing 30 mol% BaSO4 such that nominal molar composition was 42P2O5–28Fe2O3–30BaSO4. Given that
close to 42P2O5–28Fe2O3–30BaO. Material bulk compositions have been analyzed previously [34] and [35] and confirm
this assertion, although some SO3 and SiO2 and Al2O3 arising from crucible corrosion have been measured in most
samples. Nevertheless the (generally) low levels of contamination of the samples described in this paper means that they may be considered to occupy the P2O5–Fe2O3–FeO–RxOy system. Nominal and analyzed compositions are included
again here for completeness. One sample, Na20, was prepared using Na2CO3 rather than Na2SO4, in order to assess
[image:3.595.53.543.200.786.2]any effects upon final glass redox of using sulfate raw materials. Its final composition, shown in Table 1, is very close to that of its companion glass, Na20S.
Table 1. Nominal and analyzed composition and measured properties for [(1−x)·(0.6P2O5–0.4Fe2O3)]·xR2O glasses.
Sample name
PFe1 M
Li10S Li20S Na10S Na20S Na20 Na30S Na40S K10S K20S K30S K40S
P2O5 mol%
(analyzed) 60.0 (60.9) 49.08 (52.8) 40.00 (47.8) 49.08 (53.4) 40.00 (44.8) 48.0 (44.6) 32.30 (37.1) 28.57 (30.8) 49.08 (53.4) 40.00 (45.8) 32.30 (40.0) 25.71 (32.6) Fe2O3 mol
%
(analyzed) 40.0
(38.0) 32.72 (32.3) 26.66 (28.8) 32.72 (32.2) 26.66 (27.1) (27.6) 32.0 21.54 (23.3) 17.14 (18.8) 32.72 (33.3) 26.66 (28.3) 21.54 (24.9) 17.14 (22.2)
SiO2 mol%
(analyzed) 0 (0.5) 0 (1.1) 0 (2.3) 0 (0.4) 0 (3.2) 0 (3.1) 0 (4.8) 0 (7.2) 0 (0.8) 0 (3.6) 0 (2.8) 0 (4.2) Al2O3 mol%
(analyzed) 0 (0.6) 0 (1.1) 0 (1.5) 0 (0.7) 0 (2.4) 0 (2.6) 0 (4.4) 0 (5.5) 0 (0.8) 0 (2.8) 0 (2.6) 0 (2.5) Li2O mol%
(analyzed) 0 (n/ma )
9.10
(10.3) 16.67 (18.0) 0 (n/ma) 0 (n/ma) 0 (n/ma )
0
(n/ma) 0 (n/m
a
) 0
(n/ma) 0 (n/ma) 0 (n/ma) 0 (n/m
a
)
Na2O mol%
(analyzed) 0 (0) 0 (1.9) 0 (1.3) 9.10 (12.9) 16.67 (22.1) 20.0 (21.5) 23.08 (29.7) 28.57 (36.9) 0 (1.9) 0 (1.2) 0 (1.8) 0 (1.7) K2O mol%
(analyzed) 0 (0) 0 (0.3) 0 (0.2) 0 (0.2) 0 (0.3) 0 (0.6) 0 (0.6) 0 (0.5) 9.10 (9.7) 16.67 (18.2) 23.08 (27.6) 28.57 (35.6) SO3 equiv.
mol% (analyzed) 0 (n/ma ) 9.10 (0.130 )
16.67 9.10 (0.038 )
16.67 (0.055 )
0 (0) 23.08 (0.058 )
28.57 (0.400) 9.10 (0.070 ) 16.67 (0.108 ) 23.08 (0.343 ) 28.57 (1.2) (0.068) Phase/s identified Am
b Amb LiFe(P 2O7
) Am
b Amb n/ma Amb Na
3Fe2(PO4) 3
Amb Amb Amb Unident
. phase/s Fe7(PO4)6
ρ ± 0.005/g
cm−3 2.988 3.079 3.085 3.096 3.113 n/m
a
3.096 3.009 3.031 2.964 2.977 2.897
Vm ± 1
(cm3 mol-1) 49.59 43.18 39.93 44.05 40.24 n/m
a 37.55 35.67 46.40 44.94 43.09 42.23
(α50–300 ×
10-7)±2/ °C 68 92 105 90 120 n/m
a 136 155 93 109 145 n/ma
Dilat. mid-point Tg±2/
°C
505 485 487 503 491 n/ma 497 482 519 526 506 n/ma
Dilat. Td ±
2/ °C 534 501 506 527 513 n/m
a
513 503 543 552 532 n/ma
DTA mid-point Tg ± 2/
°C
500 508 n/ma 518 526 n/ma 525 n/ma 529 537 532 n/ma
DTA onset Tr ±
2/ °C
612 588 n/ma 638 642 n/ma 555 n/ma 642 657 588 n/ma
DTA (Tr−Tg)
± 4/ °C 128 98 n/m
a 127 120 n/ma 55 n/ma 121 132 67 n/ma
DTA Tliq ±
2/°C 950 992 n/m
a 1014 1022 n/ma 920 n/ma 1031 1065 937 n/ma
Mössbauer Fe2+/ΣFe ±
0.02
Sample name
PFe1 M
Li10S Li20S Na10S Na20S Na20 Na30S Na40S K10S K20S K30S K40S
Mössbauer CS (Fe3+) ± 0.02
0.37 0.38 n/ma 0.38 0.39 0.38 0.39 n/ma 0.38 0.38 0.38 n/ma
Mössbauer QS (Fe3+) ±
0.02
0.89 0.90 n/ma 0.90 0.90 0.87 0.86 n/ma 0.90 0.88 0.82 n/ma
Mössbauer CS (Fe2+) ± 0.02
1.25 1.31 n/ma 1.28 1.27 1.26 1.25 n/ma 1.28 1.27 1.26 n/ma
Mössbauer QS (Fe2+) ± 0.02
2.13 2.11 n/ma 2.02 2.02 2.08 2.00 n/ma 2.02 1.93 1.89 n/ma
a
n/m, Not measured.
b
Am, amorphous.
Material bulk compositions have been analyzed using a Link energy-dispersive X-ray spectroscopy (EDS) unit fitted to a Philips 500 scanning electron microscope. The analyzed compositions shown in Table 1 and Table 2 are averages from three separate measurements. Estimated errors associated with each measurement are as follows: (i) major components (>10 mol%) error ± 1 mol%, (ii) intermediate components (1–10 mol%) error ± 0.5 mol%, (iii) minor components (<1 mol%) error ± 0.1 mol%. Lithium contents have been measured, for those samples containing lithium batch additions (glasses Li10S and Li20S), by inductively-coupled plasma-optical emission spectroscopy (ICP-OES). The accuracy of this technique is estimated to be ±0.1 mol% Li2O. Sulfur contents were analyzed both by EDS and using a Leco induction
furnace combustion analyzer and a combustion/infrared analyzer in order to gain greater accuracy. For analytical purposes the sulfur contents have been expressed in Table 1 and Table 2as sulfate (SO3). Sulfur analyzes carry
estimated accuracies of ±0.01 mol% SO3. Combined SEM and visual analyzes confirm that there is no evidence of
phase separation in the sulfate-containing glasses studied here. It is known that iron occurs as Fe2+ (FeO) and Fe3+ (Fe
2O3) in iron phosphate glasses but iron contents are presented here as equivalent Fe2O3 for simplicity.
Two glasses have also been used as comparators for the chemical durability studies. The first, SLS, is a commercial soda-lime-silica container glass and the second, a surrogate waste-loaded UK HLW borosilicate glass. The HLW glass composition and preparation method has been described in [36]. The SLS glass composition has been analyzed using the same EDS method and equipment used to analyze the iron phosphate glasses [34] and [35], and has the following analyzed composition (mol%): 71.3SiO2, 12.2CaO, 13.1Na2O, 2.3MgO, 0.6Al2O3, 0.2K2O, and 0.2SO3.
Densities have been measured by the Archimedes method using distilled water as the suspension medium. Archimedes densities are calculated using(1)
Density=[
W
A/(
W
A-
W
w)]×
δ
w,
where WA = weight in air, WW = weight in water andδ
w =temperature correction. Molar volumes have been calculated using measured densities and analyzed compositions [34] and [35].
Differential thermal analysis (DTA) has been performed using a Perkin–Elmer DTA 7 instrument. Powdered 25 mg samples of particle size <75 µm are placed in recrystallized Al2O3 sample cups and heated at 10 °C/min from 20 °C to
1200 °C.
Dilatometric measurements have been made between room temperature and 10–20 °C above the dilatometric softening point, Td, at a heating rate of 10 °C/min, using a Netzsch DIL402C dilatometer. Samples are ∼20 mm in length,
approximately circular in cross section and with ∼3 mm radius. Repeat measurements have confirmed that
measurements obtained from this equipment using a heating rate of 10 °C/min are acceptably accurate and reproducible within the error range specified. The linear coefficient of thermal expansion from 50–300 ° (α50–300), mid-point glass
transition temperature Tg and dilatometric softening point, Td, have all been determined using the dilatometer’s software
package. We note that for some samples the value of Tg as measured by DTA and dilatometry differ by an amount
monolithic sample. Heating rates for the two techniques were nominally the same, but small differences may have occurred which would, in particular, affect the measured values of Tg and Td. The trends in parameters observed as a
function of modifier type and content remain approximately the same between the two techniques, therefore both data sets have been included here for completeness. However, DTA results are more widely used for Tg determination.
Room temperature Mössbauer spectra have been collected relative to α-Fe over the velocity range ±5 mm s−1 using a
constant acceleration spectrometer with a 25 mCi source of 57Co in Rh. Eight broadened Lorentzian paramagnetic
doublets have been fitted to each spectrum, four for Fe2+ and four for Fe3+, using the Recoil analysis software
package [37]. Extracted center shift (CS), quadrupole splitting (QS) and line width (LW) parameters are weighted averages based on doublet areas. Multiple Lorentzian doublets have been widely used to fit Mössbauer spectra of iron phosphate glasses [7], [9], [10], [13], [17], [25] and [32]. The redox ratio, Fe2+/
ΣFe, is based on fitted peak areas,
corrected for the recoil-free fraction ratio f(Fe3+)/f(Fe2+) ≈ 1.30 in phosphate glasses at room temperature, as we have
discussed previously [7] and [9].
X-ray diffraction (XRD) has been carried out using a Philips PW1730/10 goniometer with CuKα radiation. Spectra have
been recorded from 10 to 60° 2θ at scanning rates between 0.1 and 0.4° 2θ/min.
Laser Raman spectroscopy has been carried out on flat, polished samples using 514.5 nm radiation and a Renishaw inVia spectrometer coupled with an optical microscope. Spectra are measured at 20× magnification from 0 to 1500 cm−1 and recorded by a computer.
Chemical durability measurements have been conducted according to Product Consistency Test B (PCT–B) [38], using 3 g of sample glass with size fraction 75–150 µm in 30 g distilled water leachant solution. Tests have been carried out in
duplicate at 90 °C for 7 days. Leachate solutions are then filtered and analyzed by inductively-coupled plasma optical emission spectroscopy (ICP-OES); correction of data by subtracting the normalized analysis for accompanying blank solutions is then made.
3. Results
Analyzed glass compositions and measured properties are shown in Table 1 and Table 2. Figs. 1(a) and (b) illustrate density and molar volume, respectively, as functions of nominal modifier oxide content. The experimental errors are smaller than the data points shown. XRD analysis has confirmed that the majority of samples are X-ray amorphous; any identified crystalline phases are noted in Table 1 and Table 2. Thermal analysis has been performed only on those samples which have been confirmed to be XRD amorphous. DTA traces are shown in Figs. 2(a) and (b), with the extracted data of onset glass transition temperature (Tg), onset of first crystallization peak (Tr) and endotherm end-point
liquidus temperature (Tliq) shown in Table 1 and Table 2. The value of (Tr−Tg), which is indicative of the thermal stability
of glass, is illustrated in Fig. 3. Dilatometric measurements provide the coefficient of thermal expansion between 50 °C and 300 °C (α50–300); the mid-point glass transition temperature (Tg); and the dilatometric softening point (Td). Given that
multiple crystalline phases occur in some glasses, Tliq corresponds to the highest-temperature endotherm, i.e. Tliq is the
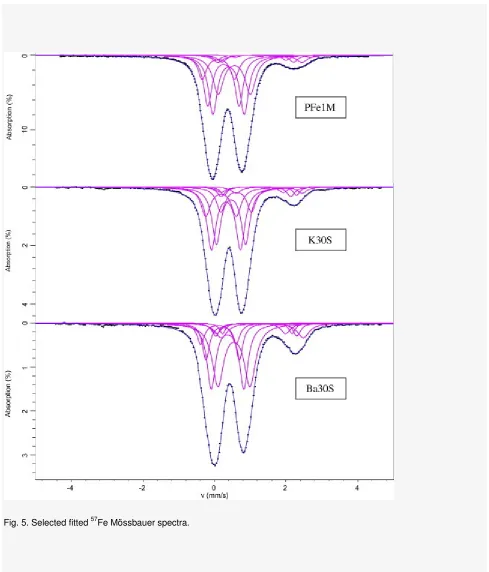
temperature above which no crystalline phases are present within the melt. Raman spectra are illustrated in Figs. 4(a,b); Fig. 5 shows selected fitted Mössbauer spectra and Fig. 6a and Fig. 6b illustrates the iron redox ratio measured by Mössbauer spectroscopy, as a function of (a) nominal modifier oxide content and (b) glass composition represented by the theoretical optical basicity calculated from analyzed compositions. Theoretical optical basicities have been calculated using published oxide basicity moderating parameters [39] and [40] and the analyzed composition of each glass. Estimated error bars shown in Fig. 6(b) include consideration of (i) errors associated with compositional analyzes and (ii) some Fe is present as FeO which has a different basicity moderating parameter to Fe2O3. Fig. 7 illustrates
Table 2. Nominal and analyzed composition and measured properties for [(1 − x)·(0.6P2O5–0.4Fe2O3)]·xRO glasses.
Sample name Mg10 S
Mg20S Ca10 S Ca20 S Ba10 S Ba20 S Ba30 S Ba40 S
Ba50S Pb10S Pb20S Pb30S Pb40S
P2O5 mol%
(analyzed) 49.08 40.00 (53.2) (47.6) 49.08 40.00 49.08 40.00 32.30 25.71 20.00 49.08 40.00 32.30 25.71 (53.9) (48.0) (56.1) (49.3) (42.5) (36.3) (29.2) (51.9) (44.8) (38.0) (31.3)
Fe2O3 mol%
(analyzed) 32.72 26.66 (35.1) (28.8) 32.72 26.66 32.72 26.66 21.54 17.14 13.33 32.72 26.66 21.54 17.14 (34.7) (30.0) (33.5) (29.8) (26.3) (22.0) (17.0) (33.6) (29.3) (25.3) (21.6)
SiO2 mol%
(analyzed) 0 (0.2) 0 (0.2) 0 (0.2) 0 (0.2) 0 (0.3) 0 (1.5) 0 (1.5) 0 (2.7) 0 (4.7) 0 (0.9) 0 (0.2) 0 (0.7) 0 (1.1) Al2O3 mol%
(analyzed) 0 (0.1) 0 (0.1) 0 (0.1) 0 (0.1) 0 (0.4) 0 (1.1) 0 (1.5) 0 (2.3) 0 (2.8) 0 (1.1) 0 (0.9) 0 (1.4) 0 (1.7) Na2O mol%
(analyzed) 0 (1.3) 0 (1.1) 0 (1.2) 0 (1.5) 0 (0) 0 (0) 0 (0) 0 (0) 0 (2.4) 0 (1.3) 0 (2.6) 0 (2.2) 0 (2.6) K2O mol%
(analyzed) 0 (0.1) 0 (0.1) 0 (0.1) 0 (0.1) 0 (0.1) 0 (0) 0 (0.3) 0 (0.3) 0 (0.3) 0 (0.2) 0 (0.3) 0 (0.3) 0 (0.4) MgO mol%
(analyzed) 9.10 (10.0) 16.67 (22.0) 0 (0) 0 (0) 0 (0) 0 (0) 0 (0) 0 (0) 0 (0) 0 (0) 0 (0) 0 (0) 0 (0) CaO mol%
(analyzed) 0 (0) 0 (0) 9.10 (9.8) 16.67 (20.0) 0 (0) 0 (0) 0 (0) 0 (0) 0 (0) 0 (0) 0 (0) 0 (0) 0 (0) BaO mol%
(analyzed) 0 (0) 0 (0) 0 (0) 0 (0) 9.10 (9.6) 16.67 (18.4) 23.08 (27.8) 28.57 (36.2) 33.33 (42.3) 0 (0) 0 (0) 0 (0) 0 (0) PbO mol%
(analyzed) 0 (0) 0 (0) 0 (0) 0 (0) 0 (0) 0 (0) 0 (0) 0 (0) 0 (0) 9.10 (11.0) 16.67 (21.8) 23.08 (32.1) 28.57 (41.3) SO3 equivalen
t mol% (analyzed) 9.10 (0.042 ) 16.67
(0.058) 9.10 (0.03 0) 16.67 (0.07 2) 9.10 (0.02 3) 16.67 (0.02 3) 23.08 (0.11 5) 28.57 (0.21 9) 33.33
(1.355) 9.10 (<0.09 6) 16.67 (<0.10 1) 23.08 (<0.10 6) 28.57 (<0.10 9) Phase/s
identified Am
b
Mg2P2O 7
Amb FePO
4
Amb Amb Amb Amb Uniden t. Phase/ s
Amb Amb Uniden t. Phase/ s Uniden t. Phase/ s Fe3(PO4
)2
FePO4
ρ ± 0.005/g
cm−3 2.936 3.113 3.095 3.198 3.265 3.547 3.810 4.035 4.165 3.479 3.966 4.448 5.063
Vm ±
1/cm3 mol−1 46.58 39.66 44.75 40.20 45.50 41.68 38.78 36.33 34.09 44.42 40.86 38.10 34.66
(α50–300 × 10−7)
± 2/ °C 73 n/m
a
79 n/ma 73 87 97 104 n/ma 65 82 n/ma n/ma
Dilatometric T
g ± 2/ °C 521 n/m
a
524 n/ma 536 572 615 647 n/ma 506 508 n/ma n/ma
Dilatometric T
d ± 2/ °C 548 n/m
a
541 n/ma 567 595 637 693 n/ma 522 534 n/ma n/ma
DTA mid-point Tg ± 2/
°C
526 n/ma 530 n/ma 547 582 616 n/ma n/ma 518 525 n/ma n/ma
DTA Tr ± 2/ °C 638 n/ma 658 n/ma 768 754 709 701 n/ma 630 625 n/ma n/ma
DTA (Tr−Tg)/
°C 123 n/m
a 138 n/ma 230 178 102 43 n/ma 125 114 n/ma n/ma
DTA Tliq ± 2/
°C 946 n/m
a 988 n/ma 985 1019 1052 1051 n/ma 960 957 n/ma n/ma
Mössbauer Fe2+/ΣFe ± 0.02
0.211 n/ma 0.215 n/ma 0.185 0.266 0.258 0.254 0.214 0.211 0.255 0.258 n/ma
Mössbauer CS (Fe3+) ± 0.02
0.39 n/ma 0.39 n/ma 0.38 0.39 0.40 0.37 0.43 0.39 0.39 0.40 n/ma
Sample name Mg10 S
Mg20S Ca10 S
Ca20 S
Ba10 S
Ba20 S
Ba30 S
Ba40 S
Ba50S Pb10S Pb20S Pb30S Pb40S
QS (Fe3+) ±
0.02 Mössbauer CS (Fe2+) ± 0.02
1.28 n/ma 1.26 n/ma 1.25 1.24 1.19 1.28 0.90 1.28 1.25 1.24 n/ma
Mössbauer QS (Fe2+) ± 0.02
2.07 n/ma 2.10 n/ma 2.09 2.02 2.13 1.85 2.64 2.14 2.13 2.13 n/ma
a
n/m, Not measured.
b
Am, amorphous.
4. Discussion
4.1. Composition, density, molar volume and crystallinity
It is often useful to numerically represent glass composition and structure in some meaningful way when considering the effects of methodical changes in composition, as we have studied here. Several such scales exist, although all have their limitations. Previously when studying the sulfur capacity of these and other glasses [34] we have considered simple scales such as P2O5content or [O]/[P] ratio in addition to more complex, and arguably more meaningful, scales such as
theoretical optical basicity [39]and [40] or cation field strength index [41]. In this paper with one exception we have presented the majority of our results in terms of nominal modifier content as the clearest means to illustrate the effects of different modifiers upon the properties of interest.
Increasing modifier oxide contents lead to higher levels of contamination of the final glass by SiO2 and Al2O3 arising from
increased dissolution of the mullite crucibles in which they have been prepared. This is consistent with the behavior of high-flux glass melts, i.e. those rich in alkali and alkaline earth oxides. As we have noted previously, the corrosivity of 60P2O5–40Fe2O3melts towards alumina and aluminosilicate refractories are remarkably low by comparison with the
effects of other phosphate glass melts [35].
Densities and molar volumes are shown in Table 1 and Table 2 and as a function of nominal modifier oxide content in Fig. 1(a). Only additions of BaO and PbO act to strongly increase density, reflecting the high mass of their constituent cations. In particular it may be noted that the alkali additions studied here have little effect on final glass density. In general the molar volumes, Vm, of the different samples gradually decrease with increasing modifier oxide addition, as
illustrated in Fig. 1(b). The addition of K2O appears to result in a more voluminous glass structure than occur for glasses
containing other additions. Our results for the effects of Na2O and K2O additions on density and molar volume are
consistent with those obtained by Fang et al. [19] for similar glasses.
X-ray diffraction (XRD) measurements reveal the limits of glass formation, which have been discussed and illustrated previously [34]. The identified crystalline phases which occur when the glass formation region has been exceeded are noted in Table 1 andTable 2. Phases arising in materials containing heavier oxides (K2O, BaO, and PbO) have not been
positively identified using standard powder diffraction files. Heavier modifier cations substantially extend the glass formation region [34], therefore it is likely that the primary phase/s for samples in which crystallization occurs during cooling are rich in modifier cations.
4.2. Thermal properties
The addition of increasing levels of modifier cations, both monovalent and divalent, generally has the effects of (a) increasing Tgand (b) increasing Tliq. The effects upon the other measured parameters are varied. These comprise
coefficient of thermal expansion, α50–300, dilatometric softening point, Td, and the onset temperature of bulk
The addition of alkali oxides to the base formulation, PFe1 M, produces only small increases in Tg, even at 30 mol%
alkali oxide (see Table 1 and Fig. 2). This is consistent with the results of Marasinghe et al. [17], who studied pro rata additions of up to 20 mol% Na2O and up to 30 mol% Cs2O to the same base glass that we have studied here. Alkali
additions strongly increase α50–300, the coefficient of thermal expansion between 50 °C and 300 °C. This has the effect of
making the glass less resistant to thermal shock. The value of (Tr−Tg), which can be used as a measure of the thermal
stability of a glass, is consistent with the glass formation boundaries within the respective systems. For example, as shown in Fig. 3, sample Li10S exhibits a lower (Tr−Tg) than the base glass PFe1 M since it is close to its glass formation
boundary which occurs between 10 and 20 mol% Li2O [34]. However, the addition of Na2O and K2O results in
substantially greater glass forming capabilities. This is reflected in the fact that (Tr–Tg) remains largely unchanged up to
20 mol% Na2O and K2O, then decreases at 30 mol% (see Fig. 3). This is again consistent with our earlier
results [34] which suggest that the glass formation limit, i.e. when a sample is cooled in air and the formation of crystallinity can be detected by XRD analysis, can be described by a broadly linear relation between the modifier cation field strength, ∑z/a2, and the atomic percentage of modifier cation. The effects of alkali additions upon Td, which
corresponds to viscosities of 109–1010 dPa s [42], are consistent with their known effectiveness in decreasing high
temperature viscosity in the order Li < Na < K [43].
As we have discussed in a previous publication [10], the main exotherms in the DTA trace for the base glass, PFe1 M, which are centered at approximately 650 °C and 850 °C, have been attributed by Day and co-workers to the
crystallization of Fe2+ (P
2O7)2 and Fe4 (P2O7)3, or ferrous-ferric pyrophosphate and ferric pyrophosphate,
respectively. DTA traces for samples doped with alkalis all suggest that the former, lower-temperature phase Fe2+ (P2O7)2 is the primary phase for these materials. Similar thermal characteristics are exhibited by Li2O, Na2O, and K2O,
albeit depending upon (a) the amount of modifier added and (b) the proximity of that composition to its respective glass formation boundary. Therefore the traces for (i) Li10S, Na30S and K30S; (ii) Na10S and K10S; (iii) Na20S and K20S bear similarities due to the parameters (a) and (b) described above. These similarities are also reflected in the value of (Tr−Tg) as shown in Table 1. Hence we may conclude that the thermal stabilities of the alkali-doped glasses are
proportional to a combination of the two factors, (a) and (b). Glasses are more stable, for a given molar addition of alkali, with increasing alkali cation size in the series Li < Na < K. One may speculate that this series can be extended to include Rb and Cs. Marasinghe et al. [17] observed that the addition of Cs2O to a 60P2O5–40Fe2O3 (mol%) base glass
suppresses crystallization at low Cs2O additions but enhances it at high concentrations, whereas Na2O promotes
crystallization and sharpens crystallization peaks. This behavior is also consistent with the effects of each different alkali addition upon the glass formation boundary.
Thermal analysis data for glasses doped with divalent cations display behavior that is somewhat more mixed than for samples containing alkali additions. At one end of the scale lie samples doped with Mg or Pb, which broadly exhibit behavior similar to that caused by the addition of comparable molar quantities of monovalent oxides. Glasses doped with Ca and Ba, respectively display moderately and markedly different behavior to alkali-doped glasses. Their additions to the base glass cause partial (Ca) and full (Ba) suppression of the crystallization peak at 600–700 °C in favor of the higher-temperature crystallization peak in the range 700–800 °C. These effects are accompanied by comparative increases in Tg, Td and Tliq. With the addition of BaO, Tg increases substantially whilst the low-temperature exotherm
found at ∼655 °C in the base glass PFe1 M, is suppressed and the high temperature exotherm at 700–800 °C decreases in temperature. The overall effect of this is to initially increase (Tr−Tg) by 100 °C whilst only increasing Tliq by 35 °C,
resulting in substantially greater thermal stability of sample Ba10S than the base glass (sample PFe1 M). Further BaO additions continue to increase Tg, decrease Tr and increase Tliq, however, glass stability remains better than or
comparable to that of the base glass at levels of up to 30 mol% BaO. Only at 40 mol% BaO does the thermal stability decrease sharply as a result of (Tr−Tg) approaching zero, which is indicative of proximity to the glass formation boundary.
We therefore conclude that our P2O5–Fe2O3–BaO glasses display good thermal stability at all but the highest BaO
additions and this stability, coupled with other beneficial effects of adding BaO, recommend these glasses for a number of potential applications. In addition to imparting high thermal stability, the addition of divalent cations such as
The substantial differences in the value of (Tr-Tg) which occur upon addition of the various modifiers studied here imply
that large shifts in the main crystallization peak result from the formation of different crystalline phases, i.e. shifts in the primary phase field. This would be expected on the basis of the substantial compositional changes with which they are associated. Our summation is corroborated by the differences in stoichiometry of those phases which form outside the glass formation region, as identified inTable 1 and Table 2.
In general, increasing additions of modifiers to the base glass increases α50–300, Tg, Td and Tliq. This behavior is broadly
consistent with that observed by other researchers for similar phosphate glasses [29], [30] and [33]. The increase in Tg is
probably due to the decrease in average value of Q with increasing modifier oxide content, discussed in Section 4.3.1. Although the base glass is strongly depolymerized, further depolymerization clearly takes place upon addition of modifiers and this replacement of P–O–P bonds by P–O–M bonds contributes to the increases in Tg and Td. An
increasing modifier content results in an increase in cross-linking density between phosphate units (although this effect is limited by the short average length of phosphate units as discussed in Section 4.3.1). The increase in α50-300 with
increasing modifier content would appear to dispute this structural assertion, as thermal expansion is also strongly influenced by the strength of network bonding, its connectivity and the interactions between cations and non-bridging oxygens. However, others [33] have also observed similar trends in modified iron phosphate glasses. It is noted that, for our glasses, distinct differences occur between the effects of monovalent and divalent modifiers. Monovalent modifiers generally have only a small effect on Tg but strongly increase α50-300, whereas divalent modifiers, in general, strongly
increase Tg but have a more moderate effect on α50-300. As expected, this is indicative of network bonding and
connectivity being more strongly increased by divalent modifiers than monovalent modifiers, and is consistent with the greater field strength and M–O bond strength of divalent modifiers. An additional factor to consider is that iron redox does not change linearly with modifier content. In addition the Fe–O bond strengths and local structural environments of Fe2+ and Fe3+ cations in the phosphate network are not identical owing to differences in ionic radius and ionic charge,
notwithstanding any small differences in coordination which may occur. As discussed in Section 4.3.2, Mössbauer analyzes reveal substantial changes in the Fe2+/ΣFe redox ratio with changing modifier content but do not indicate large
differences in coordination of Fe2+ and Fe3+ ions. Changing redox ratio may therefore be involved in the observed trends in α50-300, Tg, Td and Tliq. We must also consider the fact that as modifiers are added to our base glass, the content of
P2O5 and Fe2O3 are decreased. This is reflected in the fact that, for a given modifier type, Tg increases to a maximum
value but further modifier additions result in a decrease in Tg. It therefore seems likely that the competing factors of
reduced P2O5 content (which will act to reduce the average Q), reduced Fe2O3 content (which will act to increase the
average Q), increased modifier content (which will act to reduce the average Q and change the M–O bond strength depending upon amount and type of modifier) and changes in the iron redox ratio, are responsible for the trends shown in Tg and any apparent discrepancies between the effects of a strengthened network and the increases in
both Tg and α50–300. Clearly these relationships are not yet fully understood for phosphate glasses and further research is
required in this area.
4.3. Structural analysis
4.3.1. Raman spectroscopy
As shown in Fig. 4(a,b), Raman peaks occur at ∼340 cm−1, ∼630 cm−1, ∼750 cm−1, ∼950 cm−1, ∼1080 cm−1 and ∼1250 cm−1in the base glass, PFe1 M. This spectrum is consistent with published spectra for similar glasses [17] and [44].
There is some (although not comprehensive) agreement in the literature that iron phosphate glasses similar in composition to ours consist of a highly depolymerized phosphate network. On the basis of the literature consensus, where it exists, we have made the following band assignments for our spectra:
•
∼350 cm−1 bending of (PO4) units with Fe as modifier
•
∼760 cm−1 symmetric stretching of (P–O–P) bonds in Q1 (P2O7)4− units
•
∼950 cm−1 asymmetric stretching of Q0 (PO4)3− monomer units
∼1080 cm−1 asymmetric stretching of Q1 (P2O7)4− dimer units
•
∼1250 cm−1 asymmetric stretching of Q2 (PO3)− metaphosphate units
Additions of modifier cations to the base glass, PFe1 M, result in a number of spectral changes which become more pronounced as the modifier content increases, as illustrated in Fig. 4(a,b). These changes are summarized below.
•
∼350 cm−1 shifts to lower energies
•
∼470 cm−1 new band emerges; increases in intensity
•
∼630 cm−1 increases in intensity
•
∼760 cm−1 decreases in intensity
•
∼950 cm−1 becomes consumed by the broad ∼1080 cm−1 band as it shifts to lower energies
•
∼1080 cm−1 shifts to lower energies; broadens; splits into 2 distinct bands at ∼1000 cm−1 and ∼1100 cm−1
•
∼1250 cm−1 shifts to lower energies/disappears
Some of the effects of modifier content on Q-species of phosphate glasses have been discussed
elsewhere [45], [46], [47], [48],[49] and [50], following pioneering work by Van Wazer [51]. The new band at ∼470 cm−1 may arise from Q0 (PO4)3− units [52]. This suggestion is supported by interpretation of spectra for P2O5–Fe2O3–
PbO–Na2O glasses by Moguš-Milanković et al. [53] who claim that their band at ∼470 cm−1 arises from O–P–O bending
modes of Q0 units. It might be suggested that the ‘disappearance’ of the peak at ∼925 cm−1 is related to the conversion of Q0(PO
4)3− monomer units into more polymerized phosphate units. However, close examination of this peak indicates
that rather than disappearing, the peak becomes consumed by the broad band at higher energies as that band shifts to lower energies. Furthermore, as the band at ∼470 cm−1, which grows in intensity with modifier addition, is also attributed to Q0(PO
4)3− monomer units it seems more likely that the number of Q0(PO4)3− monomer units increases with modifier
addition. The gradual decrease in intensity of the (relatively weak) band at ∼760 cm−1 with increasing levels of modifier addition also indicates the partial conversion of Q1(P2O7)4− dimer units into other phosphate units. It seems clear that the
main peak centered at ∼1080 cm−1 comprises a number of overlapping components which cause the overall band position and profile to shift as a function of modifier addition. We view the origin of this broad peak as a distribution of Q0,
Q1 and Q2 phosphate groups. Shifts in the overall band position and shape are therefore indicative of changes in the
distribution of Q-species. A shift towards lower energies represents a more depolymerized network, i.e. a lower average value of Q. Therefore the addition of modifiers to the base glass results in a decrease in average Q.
A Raman band at ∼630 cm−1 observed in spectra for P2O5–Fe2O3–FeO–Cs2O glasses [23] and for other iron phosphate
glasses[28], [52] and [53], has previously been attributed to symmetric stretching of bridging oxygens (P–O–P)sym in
Q2 species. Those authors state that the band is indicative of Q2 species arising from disproportionation of Q1 species to Q0 and Q2 species. Literature for a range of modifier-containing phosphate glasses shows a commonly-occurring band centered at ∼690 cm−1 with a broad tail stretching towards higher Raman Shifts [21], [47], [54] and [55]. This band has also been attributed to symmetric stretching of bridging oxygens (P–O–P)sym in Q2 species. The Raman Shifts and band
shapes for the band at ∼630 cm−1 in our spectra are substantially different from the ∼690 cm−1 bands, and these differences are, in our opinion, too great for the two bands to have the same structural origin. One publication discussing modified iron phosphate glasses notes the presence of a Raman band at ∼650 cm−1 and attributes it to dimer units, i.e. Q1(P
2O7)4− units [17]. We suggest that this is also unlikely for our glasses, given the partial conversion of
Q1(P2O7)4− dimer units into other phosphate units discussed in the previous paragraph. We do note, however, that the
The spectral changes that take place as a function of modifier content are primarily governed by the level of addition and, as described above, the glass structure shifts towards a more depolymerized matrix with a lower average value of Qi upon modifier addition. However, structural differences also occur, albeit to a less pronounced degree, when
comparing the effects of different modifiers at a given molar percentage. For example, Raman spectra for K2O- and
BaO-doped glasses, which are shown in Fig. 4(a,b), respectively, clearly exhibit structural differences at the same nominal molar oxide addition. Differences are most noticeable when comparing the effects of monovalent and divalent cations and any differences between, for example, Na2O and K2O or CaO and BaO, are consistently small. This behavior is
consistent with the differing effects of alkalis and divalent cations on the structure of phosphate glasses.
4.3.2. 57Fe Mössbauer spectroscopy
Fitted values of Center Shift (CS) and Quadrupole Splitting (QS), shown in Table 1 and Table 2, are similar to published values for other iron phosphate glasses [6], [7], [9], [10], [12], [13], [15], [17], [18], [20], [31] and [32] and are consistent with the conclusion that both Fe2+ and Fe3+ predominantly occupy a range of distorted octahedral sites in all of the modified iron phosphate glasses studied here. Sites with lower coordination numbers may also be present; however, the Mössbauer results indicate that their abundance is relatively low. X-ray absorption spectroscopy, neutron diffraction and X-ray diffraction studies of a range of binary, ternary and modified iron phosphate glasses have provided average Fe–O coordination numbers from 4.8 to 5.5 [15], [16], [17],[18], [56], [57], [58], [59], [60] and [61] indicating the presence of some 4-coordinated and/or 5-coordinated iron. It should be noted that it is very difficult to separate the contributions from Fe2+ and Fe3+ using these spectroscopies and instead an ‘average’ is generally obtained. Debate still exists as to the
detailed environments of Fe2+ and Fe3+ in iron phosphate glasses. For example, Wright et al. [61] recently noted that their neutron diffraction results mitigate against the presence of large numbers of the (Fe3O12)16− clusters that are
postulated by the structural model of Marasinghe et al. [56].
Hyperfine parameters obtained from fitting of our Mössbauer spectra indicate that, within the range of glasses surveyed, glass composition does not have a large effect on the local environment of the Fe2+ and Fe3+ cations. Again, our results are consistent with those from other studies of iron phosphate glasses which have concluded that the near-neighbor local environment of iron is not greatly affected by the addition of modifier cations [16], [17], [18], [56], [57], [58], [59] and [60].
The redox ratio, Fe2+/
ΣFe, is substantially affected by the abundance and type of modifier addition as illustrated by the
variation in fitted spectra shown in Fig. 5. As also shown in Fig. 6(a), Fe2+/ΣFe increases upon initial addition of all modifiers, reaching a maximum value at roughly 20 mol% R2O or 30 mol% RO addition, and above these levels Fe2+/ΣFe
decreases with further modifier additions. This behavior is illustrated more clearly by Fig. 6(b), in which theoretical optical basicity, Λth, is plotted as an indicator of composition/structure. In addition to our own data we have also calculated the
redox behavior of the glasses investigated by Marasinghe et al. [16] and [17], which came from ostensibly the same family of glasses as ours, i.e. [(1−x)·(0.6P2O5–0.4Fe2O3)]·xRxOy, where their R = Na, Bi, Ca, and Cs. We note that
Marasinghe et al. neglected to consider differences in Fe2+ and Fe3+ recoil-free fraction ratios in their Mössbauer fitting,
which affects the redox ratio measurement. We have converted their data for the purposes of this examination using the same method that we have applied to our own data (see Experimental). Marasinghe et al. also used different melting
programmes to ours: in [16] their glasses were melted at approximately 1150 °C for 1–2 h and were apparently unstirred. In [17], their glasses were melted at approximately 1200 °C for 1–2 h and again the melts were apparently unstirred. Our glasses were melted at exactly 1150 °C for 3 h, and were stirred during melting to improve homogeneity. Differences in iron redox ratios between our glasses and comparable glasses of Marasinghe et al. (e.g. the base glass and the Na2
O-doped series) can be attributed to differences in preparation and particularly to the effects of different melting
temperatures, which have been assessed in another publication [44]. Despite these differences, the data of Marasinghe et al. [16] and [17] exhibits the same trend in redox as a function of composition as our data (see embedded graph inFig. 6(b)), adding further support that the trends shown by our data are reproducible.
To explain the redox behavior of [(1−x)·(0.6P2O5–0.4Fe2O3)]·xRxOy glasses with increasing x we must first consider any
potential involvement of the sulfate that was present in our batches and which predominantly or completely volatilized during melting, presumably as SO2 and ½O2[62]. The measured redox ratio, Fe2+/ΣFe, for samples Na20 (prepared using
batch Na2CO3) and Na20S (prepared using batch Na2SO4) are equal within errors of measurement and fitting (see Table
on final glass redox, within experimental parameters. Therefore we can discount significant involvement of batch sulfate in the redox processes observed. This conclusion is also supported by the results of Marasinghe et al. [16] and [17], illustrated as the embedded graph in Fig. 6(b), since those authors did not use batch sulfates but presumably used carbonates or oxides to supply their modifiers, and yet their data exhibits the same behavior.
It is known that in simple oxide melts the Mm+/M(m+n)+ ratio, where M is a multivalent ion present in dilute quantities, generally decreases as the melt composition becomes more basic [63], [64] and [65], i.e. as the ability of constituent O2− to donate negative charge becomes greater. This behavior can be described by the optical basicity concept
developed by Duffy and Ingram [39], [40]and [63], and which we have used here to illustrate our glass compositions across a range of modifier types and additions (Fig. 6(b)). In some cases, changing glass basicity does not adequately explain the redox behavior in glasses of iron [66] and [67] and certain other multivalent
species [68], [69], [70], [71] and [72]. Others have also noted that redox behavior may involve other factors than glass basicity [63] and [65]. A similar trend to that which we have noted, i.e. a maximum value of Mm+/M(m+n)+ occurring at intermediate modifier contents and hence intermediate glass basicities, has also been observed for dilute (1 wt%) quantities of iron in sodium silicate and alkali borosilicate glasses by Schreiber et al.[67]. Their explanation for this
deviation from the trend predicted by glass basicity (i.e. Mm+/M(m+n)+ decreases with increasing basicity) is that a change
in coordination of Fe3+ takes place. They state that Fe3+ occupies octahedral sites in acidic glasses, whereas in basic melts it converts to occupying tetrahedral sites. However, they present no measurements of the structural role of iron in their own glasses to support their assertion. Similar redox behavior has again been observed in the Cu2+/
ΣCu ratio
of P2O5–CuO–(Cu2O) glasses as a function of CuO content by a number of independent research
groups [66], [67], [68] and [69]. Some authors have, like Schreiber et al.[67], attempted to explain this behavior by a change in transition metal ion coordination as a function of glass composition [70] and [71]. Bih et al. [72] studied the effects of Li2O/P2O5 ratio and MoO3 content on the Mo5+/ΣMo redox ratio in Li2O–MoO3–P2O5 glasses. They observed
that, when (MoO3)2 content was constant at 5 mol%, the ratio Mo5+/ΣMo decreased with increasing Li2O content. This is
consistent with the accepted view of redox behavior as per the basicity model [39] and [40]. However, for their second series of glasses, when the Li2O content was constant and the MoO3/P2O5 ratio varied, a trend in Mo5+/ΣMo occurred
similar to that which we (and others [67]) have observed for Fe2+/
ΣFe. Paul and Douglas’ early publication on the
Fe2+/Fe3+ equilibrium in binary alkali silicate glasses [73] again describes a similar trend to ours. However, this trend only
occurred for those glasses which they melted in Pt crucibles and Pt was believed to have an oxidizing effect on the Fe redox equilibrium in glasses containing less than ∼30 mol% R2O (R = Li, Na, and K). In glasses melted in ceramic
crucibles the Fe redox behavior followed a pattern consistent with that predicted by glass basicity.
In addition to its usefulness in determining the oxidation state, Mössbauer spectroscopy is a powerful tool for studying changes in the local structural environment of Fe in glasses [74], [75] and [76]. Our fitted center shift (CS) and quadrupole splitting (QS) values do not support a substantial change in Fe3+ coordination as a function of increasing modifier content or increasing glass basicity. Instead, CS (Fe3+) and QS (Fe3+) remain remarkably consistent for all types
and levels of modifier addition. Small, subtle deviations are observed for some samples but these are insufficient to explain the observed redox trend shown in Fig. 6a and Fig. 6b and described in Table 1 and Table 2. The evidence from Mössbauer spectroscopy therefore casts doubt on the suggestion made by several other authors that the observed redox behavior is attributable to changes in Fe3+ coordination, and as a result we must consider alternative explanations. One
is that the observed redox phenomenon has a structural origin and is related to the polymerization and speciation of the network and the thermodynamic stability of different structural units as a function of composition, rather than being solely governed by classical redox reactions. There is support for such a hypothesis, given the high iron content of the glasses in which iron is a major constituent rather than a solute. As shown by thermal analysis (see Section 4.2) the glass stability defined as (Tr−Tg) varies greatly. Some of the crystalline species associated with exothermic DTA peaks have
previously been identified by Day and co-workers as containing all Fe3+ or a mixture of Fe2+ and Fe3+, as we have discussed previously [10]. Therefore it is possible that the iron redox ratio is inextricably linked to glass stability in these systems. This hypothesis would therefore suggest that the redox ratio in iron phosphate glasses can vary to an extent in order to fulfil the requirements of glass stability, and vice versa. Further investigation of this behavior is suggested.
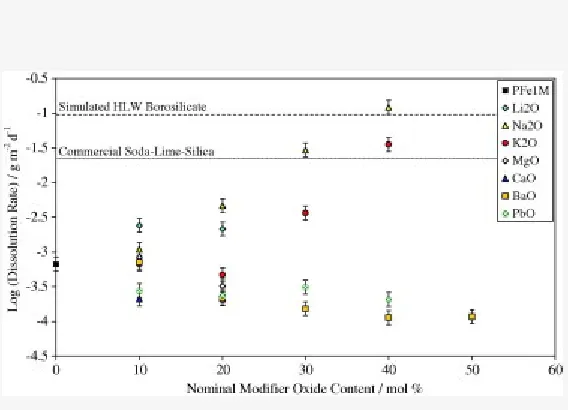
Leach test results arising from 7-day Product Consistency Test B (PCT-B) testing at 90 °C [37], and illustrated in Fig. 7, reveal a number of important trends.
•
(i) For a given molar alkali content, durability decreases in the order Na < K.
•
(ii) Addition of K2O has no effect on durability at levels up to 20 mol%. Durability then decreases with further increases in
K2O content.
•
(iii) Durability decreases with increasing Na2O content.
•
(iv) Divalent oxide additions improve durability. Addition of BaO produces the greatest improvement.
•
(v) All glasses exhibit good to excellent aqueous durability. Even high-alkali (40 mol% R2O) samples exhibit leach rates
that are still comparable to those exhibited by the surrogate waste-loaded borosilicate glasses.
Chemical durabilities, measured by PCT-B, are plotted in Fig. 7 as functions of the nominal modifier oxide content of each sample. In addition to results for the modified iron phosphate glasses, PCT-B results for the commercial SLS container glass and for the surrogate waste-loaded borosilicate glass MW, used to immobilize the UK’s high-level nuclear waste (HLW) [36], have been included. The base glass, PFe1 M, has a low optical basicity and each incremental increase in modifier addition has the effect of increasing optical basicity.
As shown in Fig. 7, glasses containing additions of divalent cations, and particularly BaO and PbO, exhibit aqueous leach rates of ∼0.0001 g m−2 d−1 at 90 °C. Such leach rates are exceptionally low, and are comparable with those obtained from testing of the best ceramic waste immobilization host materials that are presently available [77]. However, further research must be conducted under a range of test conditions including long-term leaching behavior and the effects of pH before one can definitively state that these glasses out-perform alkali borosilicate glasses under likely repository conditions.
The addition of modifier ions to phosphate glasses is known to strongly affect their chemical durability. For example, Bunker et al.[78] demonstrated that the durability of P2O5–R2O–RO glasses is considerably improved, over a range of pH
values, following replacement of alkali oxides by alkaline earth oxides and following replacement of Na2O by Li2O. Peng
and Day [79] studied the effects of Na2O and K2O in R2O–R2O3–P2O5 glasses, noting that ionic cross-linking between
non-bridging oxygens (NBO’s) is provided by alkali and alkaline earth cations, and increasing the bond strength of this ionic crosslink is expected to improve chemical durability. They stated that since ionic radius increases in the order Li+ < Na+ < K+ the crosslink strength decreases in the same order, so that chemical durability of their glasses decreased in the
order Li > Na > K. Minami and Mackenzie [80] and Metwalli and Brow [81] have observed similar effects in R2O–Al2O3–
P2O5 glasses, which are broadly appropriate as structural comparators for our alkali-modified iron phosphate glasses.
Other studies by Shih and Shiu [82], Shyu and Yeh [83] and Jung et al. [84] document the effects upon chemical durability of phosphate glasses containing no alkalis by replacing high field strength modifiers by low field strength modifiers. In these works the trend exhibited by replacing alkalis discussed above is different. For example, Shih and Shiu [82] replaced ZnO by SrO in P2O5–SrO–ZnO glasses and observed a substantial increase in durability as SrO
replaced ZnO. Similarly, Jung et al.[84] observed the same trend for as BaO replaced ZnO in P2O5–BaO–ZnO glasses.
Metwalli and Brow [81] observed a similar increase in durability upon replacing MgO by BaO in P2O5–Al2O3–RO glasses.
The behavior of our glasses upon addition of the alkalis Li2O, Na2O and K2O is not consistent with the evidence
described above which indicates that durability should increase with increasing field strength (i.e. decreasing size) of the alkali cation. As a result the fact that durability of our modified iron phosphate glasses increases in the order Li < Na < K for a given molar content of R2O is unexpected, based on the known effects of alkali ionic radius on the durability of other
phosphate glass durability are not well understood, but it seems clear that the simple field strength arguments are quite inadequate.
The behavior of K2O in iron phosphate glasses is interesting because durability only begins to decrease >20 mol% K2O.
Assessment of the Raman spectra for this series of glasses indicates that any structural differences (in terms of the degree of depolymerization) between glasses containing equimolar amounts of Li2O, Na2O and K2O are not large.
However, molar volumes shown in Fig. 1(b) indicate that K2O glasses maintain a voluminous structure by comparison
with the other glasses, even those containing other alkalis such as Na2O. Further work, possibly using X-ray or neutron
techniques, would be useful to obtain more information on any structural differences which may explain these apparently unusual trends in chemical durability.
Lead–iron phosphate glasses were investigated in the 1980s by Sales and Boatner [3], who observed their high aqueous durabilities accompanied by melting and processing temperatures as low as 800 °C. However, as outlined by Jantzen [1], a number of problems beset the lead–iron phosphate glass formulations that had been developed (typically 35–55 mol% P2O5, 30–55 mol% PbO and 10 mol% Fe2O3). These problems included low waste loading capacities, high melt
corrosivity, incompatibility with certain canister materials and poor thermal stability. Furthermore, chemical durability when tested under extreme conditions at 200 °C in 7 M NaCl solution, was found to be very inferior to the durability of borosilicate waste glasses [85]. Our P2O5–Fe2O3–PbO glasses differ substantially from those developed by Sales and
Boatner [3]. We regard their glasses as lead phosphate glasses doped with iron since the Fe2O3 contents are relatively
low. Our glasses, on the other hand, may be regarded as iron phosphate glasses doped with lead: a minor-sounding difference but a compositionally significant one. According to Jantzen [1], the lead–iron phosphate glasses of Sales and Boatner suffer from rapid thermal devitrification at temperatures above 550 °C. By comparison, our DTA traces illustrated in Fig. 2(b) for glasses Pb10S and Pb20S (10 and 20 mol% PbO, respectively) indicate that at 550 °C there is no crystallization tendency, indeed the crystallization exotherms do not even begin until 675 °C and 630 °C respectively. It seems clear that the addition of PbO, whilst it substantially decreases viscosity and melting temperature, also decreases glass stability in iron phosphate glass systems. Combined with the fact that samples Pb30S and Pb40S exhibited some crystallization upon cooling, it might be prudent to limit the addition of PbO to the 60P2O5–40Fe2O3 base glass to 20
mol%.
Barium doped iron phosphate glasses have received limited attention as potential host materials for the immobilization of surplus PuO2[86]. The authors provided little detail but it seems likely that the addition of BaO to their base glass
provided some benefits when immobilizing PuO2, otherwise there would be no reason to do so. More widely, barium-rich
phosphate glasses generally exhibit high chemical durabilities [80] and [84] which lends further support to their
investigation as a potential host material for waste immobilization. Our results for barium-doped iron phosphate glasses substantially support the use of barium. Not only is the capacity of the base glass to incorporate BaO the highest of all the additions studied (40 mol% BaO produces a fully amorphous glass when cast in air), but its effect is to increase aqueous durability to the point at which leach rates for the PCT-B test are at or below the limits of detection for the ICP-OES technique that we have used. The absence, to our knowledge, of any prior determination of the behavior of P2O5–
Fe2O3–BaO glasses with these compositions mark our discovery and development of these new, ultra-durable, thermally
stable, low-melting glasses as a significant step forward. Clearly more development and testing remains to be carried out, but this important discovery could prove to be useful for a range of glass applications including, but not restricted to, waste immobilization.
5. Conclusions
Molar additions of monovalent (Li, Na or K) or divalent (Mg, Ca, Ba, and Pb) oxides to a 60 mol% P2O5–40 mol%
Fe2O3 (nominal) glass result in substantially different effects on thermal properties and chemical durability. The addition
of up to 40 mol% R2O has relatively little effect on density, Tg and Td; however, addition of RO increases these
The iron redox ratio, Fe2+/ΣFe, exhibits a complex relationship with glass composition, with a maximum value occurring
at intermediate levels of modifier addition (corresponding to ∼20 mol% RyO). This behavior has, to our knowledge, been rarely observed in oxide glasses and does not conform to conventional linear relationships established for relatively simple glasses doped with dilute quantities of iron. Previous explanations for similar behavior were given on the basis of changes in iron coordination. However, fitted Mössbauer parameters show that iron coordination does not change across the range of compositions studied here, therefore changes in iron coordination are not responsible for the redox
behavior. An alternative hypothesis based on structural requirements is suggested.
The effects of R+ and R2+ cations upon chemical durability, measured by Product Consistency Test B (PCT-B), are markedly different. Alkali additions decrease chemical durability, although durability for a given molar addition increases through the series Li < Na < K. Even high (30–40 mol%) R2O additions result in glasses with durabilities no worse than
those of commercial SLS glass and a surrogate nuclear waste-loaded borosilicate glass. On the other hand, addition of divalent cations consistently increases durability to a level even greater than the high durability displayed by the base glass. Log (dissolution rate/g m−2 d−1) having values of −3 to −4 have been recorded for all divalent additions (Mg, Ca, Ba, and Pb), even 40–50 mol% in the cases of Pb and Ba. Taking all the results together the P2O5–Fe2O3–BaO glasses
reported here show particular promise as they are ultra-durable, thermally stable, low-melting glasses with a wide glass formation region.
The capacity of the base glass to incorporate R+ and R2+ cations, and particularly large cations with low field strengths, is substantial. Highly-modified glasses containing R2+ cations generally exhibit high aqueous durabilities which are greater
than the durability of the base glass, which is itself very high. As a result, some of the modified iron phosphate glasses studied here might find applications as hosts for nuclear or toxic wastes rich in R+ or R2+ cations and in particular, large cations with low field strengths, particularly Ba2+ and Pb2+.
Acknowledgements
The authors acknowledge with thanks EPSRC, the UK’s Engineering and Physical Sciences Research Council, for funding this research. The authors also wish to acknowledge two anonymous reviewers for their suggestions and constructive comments.
Figures
Fig. 1. (a) Density and (b) molar volume as a function of nominal modifier oxide content for [(1−x)·(0.6P2O5–
Fig. 2. DTA curves of (a) [(1−x)·(0.6P2O5–0.4Fe2O3)]·xR2O and (b) [(1−x)·(0.6P2O5–0.4Fe2O3)]·xRO glasses.
[image:16.595.56.542.549.701.2]Fig. 3. Tr−Tg as a function of nominal modifier oxide content for [(1−x)·(0.6P2O5–0.4Fe2O3)]·xRyO glasses.
Fig. 4. Raman spectra of (a) [(1−x)·(0.6P2O5–0.4Fe2O3)]. xK2O glasses and (b) [(1−x)·(0.6P2O5–0.4Fe2O3)]. xBaO
Fig. 6a. Iron redox ratio, Fe2+/ΣFe, as a function of nominal modifier oxide content.
Fig. 6b. Iron redox ratio, Fe2+/ΣFe, as a function of theoretical optical basicity calculated from analyzed glass
compositions. Embedded graph shows data adapted from Marasinghe et al.[16] and [17].
Fig. 7. Aqueous dissolution rate measured by PCT-B vs. nominal modifier oxide content for [(1−x)·(0.6P2O5–
[image:18.595.56.340.525.730.2]References
[1] C.M. Jantzen. J. Non-Cryst. Solids, 84 (1986), p. 215. Article | PDF (582 K) | | View Record in Scopus | | Cited By
in Scopus (15)
[2] I.W. Donald, B.L. Metcalfe and R.N.J. Taylor. J. Mat. Sci., 32 (1997), p. 5851. | View Record in Scopus | | Full Text via CrossRef | Cited By in Scopus (193)
[3] B.C. Sales and L.A. Boatner, W. Lutze, R.C. Ewing, Editors , Radioactive Waste Forms for the Future, North-Holland,
Amsterdam (1988) p. 193.
[4] A.P. Mukhamet-Galeyev, L.O. Magazina, K.A. Levin, N.D. Samotoin, A.V. Zotov and B.I. Omelianenko. Mat. Res. Soc. Symp. Proc., 353 (1995), p. 79.
[5] V.V. Kushnikov, Yu.I. Matyunin, T.V. Smelova and A.V. Demin. Mat. Res. Soc. Symp. Proc., 465 (1997), p. 55.
[6] P.A. Bingham and R.J. Hand. J. Hazard. Mater., B119 (2005), p. 125.
[7] P.A. Bingham, R.J. Hand, S.D. Forder and A. Lavaysierre. J. Hazard. Mater., B122 (2005), p. 129.
[8] I.W. Donald, B.L. Metcalfe, S.K. Fong, in: Proceedings of the Twentieth International Congress on Glass, Kyoto, Japan, 2004..
[9] P.A. Bingham, R.J. Hand, S.D. Forder, A. Lavaysierre, F. Deloffre, S. Kilcoyne and I. Yasin. Glass Technol. Eur. J. Glass Sci. Technol. Part B, 47 (2006), p. 313.
[10] P.A. Bingham, R.J. Hand and S.D. Forder. Mater. Res. Bull., 41 (2006), p. 1622.
[11] Y. Lin, Y. Zhang, W. Huang, K. Lu and Y. Zhao. J. Non-Cryst. Solids, 112 (1989), p. 136.
[12] T. Takahashi, T. Inamura, T. Toriyama and H. Iijima. Nucl. Instrum. Methods Phys. Res. Sect. B, 76 (1993), p.
103.
[13] P.A. Bingham, S.D. Forder, R.J. Hand and A. Lavaysierre. Hyperfine Interact., 165 (2005), p. 135.
[14] H. Itoh, T. Inamura, H. Wakabayashi, T. Toriyama, H. Iijima, in: Proceedings of the ICAME-95, 1996, p. 445..
[15] X. Yu, D.E. Day, G.J. Long and R.K. Brow. J. Non-Cryst. Solids, 215 (1997), p. 21.
[16] G.K. Marasinghe, M. Karabulut, X. Fang, C.S. Ray, D.E. Day, D.L. Caulder, J.J. Bucher, N.M. Edelstein, D.K. Shuh and P.G. Allen.Ceram. Trans., 107 (2000), p. 115.
[17] G.K. Marasinghe, M. Karabulut, C.S. Ray, D.E. Day, P.G. Allen, J.J. Bucher, N.M. Edelstein, D.K. Shuh, Y.S. Badyal, M.L. Saboungi, M. Grimsditch, S.D. Shastri and D. Haeffner. Ceram. Trans., 93 (1999), p. 195.
[18] G.K. Marasinghe, M. Karabulut, C.S. Ray, D.E. Day, C.H. Booth, P.G. Allen and D.K. Shuh. Ceram. Trans., 87 (1998), p. 261.
[20] M. Karabulut, E. Melnik, R. Stefan, G.K. Marasinghe, C.S. Ray, C.R. Kurkjian and D.E. Day. J. Non-Cryst. Solids, 288 (2001), p. 8.
[21] A. Mogus-Milankovic, A. Gajovic, A. Santic and D.E. Day. J. Non-Cryst. Solids, 289 (2001), p. 204.
[22] Y.M. Moustafa. J. Phys. D. Appl. Phys., 32 (1999), p. 2278.
[23] A. Mogus-Milankovic, K. Furic and D.E. Day. Mat. Res. Soc. Symp. Proc., 663 (2001), p. 153.
[24] M.G. Mesko, D.E. Day and B.C. Bunker. Waste Manage., 20 (2000), p. 271.
[25] M. Karabulut, G.K. Marasinghe, C.S. Ray, D.E. Day, O. Ozturk and G.D. Waddill. J. Non-Cryst. Solids, 249 (1999),
p. 106.
[26] A.M. Sanad, I. Kashif, M.A. Khaled, S.A. Aly and H. Farouk. Phys. Chem. Glasses, 30 (1989), p. 27.
[27] B.L. Metcalfe, S.K. Fong and I.W. Donald. Glass Technol., 46 (2005), p. 130.
[28] A. Mogus-Milankovic, A. Santic, A. Gajovic and D.E. Day. J. Non-Cryst. Solids, 325 (2003), p. 76.
[29] M. Hafid, T. Jermoumi, N. Niegisch and M. Mennig. Mater. Res. Bull., 36 (2001), p. 2375.
[30] T. Jermoumi, M. Hafid and N. Toreis. Phys. Chem. Glasses, 43 (2002), p. 129.
[31] P. Bergo, S.T. Reis, W.M. Pontuschka, J.M. Prison and C.C. Motta. J. Non-Cryst. Solids, 336 (2004), p. 159.
[32] S.T. Reis, M. Karabulut and D.E. Day. J. Non-Cryst. Solids, 292 (2001), p. 150.
[33] T. Jermoumi, M. Hafid, N. Niegisch, M. Mennig, A. Sabir and N. Toreis. Mater. Res. Bull., 37 (2002), p. 49.
[34] P.A. Bingham and R.J. Hand. Mater. Res. Bull., 43 (2008), p. 1679.
[35] P.A. Bingham, R.J. Hand, S.D. Forder, A. Lavaysierre, S.H. Kilcoyne and I. Yasin. Mater. Lett., 60 (2006), p. 844.
[36] N.J. Cassingham, P.A. Bingham, R.J. Hand and S.D. Forder. Glass Technol. Eur. J. Glass Sci. Technol. Part A, 49 (2008), p. 21.
[37] K.Lagarec, D.G. Rancourt, Recoil: Mössbauer Spectral Analysis Software for Windows, 1998. Available from<http://www.isapps.ca/recoil/.>.
[38] ASTM C1285-02, Standard Test methods for Determining Chemical Durability of Nuclear, Hazardous, and Mixed Waste Glasses: the Product Consistency Test (PCT), ASTM, Conshohocken, USA, 2002..
[39] J.A. Duffy and M.D. Ingram. J. Non-Cryst. Solids, 21 (1976), p. 373.
[40] J.A. Duffy. Geochim. Cosmochim. Acta, 57 (1993), p. 3961.
[41] A. Dietzel, . Glastech. Ber., 21 (1948), p. 41 81.
![Table 1. Nominal and analyzed composition and measured properties for [(1−x)·(0.6P2O5–0.4Fe2O3)]·xR2O glasses](https://thumb-us.123doks.com/thumbv2/123dok_us/363782.1037556/3.595.53.543.200.786/table-nominal-analyzed-composition-measured-properties-fe-glasses.webp)
![Table 2. Nominal and analyzed composition and measured properties for [(1 − x)·(0.6P2O5–0.4Fe2O3)]·xRO glasses](https://thumb-us.123doks.com/thumbv2/123dok_us/363782.1037556/6.595.55.544.92.784/table-nominal-analyzed-composition-measured-properties-fe-glasses.webp)
![Fig. 2. DTA curves of (a) [(1−x)·(0.6P2O5–0.4Fe2O3)]·xR2O and (b) [(1−x)·(0.6P2O5–0.4Fe2O3)]·xRO glasses](https://thumb-us.123doks.com/thumbv2/123dok_us/363782.1037556/16.595.51.543.69.252/fig-dta-curves-p-fe-fe-xro-glasses.webp)