2017 2nd International Conference on Computer Science and Technology (CST 2017) ISBN: 978-1-60595-461-5
A Copy-Move Forgery Detection Method for VDR Image
Mei-dong HU
1,a,*, Xiao-tong WANG
1and Guan-lei XU
21 Department of Navigation, Dalian Naval Academy, Dalian, China
2 Department of Military Oceanography, Dalian Naval Academy, Dalian, China
*Corresponding author
Keywords: Voyage data recorder (VDR), Copy-move forgery, Blind image forensics, Marine accidents investigation.
Abstract. The authenticity of VDR images is facing a severe test due to advanced image processing technology. Aiming at the issue of using copy-move forgery method to cover up the truth of marine accidents in VDR images, a VDR image copy-move blind forensics method is proposed. In the proposed work, the images are decomposed by Bi-dimensional Empirical Mode Decomposition (BEMD), and SURF algorithm is employed to obtain feature point descriptor. Comparisons with the prevailing methods show that the proposed method improves the detection accuracy. Furthermore, it is invariant to any rotation or scaling in the copy-move region.
Introduction
VDR is a kind of apparatus that can record and save the information about the ship before and after the accidents, also called black box [1]. Similar to the function of aircraft black box, when there is a maritime traffic accident, the relevant departments could master the situation in the scene by analyzing and interpreting the information recorded in the VDR system, the then determine the responsibility of the accident fairly [2].With the rapid development of shipbuilding technology, maritime traffic is increasingly busy, which brings more maritime traffic accidents. Most ships now have installed VDR system to record and store various kinds of images inside and outside the cabin, which are important basis for marine accident investigation. However, mature image processing technology makes it so easy to tamper with image data, and VDR images are likely to be the victims. They are no longer completely true and reliable. Hence, the authenticity of VDR image becomes the key factor of whether the accident investigation results are accurate and whether the law penalty results are fair, which is also an important problem that must be solved in the current VDR application process.
Copy-Move Forgery Model of VDR Image
At present, copy-move is one of the most widely used tampering methods. Copy an existing area R1 in the image and paste it into the target area R2, to cover some of the important objects in the original image or to fabricate a non-existent scene. Simultaneously, in order to make forgery images more real and difficult to identify, modifiers tend to add some geometric operations such as rotation and scaling. The copy-move forgery model of VDR image is defined as follows:
(1) The copied area R1 is a connected area inside the image;
(3) The copied area R1 couldn’t be too small, at least larger than 1% of the original image;
(4) R2 could be obtained by a single rotation or scaling operation or compound operations from R1.
Blind Forensics Algorithm for VDR Image based on Improved SURF
In an image, the feature points reflect the local features of the image, independent of the shape and direction of the region. After copy-move forgery, there will be analogous local areas in the image [3], correspondingly, there will be matching feature points [4]. Therefore, it is possible to identify the image’s authenticity by detecting the feature points that match each other in the VDR image. The basic idea of this method is to detect the matching feature points in the VDR image, then connect them with lines, and finally detect the tampered region to identify the authenticity of the VDR image.
Bi-dimensional Empirical Mode Decomposition (BEMD)
Empirical Mode Decomposition (EMD) is an adaptive signal analysis method proposed by Huang et al [5]. Later, this method is extended to two-dimensional signal that is BEMD, mainly used for image processing [6, 7].
The decomposition process of BEMD can be explained by Eq. 1:
1
( , ) N i( , ) ( , )
i
f x y imf x y res x y
=
=
+ . (1)Where f(x, y) is the original image, imfi (x, y) is the i-th IMF (intrinsic mode functions) component, and res(x, y) is the residue.
(1) Initialize: r1=I, imf1=I (I is the input image);
(2) Determine the largest neighborhood N×N of the decomposition of layer l; (3) Determine all the local extreme points of r1-1, and obtain the maximum point set and the minimum point set;
(4) Interpolate between two adjacent extreme points until the distance between them is not greater than N;
(5) Find the extreme points in the largest neighborhood until the neighborhood boundary is found, and the local adaptive mean filtering algorithm is used to obtain the mean of the current point;
(6) Reconstruct the image h1-1 with all the mean points, and calculate imf1-1=r1-1-h1-1, r1= h1-1;
(7) Repeat (2) to (6) until the given condition is met; (8) Assign hi-1 to r (x, y).
After several experiments and comparative analysis, it is found that the minimum normalized mean square error and the maximum SNR can be obtained when the image is decomposed into five IMF components, and the matching is most efficient. Therefore, this decomposition scheme is applied to this experiment.
SURF Feature Points Detection
Integral Image
Eq. 2 shows the definition of integral image. Given an input image I, the integral image of the pixel (i, j) is the sum of the pixel values of all the pixels in the rectangular region which takes the imaginary origin and the pixel (i, j) as vertices.
0 0
( , ) ( , )
y x
i j
I x y I i j
= =
=
. (2)Where I(i, j) represents the pixel value corresponding to the pixel (i, j) in image I and I∑ is the integrated image of the image I.After the integral image is obtained, the sum of the pixel values of any rectangular region can be calculated.
Fast-Hessian Matrix
If P(x, y) represents a point in the image, the Hessian matrix H(P, σ) can be defined as a function of P and scale σ, as shown in Eq. 3:
( , ) ( , )
( , )
( , ) ( , )
xx xy
xy yy
L P L P
H P
L P L P
σ σ
σ = σ σ
. (3)
In the formula, Lxx(P, σ), Lyy(P, σ) and Lxy(P, σ) respectively represents the result that under the scale σ, the second-order partial derivative of the x, y and xy directions is taken for the Gaussian function G(σ) and then convoluted with the original image I. The value of the feature point can be obtained by calculating the Hessian matrix. Where
2 2 2
( )/2 2 1 ( ) 2 x y
G σ e σ
πσ − +
= .
To improve the speed of operation, approximate calculation is often used in practical applications, the determinant can be computed by Eq. 4:
2
( approx) xx yy ( xy)
Det H =D D −
ω
D . (4)Generate the Feature Point Descriptor
The descriptor of the SURF algorithm is based on the light intensity distribution of the pixels around the feature point.The calculation of the descriptor is divided into two parts. First, find the reproducible principal azimuth, and then calculate the 64-dimensional descriptor in a scale-related window based on this azimuth.
Determine the Principal Azimuth
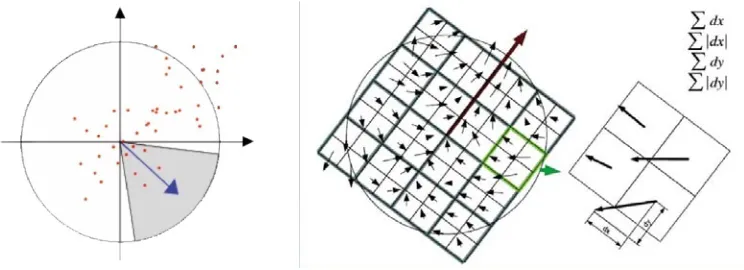
The purpose of determining the principal azimuth is to achieve the rotation invariance of the image. The steps are:
(1) Take the scale at which the feature point is detected as the sampling pitch s; (2) Let the length of the Haar filter be 4s, and the Haar wavelet response of each sampling point in the x and y directions is calculated in a circle with a radius of 6s centered on the feature point, and then multiplied by a Gaussian coefficient with a standard deviationσ=2s;
(4) Compare the size of all vectors, the largest of which is the principal azimuth of the feature points.
[image:4.612.128.500.107.242.2]
Figure 1. Find the principal azimuth. Figure 2. SURF descriptor generation schematic.
Descriptor Based on Haar Wavelet Response
The feature point descriptor is composed of a parallel and perpendicular Haar wavelet response to the principal azimuth.The following is the procedure for calculating the descriptor, and Fig. 2 is a schematic representation of the SURF descriptor.
(1) Take the feature point as the center, a virtual box with the principal azimuth as the horizontal axis x and the length of 20s is established as the area for calculating the Haar wavelet response.
(2) Divide this virtual box into 4×4 square sub-boxes, each containing 5×5 sample points.
(3) The Haar wavelet response of the 25 sampling points in the x and y directions is calculated using the Haar wavelet filter with the length of 2s and the Gaussian weight coefficient of the standard deviation σ = 3.3s, denoted as dx and dy.
(4) The response values in each sub-box and their absolute values are added to form a 4-dimensional vectorV =
(
dx, dy, d x,
d y)
. Thus, there is a 4×4×4 = 64-dimensional vector in each virtual box.(5) Normalize the 64-dimensional vector, and that’s the SURF descriptor.
Algorithm Implementation
The specific steps of the improved SURF algorithm are as follows: Step 1: Read the input image I;
Step 2: Use BEMD to decompose the image into five IMF components and one residue;
Step 3: Use the SURF algorithm to extract the feature points of the IMF layers and residue layer and generate the feature point descriptor;
Step 4: The descriptors at these feature points are normalized;
Step 5: Convert these points in the original image to the HSI color space, and the HSI vector is also normalized;
Step 6: Calculate the value of the inner product after normalization, and determine whether the value is equal to the preset threshold, if yes, it is assumed that the match is successful;
Experimental Results
In this experiment, three sets of experimental results are used to illustrate the test results. The three sets of images represent the detection results of copy-move, copy-scaling-move and copy-rotation & scaling-move forgery respectively.In order to illustrate the effectiveness of the proposed method, comparative experiments are conducted between the improved SURF algorithm and the algorithm in [9] and [10] in the same experimental environment. In Fig. 3, Fig. 4 and Fig. 5, (a) represents the original image. (b) represents the copy-move forgery image of (a). (c), (d), and (e) respectively represents the detection results of the algorithm in [9], [10] and this paper. The connected part of the figure is the detected copy-move source area and target area.
Copy-Move Forgery Detection
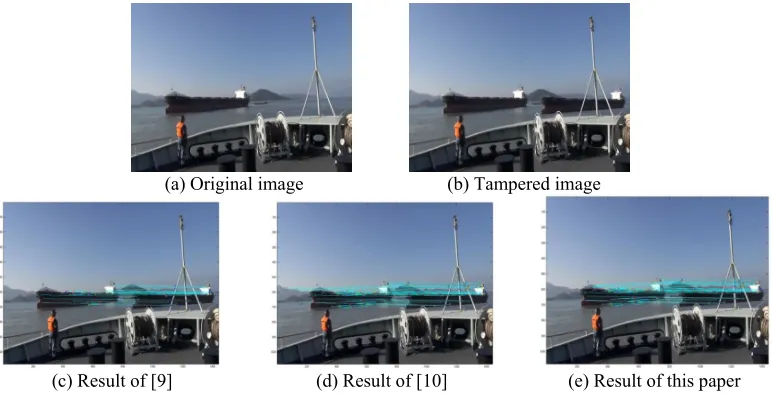
Fig. 3(a) is a VDR image of the front deck. By copying the "black freighter" and pasting it into the target area without any geometric transformation, the tampered image Fig. 3(b) is obtained. The detection results are shown in Fig. 3(c), Fig. 3(d) and Fig. 3(e), and the statistical results are shown in Table.1:
(a) Original image (b) Tampered image
(c) Result of [9] (d) Result of [10] (e) Result of this paper
[image:5.612.113.499.292.489.2]Figure 3. The detection results of copy-move forgery.
Table 1. The statistics of detection results.
Detection
results Algorithm in [9] Algorithm in [10]
Improved SURF algorithm Total number
of matching points
18 25 23
Number of mismatching
points
3 4 2
Proportion of
mismatching 16.7% 16% 8.7%
[image:5.612.182.429.534.664.2]the irrelevant matching points are fewer than those in [9] and [10], so the detection effect is better.
Copy-Scaling-Move Forgery Detection
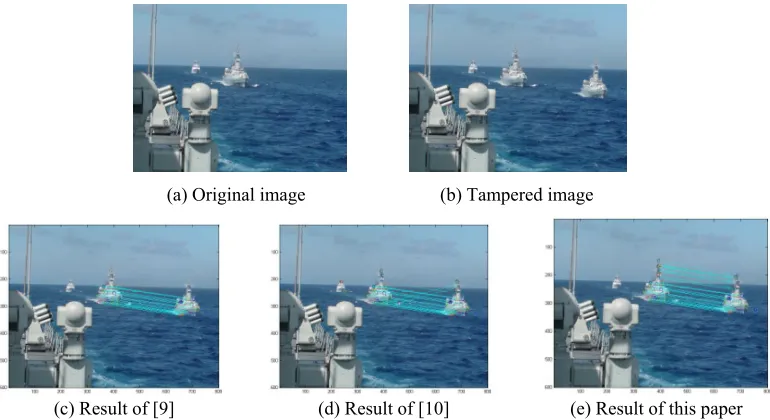
Fig. 4(a) is a VDR image of the port side, and Fig. 4(b) is a copy-scaling-move forgery image of Fig. 4(a). Copy the white ship in the middle of Fig. 4(a), scale it 0.8 times and paste it in the right side of the image, the tampered Fig. 4(b) is obtained. The detection results are shown in Fig. 4(c), Fig. 4(d) and Fig. 4(e), and the statistical results are shown in Table.2:
(a) Original image (b) Tampered image
(c) Result of [9] (d) Result of [10] (e) Result of this paper
[image:6.612.112.497.194.404.2]Figure 4. The detection results of copy-scaling-move forgery. Table 2. The statistics of detection results.
Detection results
Algorithm in [9]
Algorithm in [10]
Improved SURF algorithm Total number
of matching
points 14 18 22 Number of
mismatching
points 1 3 1
Proportion of
mismatching 7.1% 16.7% 4.5%
After scaling operation, the tampered region can still be detected, and the mismatching rate of this algorithm is still lower than the first two algorithms. Compare to the above experiment, it is found that the number of matching points and mismatching points both have decreased. The number of matching points is determined by the number of feature points, and the number of feature points is affected by the characteristics of the image itself. Therefore, the decline of matching points does not affect the conclusion of this experiment.
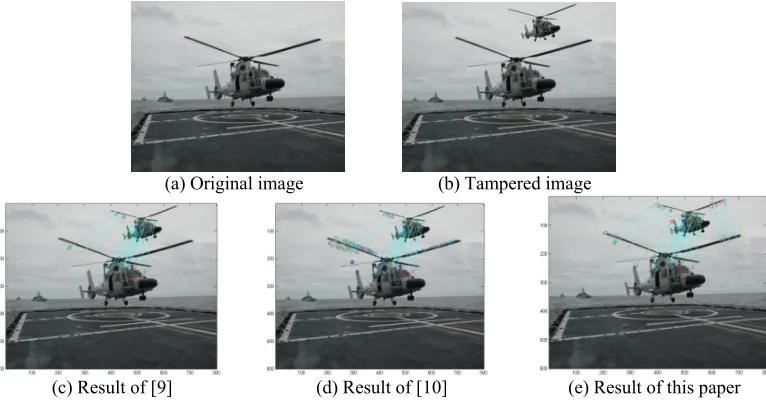
Copy-Rotation & Scaling-Move Forgery Detection
[image:6.612.185.429.447.575.2]counterclockwise by 5 degrees and scale it 0.5 times, then paste it in the upper right corner of the image, the tampered Fig. 5(b) is obtained. The detection results are shown in Fig. 5(c), Fig. 5(d) and Fig. 5(e), and the statistical results are shown in Table.3:
(a) Original image (b) Tampered image
[image:7.612.113.496.118.318.2]
(c) Result of [9] (d) Result of [10] (e) Result of this paper
[image:7.612.182.431.365.493.2]Figure 5. The detection results of copy-rotation & scaling-move forgery.
Table 3. The statistics of detection results.
Detection
results Algorithm in [9] Algorithm in [10]
Improved SURF algorithm Total number
of matching points
17 22 29
Number of mismatching
points
3 5 3
Proportion of
mismatching 17.6% 22.7% 10.3%
After rotation & scaling operation, the tampered region can still be detected, and the mismatching rate of this algorithm is still lower than the first two algorithms. Table.3 shows that the number of matching points is more in Fig. 5(e) than it in Fig. 5(c) and Fig. 5(d). And there are some unrelated feature points near the left wing in Fig. 5(d), which reduces the accuracy of the detection.
Conclusions
The reliability and accuracy of this method are verified through the testing of a large number of VDR image data. Some evaluations of this method are as follows:
(1) For the VDR image composed mainly of sea surface, sky and vessels, the method is successful in accurately detecting the forgery region, and the detection success rate is higher compared to the previous detection methods.
(4) This method is only applicable to one-pair copy-move forgery region, so new method is required to be found to detect multiple copy-move forgeries in same image.
Acknowledgement
This research was financially supported by National Natural Science Foundation of China (61471412, 61273262) and Natural Science Foundation of Liaoning (2015020086).
References
[1] Brown, Michael T. Marine Voyage Data Recorders. Transportation Recording: 2000 and Beyond. International Symposium on Transportation Recorders 1999. [2] Warnfeldt, Sten. How Can the VDR Prevent Accidents and Improve the Safety of a Vessel? Transportation Recording: 2000 and Beyond. International Symposium on Transportation Recorders 1999.
[3] Bayram, Sevinc, H. T. Sencar, and N. Memon. An efficient and robust method for detecting copy-move forgery. IEEE International Conference on Acoustics, Speech, and Signal Processing, ICASSP 2009, 19-24 April 2009, Taipei, Taiwan DBLP, 2009:1053-1056.
[4] Warbhe, Anil Dada, R. V. Dharaskar, and V. M. Thakare. A Survey on Keypoint Based Copy-paste Forgery Detection Techniques. Procedia Computer Science 78(2016):61-67.
[5] Huang, Norden E., et al. The empirical mode decomposition and the Hilbert spectrum for nonlinear and non-stationary time series analysis. Proceedings of the Royal Society A Mathematical Physical & Engineering Sciences 454.1971(1998): 903-995.
[6] Syrjala, S. Empirical Mode Decomposition in 2-D space and time: a tool for space-time rainfall analysis and nowcasting. Hydrology & Earth System Sciences 9.3(2005):71-76.
[7] Xu, Guanlei, X. Wang, and X. Xu. Improved bi-dimensional EMD and Hilbert spectrum for the analysis of textures. Pattern Recognition 42.5(2009):718-734.
[8] Bay, Herbert, T. Tuytelaars, and L. Van Gool. SURF: speeded up robust features. European Conference on Computer Vision Springer-Verlag, 2006:404-417.
[9] Shen, Xuan Jing, et al. Coloured image copy-move forgery detection based on SIFT and HSI. Jilin Daxue Xuebao 44.1(2014):171-176.