2016 International Conference on Wireless Communication and Network Engineering (WCNE 2016) ISBN: 978-1-60595-403-5
Map of Conductivity of Russian Arctic and Its Application
for the Wireless Communication
Yuri BASHKUEV
*, Ludmila ANGARKHAEVA,
Darima BUYANOVA
and Mikhail DEMBELOV
Institute of Physical Materials Science of the Siberian Branch of the Russian Academy of Sciences 6, Sakhyanova str., Ulan-Ude, 670047, Russian Federation
*Corresponding author
Keywords: Geoelectric section, Rocks, Electrical properties, Predictive map, Surface impedance, Surface electromagnetic wave.
Abstract. Predictive map of geoelectric sections of the Russian Arctic, necessary for calculation of propagation of VLF-MF radiowaves, is constructed. Taking into account the layered structure of the underlying medium, this map is capable of increasing the accuracy of electromagnetic field calculations by 1.5-3 times as compared to the Morgan-Maxwell map and ITU-R Recommendation P.832-2. The methodology of the geoelectric mapping is described. The studies of electrical properties of layered media by combined radio and geophysical methods in a variety of natural and geological conditions, and the proposed method of geoelectric mapping have resulted in the construction of a new generation of maps showing the electrical properties of the underlying medium that account for the layered structure of the crust and have no analogues in the world.
Introduction
The electric inhomogeneous geological medium distorts amplitude-phase structure of an electromagnetic field. As bedding of an earth's crust exerts a significant influence on a structure and a level of an electromagnetic field there was a necessity of the account of this factor. Essential increase of accuracy of calculations of an electromagnetic field in a wide frequency band (from VLF and up to MF-SF) became possible with use predictive maps of geoelectric sections (GES) that account for the layered structure of the underlying medium. These maps reflect the areal distribution of various GES types, with the electrical resistivity j (one is the inverse of the conductivity j=1/j), dielectric
permittivity j and thickness hj specified for each layer of GES. These parameters enable the
calculation of values of surface impedance , attenuation function W and field strength E in a wide
range of frequencies. The conductivity map of the world [1,2] now fails to meet practical requirements because it is constructed using the model of a homogeneous underlying medium. Well known are the effective conductivity maps of continents Morgan and Maxwell, the United States, Canada, Finland, Italy, Japan, and other countries, which systematize basic data on the electrical properties of rocks in terms of a homogeneous model of the medium [1,2]. These maps are made by results of measurements of field strength of LF-MF broadcasting stations. They are true for concrete frequencies of separate radio stations and cannot be used in a wide range of frequencies. Works on preparation of similar maps demand presence of widely developed network of radio stations and greater expenses. This calls for the construction of a new predictive map of geoelectric sections of territories of countries and continents of the world [3-6], that account for the layered structure of the underlying medium.
Geoelectric Mapping Method
An essential feature of the geoelectric mapping is a close relationship between physical and
geologicalgeographical approaches to the examination of the upper crust. The primary role in the
identification of individual GES types is attributed to geological, climatic, and geographic factors, and regular patterns in the formation of the upper GES are closely related to the surface conditions, physical properties, structure, and composition of rocks. The construction of a predictive map of GES parameters is meant here as the determination of the surface distribution of various GES types and the
estimation of the resistivity j and thickness hj of individual layers of the section throughout the
mapped area on the basis of a limited amount of filed geological data or measurement results. The
problem reduces to the determination of the GES type (e.g., 1 > 2 or 1 < 2) of a homogeneous
region and its boundaries and to the statistical estimation of the parameters j and hj. The
methodology of geoelectric mapping is based on the following premises [3-6]:
(1) there exists a correlation of the resistivity (conductivity) with lithological, hydrogeological, and frost parameters of rocks, their structure, and the GES spatial variation pattern;
(2) the resistivity of a particular rock type is a random quantity with a lognormal distribution; (3) the boundaries of regions with identical electrical properties coincide with geological boundaries, and the rock sequence is consistent;
(4) prediction is based on geological maps of bedrock and Quaternary deposits and filed vertical electrical soundings (VES) and drilling logs;
(5) the GES within the skin layer in the VLF range (f = 10 kHz) is generally represented as a two- to
four-layer structure; and
(6) in regions of relatively simple geological structure, prediction of GES parameters with an accuracy sufficient for practical purposes GES should be based on studying key sites (territory analogues) with the subsequent extrapolation of their characteristics to geologically similar areas.
These premises are taken as guiding principles for constructing predictive GES’s map of the region of North China, showing the distribution, interrelations, and characteristics of regions with different electrical properties.
Main Results and Discussion
The subject of our study, the upper crust of the Russian Arctic is characterized by a significant spatial inhomogeneity of its electrical properties. The initial data when constructing the map are: geological map of Globe of scale 1: 15 000 000; the GES predictive map of Yakutya of scale 1 : 2 500 000, compiled on the basis of the Yakutya experimental data on the electrical properties of the most widespread rocks [5]; archival VES data of the geology department of Yakutya and Buryatia; method of prediction of the geoelectric sections of tundra and mountain landscapes on the example of Nord-Eastern Euroasia [5]. When preparing the GES map, filed geophysical materials of the geology department of Yakutya are used. This map incorporated the data derived from geoelectric investigations in 1971-2015 in Institute of Physical Materials Science of the Siberian Branch of the Russian Academy of Sciences [3-6].
Figure 1 presents fragment of the predictive GES map of Russian Arctic. Information on GES maps
is expressed in codes defining the resistivities j and thicknesses hj of layers on a logarithmically
uniform scale. The logarithm of the discretization interval for j and hj is 0.333. The scale of j and hj
has three gradations per decade. Denoting the step number by N and using the formulas
j = 100.333(N-0.5) (in m), N = 0 ~ 15; hj = 100.333(N-3.5) (in m), N = 1 ~ 15
we calculated the median values of j and hj (Table 1).
The map codes (e.g., 9.7.5. ...) signify the following: the first number denotes the step on the
layer thickness scale (h1); the third and subsequent numbers denote the same parameters for the
[image:3.595.79.522.115.702.2]second and subsequent layers. The permittivity of the layers was set at j = 10.
Table 1. The scale of j and hj parameters of geoelectric sections.
Step number Median value j [m] Median value hj [m]
0 1 2 3 … 10 11
0.68 1.47 3.16 6.8
… 1470 3160
0.147 0.316 0.68
… 147 316
Figure 1. The predictive map of geoelectric sections of Russian Arctic (scale 1: 15 000 000).
territory. The predictive map of GES of Russian Arctic covers the territory defined by the meridians
00E - 190E, in the North - the Nord Pole of Globe, in the South – 63.5N and contains 15 types of
geoelectric sections. According to the map by Morgan and Maxwell, predicted territory of Russian
Arctic has one conductivity (=1/) gradation. The general background of territory is 10-3 S/m (
=1000 m).
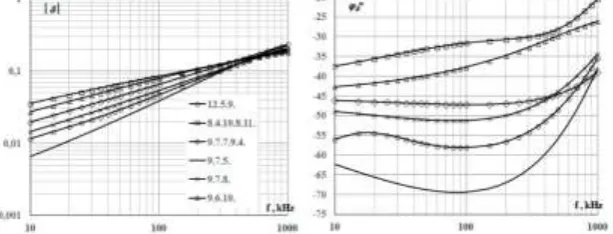
Figure 2 illustrates the frequency dependences of the modulus || and phase º of the surface
impedance for the most widespread GES types in Russian Arctic. The surface impedance of an n-layer
medium was calculated with the formula (n) = 1Q(n), which is convenient for numerical calculations
[5]. Here, 1 is the surface impedance of a homogeneous medium with the parameters of the first
layer, and Q(n) = F(f, j, j, hj) is the correction factor accounting for the underlying crustal layers. The expression for the correction factor is
1 1
) ( 12 1 1 ) ( 12 ) ( 2 exp 1 2 exp 1 h k i R h k i R Q z n z n n , where 1 1 1 1 1 1 ) ( ) 1 ( j j j j j j j j n j j R
is the coefficient of reflection on the interface between layers with numbers of j and j+1;
); 2
exp(
1 (j(n)j 1) jz j
j R i k h
; Θ sin2
0
jk
jz k
k k0 2/; j jk sin2Θ/jk,
for j=n Rn(n(n)1) 0, n 1; jk j i60j is related complex dielectric permittivity; hj is
thickness of layer number j; is angle of incidence of the plane vertically polarized wave on the
“Earth-air” interface. The monochromatic electromagnetic wave is assumed to vary with time as
exp(-it). Recurrent expressions showed above allow calculating frequency dependences of surface
impedance of multi-sectional media.
Analysis of the impedance modulus || and phase º shown in the GES map reveals a significant
range of their variation. For example, the values of || at a frequency of 10 kHz vary from 0.0065 to
0.04, and the impedance phase, from 36º to 65º; the respective variation ranges at 1000 kHz are 0.1
[image:4.595.145.452.547.664.2]to 0.39 and +28º to 42º.
Figure 2. Frequency dependences of the surface impedance modulus || and phase º for the most widespread GES types in Russian Arctic
Example of Calculation of the Attenuation Function and Level of the Electromagnetic Field at a Frequency of 300 kHz
At a frequency of 300 kHz works correction subsystem of radio navigation system “GLONASS”. On
the GES map areas with the code 9.6.5. have at f = 300 kHz highly-inductive impedance || = 0.096
module |W| and the electromagnetic field strength E for the power of the radiator 1 kW have shown that there is a surface electromagnetic wave (SEW). Field above highly-inductive path significantly
higher field over uniform path with = 1.5*10 -2 S / m and = 20 almost 25% at the 70 km from
transmitter (Figure 3).
Figure 3. Calculations attenuation function module |W| and the electromagnetic field strength E for the power of the radiator 1 kW: 1) highly-inductive path; 2) uniform path.
Summary
Predictive map of geoelectric sections (GES) of the Russian Arctic, necessary for calculation of propagation of VLF-MF radiowaves, is constructed. Taking into account the layered structure of the underlying medium, this map is capable of increasing the accuracy of electromagnetic field calculations by 1.5-3 times as compared to the Morgan-Maxwell map [1] and ITU-R Recommendation P.832-2: “World atlas of ground conductivities” [2]. With taken account of the topography and permafrost-ice cover, the GES maps make it possible to determine such an important
characteristic of the electromagnetic wave process as the field attenuation function W within a wide
range of electromagnetic waves. The W values in the model of a multisection impedance propagation
path are determined by solving numerically the Hufford or Feinberg integral equation. The accuracy
of predicting the electromagnetic field strength is (15~30)%. Calculations have shown the
emergence of SEW [6].
Acknowledgment
This study was financially supported by the grant of the Russian Science Foundation (project No 14-09-01079) at the Institute of Physical Materials Science of the Siberian Branch of the Russian Academy of Sciences.
References
[1] R. Morgan, E. Maxwell, Omega Navigation System Conductivity Map, Office of Naval Research, Washington, 1965.
[2] ITU-R Recommendation P.832-2: World Atlas of Ground Conductivities, 1999.
[3] Yu.B. Bashkuev, V.R. Advokatov, and L.Kh. Angarkhaeva, Maps of geoelectric sections in the Eastern Hemisphere, Fizika Zemli, 9 (2003) 87-94.
[4] Yu.B. Bashkuev, V.R. Advokatov, and L.Kh. Angarkhaeva, Predictive Map of geoelectric sections of North and South America, Universal Journal of Geoscience, 1(2) (2013) 84-89.
[5] V.P. Melchinov, Yu.B. Bashkuev, L.Kh. Angarkhaeva, and D.G. Buyanova, Electrical Properties of the Cryolithic Zone in the East of Russia in the Radio Range, BSC SB RAS publishing house, Ulan-Ude, 2006.