2016 International Conference on Mathematical, Computational and Statistical Sciences and Engineering (MCSSE 2016) ISBN: 978-1-60595-396-0
Based on Immune Optimization Algorithm and Hybrid Particle Swarm
Optimization Algorithm Research on Customized Bus Station Setting
and Route Planning
—
A Case Study of Customized Public
Transport in Wuhan, China
Zi-jian TAN
*, Jing-jing ZHOU, Su-hua ZHANG and Dong-fang ZHAO
School of Mathematics and Statistics, Central China Normal University, Wuhan 430079, China
*Corresponding author
Keywords: Customized bus, Genetic algorithm, Immune optimization algorithm, Hybrid particle
swarm optimization.
Abstract. Customized bus is a kind of new type of public transport service which is tailor-made for the people whose travel has a similar location, time, destination and so on. In 2013, it has appeared in China and landed in various cities successively. But the development around the situation is different, the study about this problem is few. Based on the immune optimization algorithm and particle swarm optimization algorithm, combined with the advantages of genetic algorithm, the paper forms a hybrid immune optimization algorithm and hybrid particle swarm algorithm. Considering the custom bus station settings, line planning and other aspects, we take custom bus in Wuhan City, Hubei Province as an example, and try to give a scientific and practical guidance to the development of customized public transport nowadays, so that it can get a further theoretical and practical basis on mathematics in its development and operation.
Introduction
City customized bus, also known as a business shuttle, is based on the "place of residence - work place - place of residence" mode of one-stop shuttle service. At the same time, it is somewhere between the ordinary bus and taxi, provided tailored new public transport service model for the similar needs of the crowd, such as a travel location, travel time, destination and other travel factors. Its concept is consistent with subscription bus service, which is the service commitment period for individual services commuter bus, proposed by America in 1958. In the customization of public transport services, the public can present their own travel needs to submit information to the operating company in the official website, then the operating company design bus lines based on individual passenger demand and the overall passenger flow and ensure that one person, one seat.
City customized bus services, is a new mode of transport exploration which advocate green commuting. With the nature of public services, customized bus is comfortable and convenient, even can reduce travel peak private car traffic and save energy. But because of its location and nature, customized bus pricing is also generally between the conventional bus and taxi, so the urban white-collar and private car owners become the “main force” at this stage.
The Present Situation and Strategy Analysis of Customized Public Transport in Wuhan
Development and Present Situation of Customized Public Transport in Wuhan City
Since August 2015, the first batch of customized bus lines since the opening, Wuhan customized bus start to service by the Wuhan Public Transport Company. By the end of September 1, 2016, there are 10 one-way (five pairs of two-way) customized lines opened, covering the prominent residential areas and working areas of the three towns and development zones in Wuhan, and effectively reduce blind zone of ordinary bus service as an extension of ordinary urban public transport services and
exploration.
Thus, although after several years of development, customized bus business in Wuhan has achieved initial success, it shortens the time commuters, improves the punctuality rate, reduces the need for private car travel, but there are some questions to be solved, like a low coverage, the high operating costs, etc.
Development and Strategy of Wuhan Customized Public Transport
Customized public transport has already had a certain effect on the development of Wuhan city. Apparently, there is still much room for improvement. And the customized bus, including the new line of site settings and route planning for the service passenger and operating costs control, is essential, so we mainly conduct the following two aspects of targeted research in terms of scientific and effective development strategy. At the same time, a new strategy is presented.
Site Settings. Site settings will influence whether passengers choose or not. The closer the distance of site from their position is, the better they feel. And the sites will not only affect the operating efficiency, but weaken the customized bus’s own advantages and loss of competitiveness. So the scientific set up of the site is critical. This paper mainly discusses the following factors:
(1) Radiation range of a single site;
(2) Minimize the distance from a single area (residential area / work place) to the nearest station; (3) The number of sites in a single area and its specific location.
Lines Planning. Due to the different road conditions and traffic conditions in the city, the factors such as construction and congestion may lead to the blind pursuit of the actual distance between the two points, but can’t get a comprehensive optimization of the route. What’s more, taking into account the scattered passengers and blind spot coverage and other factors in the layout of the road network, we need to take into account more factors:
(1) Minimize the total distance of the actual operating line;
(2) Considering the different time periods of construction, congestion and other urban traffic conditions;
(3) The choice of scatter points and blind spots coverage;
(4) The merger and split line (involving vehicles, drivers, operation and maintenance, line capacity, etc.);
(5)Minimize the overall cost.
Site Setting Based on Immune Optimization Algorithm (IA)
Immune Optimization Algorithm (IA)
In 1986, Farmer and others pioneered the study of the immune system, which inspired the immune system and developed an immune algorithm. It utilizes the diversity, generation and maintenance mechanisms of the immune system to ensure the diversity of the population. It can overcome the "premature" problem in general optimization, especially in multi-peak optimization, and finally obtain the global optimal solution.
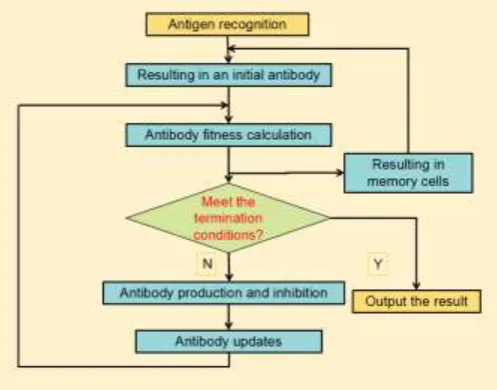
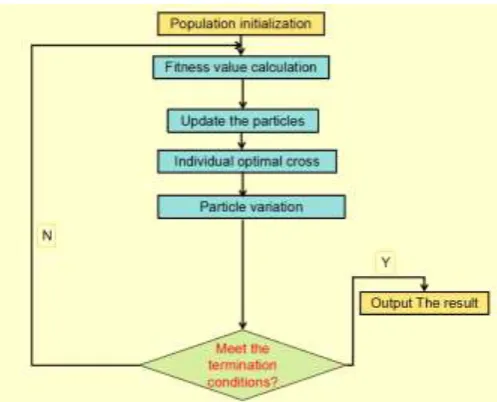
Steps of the Immune Algorithm. The specific implementation steps of the optimized immune algorithm (IA) are as follows[3]:
(1) Analysis of the problem: the analysis of the actual problem and its solution characteristics and design of the rational expression of the form;
(2) Generating initial antibody population: randomly generating N individuals and extracting m individuals from the memory pool to constitute the initial population, and m is the number of individuals in the memory;
(3)Evaluating the above antibodies: The antibody is evaluated according to the expected reproduction rate P of the individual;
(4) Formation of parental population: the initial population is arranged in descending order of expected reproduction rate; the first N individuals constitute the parent population, and the first m individuals are updated;
(5) Termination conditions to determine: If the termination conditions to meet, then the end, on the contrary continue to the next step;
(6) Producing offspring population: Based on the results of (4), the new population is selected, crossed and mutated, and the memory individual is taken out from the memory pool to form a new generation group;
[image:3.595.174.423.397.592.2](7) To perform step (3).
Figure 1. Optimization of the immune optimization algorithm process diagram.
Evaluation of Solution Diversity. (1) Antibody - antigen affinity: This indicator is used to reflect the degree of antibody recognition of the antigen, and the definition of affinity functionAvis:
N
i i N j M
ij M
j
ij ij i v
v
i i
Z C
Z d F
A
0 , 1 min
1 1
(1) Among them, Fv is the objective function; N{1,2,n}is the set of all the points to be optimized;
i
M is the set of candidate central sites whose demand points are less than s (iN,MiN); i is the
amount of demand to be optimized; dij is the distance from the point i to be optimized to the nearest
point to be optimized. If the requirement of the user is configured by the point j to be optimized, it takes the value 1 and the value 0 otherwise.
Where the second term in the denominator gives a penalty measure for the solution to the distance constraint, and C is a large positive number[4].
(2) Antibody-antibody affinity: This reflects the degree of similarity between antibodies and is calculated by using the R-bit continuous method. The R-bit continuous method is proposed by Forrest et al., Which is actually a partial matching rule. In this rule we need to determine the value of R that represents the threshold for affinity determination. If more than R-bit or continuous R-bit encoding of two individuals encoding is the same, the two antibodies are approximately the same, otherwise that is different. In the antigen encoding method, you do not need to consider between the sorting, and can refer to the deformation of the R-bit continuous method to calculate the affinity between antibodies, that is:
L k Svs vs
, ,
. (2) In this formula, kv,s is the same number of bits of antibody v as antibody s, and L is the antibody
length.
(3) Antibody concentration: antibody concentration, that is, the proportion of similar antibodies in the population, that is:
N j
s v
v S
N
C 1 ,
. (3)
In this formula, N is the total number of antibodies; ;
others T S Svs vs
, 0
, 1
{ ,
,
T is a preset threshold.
(4) Expected reproductive probability: In the population, the expected reproductive probability of each individual is determined by the affinity between antibody-antigen Av and antibody
concentration Cv, that is:
v v v
v
C C A
A
P ( 1)
. (4) Among them, is a constant.
It can be seen from the above equation, the higher the individual fitness, the greater the expected breeding probability, and vice versa; the greater the individual concentration, the expected reproductive probability is smaller, and vice versa. In this way, individuals with higher fitness are encouraged, and the individual with higher concentration is inhibited, thereby it can ensure the quality and variety of the individual.
The immune optimization algorithm in the above inhibition of high concentrations of individual, may also affect and inhibit the highest affinity of individuals, leading to the loss of the optimal solution, so we take the elite retention strategy, in each update memory library, the first number of individuals with the highest antigen affinity is retained in the memory bank, and the remaining outstanding individuals in the population are stored in the memory according to the expected breeding probability.
Site Settings Problem Description. In the model of site settings, we may make the following general assumptions:
(1) The total capacity of a single site meets the current day of travel demand in its radiation range; (2) A single travel demand for a single passenger corresponds to a single waiting site;
(3) Do not take into account the cost of walking to the site.
This model is a location / allocation model, and in the case of satisfying the upper limit of the distance, it is necessary to obtain the optimal configuration of each station from n passenger source points.
The objective function minimizes the sum of the product of the distances arrived at configured station from starting point of passengers by walk:
N i j M
ij ij i i Z d F min
. (5) s.t.
i M j ij Z Ni , 1
. (6)
j ij
i Z h
M j N
i
, :
. (7)
p h N i i M j j
,. (8)
} 1 , 0 { , : ,
i N j Mi Zij hj
. (9)
s d M j N
i i ij , :
. (10) Among them, Fv is the objective function; N{1,2,n}is the set of all the points to be optimized;
i
M is the set of candidate central sites whose demand points are less than s (iN,MiN); i is the
amount of demand to be optimized; dij is the distance from the point i to be optimized to the nearest
point j to be optimized; Zij is a 0-1 variable, it indicates the relationship between the user and the
point to be optimized. If the requirement of the user is configured by the point to be optimized, it takes the value 1 and the value 0 otherwise; p is the number of sites selected as a rough estimate of the available cluster centers, and s is the upper limit of the radiation range of the newly created site.
Examples Detailed
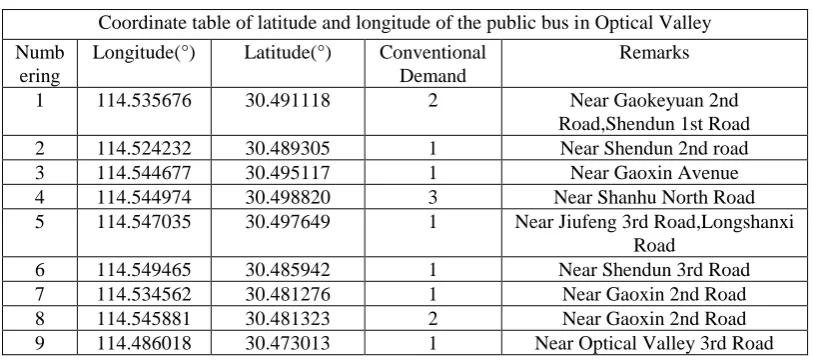
[image:5.595.95.502.621.801.2]Taking Optics Valley of Wuhan City that bring the commercial circle, university town and high-tech workplace together as an example, according to the feedback of the demand for customized bus trips, we get the following coordinates (See Table 2-1). If the bus company plans to open lines, as much as possible to meet the travel demands of the above applications. According to the known location coordinates, the following table is a customized bus operator, planning out the customized bus-related site settings in this area.
Table 1. Optical Valley area customized bus location on the bus location.
Coordinate table of latitude and longitude of the public bus in Optical Valley Numb
ering
Longitude(°) Latitude(°) Conventional Demand
Remarks
1 114.535676 30.491118 2 Near Gaokeyuan 2nd
Road,Shendun 1st Road
2 114.524232 30.489305 1 Near Shendun 2nd road
3 114.544677 30.495117 1 Near Gaoxin Avenue
4 114.544974 30.498820 3 Near Shanhu North Road
5 114.547035 30.497649 1 Near Jiufeng 3rd Road,Longshanxi Road
6 114.549465 30.485942 1 Near Shendun 3rd Road
7 114.534562 30.481276 1 Near Gaoxin 2nd Road
8 114.545881 30.481323 2 Near Gaoxin 2nd Road
10 114.476711 30.464857 1 Near Gaoxin 4th Road, Fozuling 2nd Road
11 114.482029 30.462694 1 Near Gaoxin 4th road, Fozuling 3rd Road
12 114.473100 30.468484 2 Near Liufang 4th Road, Fozuling 1st Road
13 114.480359 30.465745 1 Near Fozuling 3rd Road
14 114.485937 30.491137 1 Near Optical Valley 3rd Road, Gaoxin Avenue
15 114.479361 30.491678 1 Near Gaoxin Avenue
16 114.444220 30.456055 2 Near Optical Valley 1st Road, Gaoxin 4th Road 17 114.438152 30.459040 1 Near the financial port 4th Road 18 114.428378 30.457639 1 Near Optical Valley Avenue 19 114.416040 30.455978 2 Near Wudayuan Road, Wudayuan
3rd Road
20 114.432551 30.454771 1 Near Gaoxin 4th Road
21 114.408112 30.449428 1 Near Binhu Road, Tangxun Lake North Road
22 114.407237 30.461215 1 Near University Park Road 23 114.429299 30.462616 1 Near the financial port 3rd Road
24 114.415479 30.461951 3 Near Wudayuan 1st Road
25 114.413826 30.481265 1 Near Guanshan Avenue, Software Park Road
26 114.411706 30.483645 1 Near Nanhu Avenue, Software Park Middle Road
27 114.408625 30.483054 1 Near Software Park Middle Road
28 114.417770 30.488563 1 Near Guanshan Avenue
29 114.420743 30.482509 1 Near Guannanyuan 2nd Road
30 114.423402 30.477429 1 Near Optical Valley Avenue, Guannanyuan Road
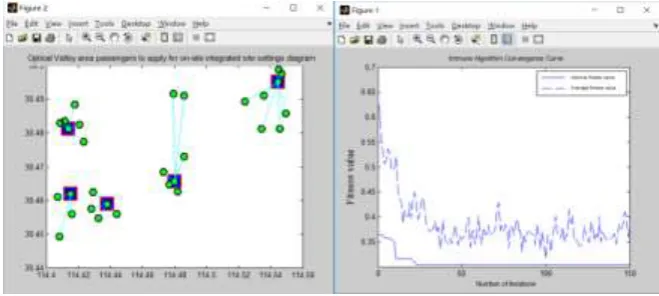
In the above figure, the above demand points can be classified into five categories, but we still need accurate calculation, in order to accurately classified to facilitate the passengers ride, and get the optimal number of sites.
At first the number of bus stations N is set to 5, then we calculate the distance the application points and the corresponding points after planning cluster. Next judge whether the corresponding number of sites should be increased or not until the distances between the application points and the corresponding points is not more than the maximum distance that the passengers can tolerate (the actual distance is taken).
[image:6.595.132.462.618.766.2]For planning the number of bus stations N=5, we will cluster the above 30 vehicle application points, and determine the location of the nearest corresponding site as follows:
At this point, we can get the relationship between the application points and the corresponding points near the site and the walking distances, as shown in the following table:
Table 2. The relationship between the application station and the nearest station and the walking distance. The name of the station Apply for the nearest bus
station number
Maximum walking distance(km) Gaoxin Avenue Future
Science and Technology City
1~8 2.6
Fozuling 3rd Road,Gaoxin 4th Road
9~15 4.7
Financial Center Fourway Huijin Center
16~18,20~23 1.2
Wudayuan 1st Road,Wudayuan East Road
19,21,22,24 2.5
Software Park Road, Guanshan crossing
25~30 1.3
Obviously, in this only five sites set up under the Gaoxin, Avenue Future Science and Technology City, Fozuling 3rd Road, Gaoxin 4th Road and Wudayuan 1st Road, Wudayuan East Road, these three sites, the maximum actual distances by walk are more than 2km. obviously it can not meet the requirements of the passengers and satisfaction, so we should increase the number of sites set.
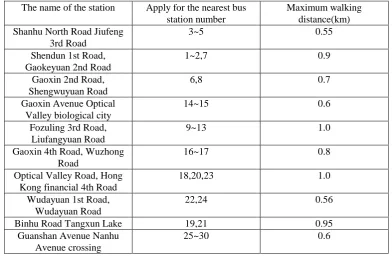
[image:7.595.157.439.371.499.2]Through the coordination calculation, we will set the number of sites N=10, it can meet the profit maximization of the passengers and carriers.
Figure 3. Set the number of sites N=10 when the site planning diagram.
Table 3. The relationship between the application station and the nearest station and the walking distance
The name of the station Apply for the nearest bus station number
Maximum walking distance(km) Shanhu North Road Jiufeng
3rd Road
3~5 0.55
Shendun 1st Road, Gaokeyuan 2nd Road
1~2,7 0.9
Gaoxin 2nd Road, Shengwuyuan Road
6,8 0.7
Gaoxin Avenue Optical Valley biological city
14~15 0.6
Fozuling 3rd Road, Liufangyuan Road
9~13 1.0
Gaoxin 4th Road, Wuzhong Road
16~17 0.8
Optical Valley Road, Hong Kong financial 4th Road
18,20,23 1.0
Wudayuan 1st Road, Wudayuan Road
22,24 0.56
Binhu Road Tangxun Lake 19,21 0.95
Guanshan Avenue Nanhu Avenue crossing
[image:7.595.101.494.543.799.2]As shown in the above table, the maximum distance from the bus station to the nearest bus stop is not more than 1km, which can meet the needs of minimizing pedestrian distance, and within 1 km Walking distance is acceptable.
Thus, the number of sites in the above area should be less than 10, then we can optimize the comprehensive interests of the operating efficiency of the company and passenger convenience.
Line Planning Based on Hybrid Particle Swarm Optimization(PSO)
Hybrid Particle Swarm Optimization
Particle Swarm Optimization. Particle Swarm Optimization[5](PSO) algorithm, derived from the study of bird predation behavior. The easiest and most effective way to find food when birds are preying is to search the area around the bird that is nearest to the food. Particle Swarm Optimization (PSO) algorithm is inspired by the behavioral characteristics of this biological population and used to solve the optimization problem. Each particle in the algorithm represents a potential solution to a problem. Each particle corresponds to the fitness value decided by a fitness function. The velocity of the particles determines the direction and distance of particle movement, and the velocity can be dynamically adjusted according to the movement experience of the particles and other particles, so as to realize the individual optimization in the solvable space[6].
Steps of Hybrid Particle Swarm Optimization. Supposed that in a D-dimensional search space, a population of n particlesX(X1,...,Xn), where the i-th first particle is represented as an N-dimensional
vector T
iD i
i x x
X ( 1,..., ) , it represents the position of the i-th particle in the D-dimensional search space
and also represents a potential solution to the problem[7]. According to the objective function, the fitness value corresponding to each particle position Xi can be calculated. The velocity of the i-th particle is T
iD i
i V V
V ( 1,..., ) , its individual extremum is
T iD i
i P P
P ( 1,..., ) , the population extreme value of population is T
gD g
g P P
P ( 1,..., ) .
During each iteration, the particle updates its own velocity and position through the extremes of the individual and the population extremum, that is:
) (
) ( 2 2 1
1
1 k
id k gd k
id k id k
id k
id V cr P X c r P X
V
. (11)
1
1
k id k id k
id X V
X
. (12) Among them, is a inertia weight (the value of which has certain influence on the model);
D
d1,2,..., ;i1,2,...,n;k is the current number of iterations; Vid is the speed of particles; c1 and c2
are non - negative constant, called the acceleration factor; r1 and r2 are random number distributed in
the interval [0,1]. At this time, in order to prevent the blind search of the particles, the position and speed of the particles are limited to a certain interval [Xmax,Xmax]、[Xmax,Xmax].
However, the standard particle swarm optimization (PSO) algorithm achieves the extreme value optimization by following the extreme value and extreme value of the population[8]. Although the operation is simple and can converge quickly, with the increase of the iteration number, the particles is so similar that it may not be out of the surrounding of the local optimal solution, and come into a local optimum when the population is converging.
Figure 4. Flowchart of traveling salesman problem (TSP) with hybrid particle swarm optimization.
The Optimal Path Selection of Urban Area between Two Points
As the city's road traffic conditions affected by many factors, such as: a closed road caused by road construction, detour congestion caused by sudden accidents, slow traffic caused by traffic surges or traffic control and so on. Therefore, the actual distance between the two sites unilaterally, to measure the shortest route of customized bus, may not be scientific and ideal, and it may avoid the appropriate detour route but into a long period of traffic congestion .We need to take into account double standard the shortest distance and shorter travel time, so we need more scientific planning indicators as a measure[9].
As a result, we define a new indicator: the commute index between two points arriveijt, to show the
commute status from point i to point j at time t. Since at the same time t, the two-way traffic in the peak traffic may appears tidal phenomenon, without set tide lane, we generally believe that arriveijt is
not necessarily equal to arrivejit (i.e., commuter indicators i and j may not have subscript symmetry).
Here we introduce this commute index arriveijt:
We define
ij ijt ij ijt
T t dist
arrive
. (13) Among them, arriveijt represents the commute index from point i to point j at time t; distij
represents the actual distance between place i and place j; tijt represents the actual transit time at time
t; Tij represents the time from point i to point j at the recommended speed when the city coast of the
same level is clear. For the commuter index, the smaller the value of the same two stations, the better it is.
Thus, in the application of the algorithm, we use the commuting indicator between the two points to replace the actual length of the original single point between the two points, more scientific planning which can plan the line direction of customized bus service more scientifically.
Examples Detailed
Table 4. The site to be planned and its travel time information.
Site Information Travel
time
The area
Longitude(°) Latitude(°) Site name
114.330826 30.487735 Nanhu Avenue Ma Lake 8:00 Nanhu
Area 114.326298 30.503263 Nanhu Road Jiangnan Village 8:00
114.342054 30.502425 Book City Road to Green Town 8:00
114.420913 30.507035 Optical Valley Times Square 9:00 Optical Valley Area 114.428503 30.497805 Optical Valley Avenue, L. Romantic City 9:00
114.437818 30.510233 Jiayuan Road Optical Valley International 9:00 114.434724 30.498704 Gaoxin Avenue Jiayuan Crossing 9:00 114.452914 30.504651 Optical Valley 1st Road Heyeshan Road 9:00
From this we can see that the planned route to be completed early morning peak hours from the South Lake region (residential) to the Optical Valley area (work) commuting task, hope to meet passengers to maximize the rapid arrival of the destination Of the travel needs, and make the cost of operating companies to optimize, that is measured under the commuter index of the optimal circuit design and planning.
[image:10.595.55.541.405.517.2]To do this, we need to know the specific optimal commute between sites. We take the calculation between the station "Jiayuan Road Optical Valley International" and the "Optical Valley 1st Road Heyeshan Road" as an example. The calculation of the optimal commutation index between the other sites is similar. Among them, the optimal traffic commutation calculation between the station "Jiayuan Road Optical Valley International" and the "Optical Valley 1st Road Heyeshan Road" is shown in the following table:
Table 5. Calculation Table of Optimum Commuting Indicators between Two Sites.
The starting
site Optimal Alternative Line
distij (km)
tijt (h)
Tij (h)
arriveijt (km)
End to the site
Jiayuan Road Optical Valley International
Jiayuan Road - Luo Yu Road - Optical
Valley 1st Road 2.3 0.13 0.058 3.44 Optical
Valley 1st Road Heyeshan
Road Jiayuan Road - Optical Valley Venture
Street - Optical Valley 1st Road 2.6 0.15 0.074 3.7 Jiayuan Road - Magnolia Road -
Wenyuan Road - Optical Valley 1st Road
2.4 0.15 0.069 3.54
From this, we choose the most excellent commuter route. The first alternative line "Jiayuan Road - Luo Yu Road - Optical Valley all the way", planning site from "Jiayuan Road Optics Valley International" to "Optical Valley 1st Road Heyeshan Road".
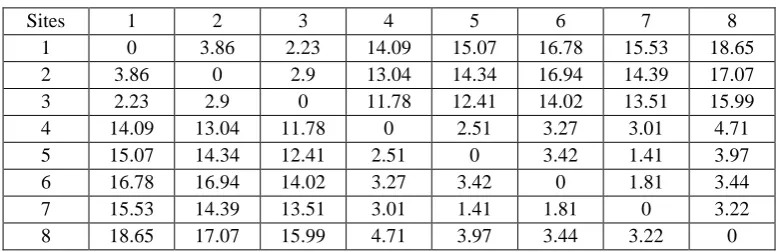
So the optimal inter-communion index table and the optimal path direction table of the eight planned routes between the stations are obtained. According to the actual road traffic situation, the default bi-directional traffic condition is similar, as shown in the following table:
Table 6. Computation Table of Optimum Commuting Indicators between Sites.
Sites 1 2 3 4 5 6 7 8
1 0 3.86 2.23 14.09 15.07 16.78 15.53 18.65
2 3.86 0 2.9 13.04 14.34 16.94 14.39 17.07
3 2.23 2.9 0 11.78 12.41 14.02 13.51 15.99
4 14.09 13.04 11.78 0 2.51 3.27 3.01 4.71
5 15.07 14.34 12.41 2.51 0 3.42 1.41 3.97
6 16.78 16.94 14.02 3.27 3.42 0 1.81 3.44
7 15.53 14.39 13.51 3.01 1.41 1.81 0 3.22
8 18.65 17.07 15.99 4.71 3.97 3.44 3.22 0
[image:10.595.103.494.621.747.2]Then we get that the 8: 00 ~ 9: 00 am peak period, the optimal commuter route from the Nanhu Bus Station to the station is completed as follows:
[South Lake bus station] - South Lake Road - [South Lake Road Jiangnan Village] - Wen Xin Street - Bookstore Road - [Book City Road to Green Town] - Book Street - Wen Street - Jian'an Street - Heng On Road - South Lake Avenue - [South Lake Avenue Ma Lake] - South Lake Avenue - High School Road - Optical Valley Avenue - [Optical Valley Avenue Laguna Man City] - Optical Valley Avenue - New Avenue - [high-tech Avenue Jiayuan junction] - Optics Valley Road - [Optical Valley all the way Lotus Hill Road] - Optics Valley Road - Luo Yu Road - Jiayuan Road - [Jiayuan Road Optical Valley International] - Jia Yuan Road - Optical Valley venture Street - [Optical Valley Times Square] - Optical Valley Venture Street - Guanshan Avenue - Xiong Chu Street (elevated) - Luoshi Road - Wen Xin Street - South Lake Road - [South Lake bus station].
Thus, we get the optimal planning direction of customized commuter routes. On the basis of it, we can optimize the interests of passengers and operating company.
Summary
China's urban customized bus services, with its unique advantages in the large and medium-sized cities generally have a good momentum of development, even though there are some differences in development of different localities, but using scientific means to manage customized bus lines, has a positive practical significance for improvement of passenger satisfaction degree and the company’s profit.
In this paper, we focus on the customization of bus line services, mainly to seize the site setting and line planning these two major factors, which explore the scientific planning of customized bus lines, taking into account the passenger and operating company's comprehensive optimization interests. With improved immune optimization algorithm, the corresponding feasibility analysis and conclusion are obtained by MATLAB and other software.
References
[1] Spall J C. Introduction to stochastic search and optimization. New Jersey: Wiley Inter-Science, 2003.
[2] Camazine S, Dneubourg J, Franks N R,et al. Self-organization in biological systerms. Princeton: Princeton University Press, 2003.
[3] G.E. Liepins, M.D.Vose, “Representational issues in genetic optimization”, Journal of Experimental Theory and Instruments, vol.2, no2, pp.4-30,1990.
[4] Lei Yingjie, Zhang Shanwen, Li Xuwu, Zhou Chuangming. MATLAB genetic algorithm toolbox and its application[M]. Xi’an: Xidian University Press.2005.4.
[5] Shi F, Wang H, Yu L, Hu F.30 cases analysis of MATLAB intelligent algorithm[M].Beijing: Beijing University of Aeronautics and Astronautics Press.2011.7.
[6] Yang J. A Genetic Algorithm Research for Solving Constrained Optimization Problems[D]. Liao ning: Dalian Marine University.2013.6.
[7] Kennedy J, Eberhart R C. Particle swarm optimization[A]. Proceedings of IEEE International Conference on Neural Network[C]. New York: IEEE Press, 1995:1942-1984.
[8] Deb K, Agrawal S.A niched-penalty approach for constraint handling in genetic algorithms[J]. Computer Methods in Applied Mechanics Engineering, 2000,186:311-338.