THE ROLE OF HBD-2 AND HBD-3
IN HUMAN T CELL DEVELOPMENT
DAWEI CHEN
A thesis submitted in partial fulfilment of the requirements of the University of East London for the degree of Doctor of Philosophy
II
Abstract
Human β-defensins (hBDs) are a family of cationic peptides able to directly kill a wide
range of microorganisms including bacteria, fungi and viruses. In addition to their
antimicrobial activities, defensins also contribute to the modulation of both the host
innate and adaptive immunity. In this project, we demonstrate that the αCD3/28
co-stimulation of human CD4+ T cells in the presence of 10µg/ml hBD-2 or hBD-3
together causes an up-regulation in numbers of CD4+CD69+CD25+ and CD4+CD69
-CD25+ T cell subsets, indicating that the treatment of hBD-2 and 3 enhances CD4+ T
cell activation. Consistent with this finding, proliferation assay using CFSE suggests
that hBD-2 and hBD-3 treatment in vitro induces the proliferation of CD4+ T cells
following by 96hrs culture. Analysis of expression of the regulatory T cells (Tregs)
specific marker, FoxP3, reveals a shift in the CD4+CD127-CD25+ Treg subset at 18hrs.
However, at the later time point, we found that the percentage of FoxP3+cells decreased
in the CD4+CD127-CD25+ Treg population, whereas the presence of the FoxP3+
CTLA-4+ Treg subset increased. These data indicate that Treg suppressive function may be
potentially defective following the co-incubation of purified T cells with either hBD-2
or hBD-3 for 42hrs in vitro due to the apparent loss of FoxP3 expression. We further
characterise the role of hBD-2 and hBD-3 in driving human CD4+ T cells polarisation.
Our in vitro data suggests that treatment with hBD-2 and hBD-3 can not only induces
effector T cell (Teff) differentiation into RORγt+T-bet+ (Th17/Th1) cells, but can also
trigger the differentiation of Treg expressing RORγt and T-bet rather than the master
controller of Treg function, FoxP3. This apparent plasticity of T cell phenotype allows
them to convert from Treg to Th1/17-like effector T cell phenotype following 18hrs in
culture. By 42hrs in culture, treatment with hBD-2 and hBD-3 induced both Teff cell
III
treatment with hBD-2, treatment with hBD-3 induced a more pronounced effect to
increase levels of RORγt in CD4+ T cells. This elevated expression may, in turn, be
responsible for the induction of higher IL-17A secretion. Consistent with this idea, it
was found that treatment with hBD-3 but not hBD-2 was capable of inducing the higher
level of secretion of IL-17A. Additionally, treatment with hBD-3 induced an increased
expression of IL-6, which is capable of driving the differentiation of naïve T cells
towards IL-17-producing Th17 cells. Functionally, using the Treg suppression assay,
the data suggested that hBD-2 may dampen down Treg cell ability to induce
suppression of Teff cell activity. Interestingly, co-culture with hBD-2 would also appear
to increase Teff cell resistance to Treg immunoregulation in vitro. Further investigation
using microarray gene analysis revealed chemokine C-C motif ligand 1 (CCL1) as
potential genes responding to hBD-2 treatment. The blockade of CCL1 has been
reported to inhibit Treg suppressive function. Thus, this study explored the function of
these antimicrobial candidates in regulating CD4+ T cell plasticity which could result in
hBD-2 and hBD-3 being able to regulate its own production, but also may regulate Treg
and Teff cell development and function, thus strengthening the link between innate and
IV
Table of Contents
Abstract ... II List of Tables ... VII List of Figures ... VIII Abbreviations ... X Acknowledgement ... XI
Chapter 1: Introduction ... 1
1.1 Antimicrobial peptides ... 1
1.2 Multifunctional role of Human β-defensins in immune system ... 3
1.2.1 Antimicrobial activity of hBDs ... 3
1.2.2 hBDs regulate pro-inflammation in innate immune responses ... 5
1.2.3 hBDs regulate pro-inflammation in T-cell-mediated adaptive immune response……….7
1.3 Research aims ... 12
1.4 Research objectives ... 12
Chapter 2: Methodology ... 13
2.1 Ethical approval ... 13
2.2 Antibodies and reagents ... 13
2.3 Isolation and activation of human PBMCs ... 13
2.4 Purification of human CD4+ T Cells ... 14
2.5 Enzyme linked immunoabsorbent assay (ELISA) ... 15
2.6 Cell Proliferation assay ... 15
2.7 Flow cytometry ... 16
2.8 RNA extraction ... 16
2.9 Micro-array assay ... 17
2.10 Quantitative RT-PCR ... 18
2.11 Treg/Teff sorting and Treg suppression assay ... 19
2.12 FACS gating strategy ... 20
2.13 Statistical analysis ... 20
Chapter 3: Effects of hBD-2 on whole PBMCs population ... 22
3.1 Introduction ... 22
3.2 Results ... 24
3.2.1 Treatment with hBD-2 up-regulates the number of percentage of FoxP3+ cells in CD4+CD25high T cells at 18hrs, but down-regulates FoxP3+ cells at 42hrs………24
V
3.2.3 Co-culture with hBD-2 reduces induction of T cell apoptosis at 18hrs but
enhances levels of apoptosis at 42hrs... 32
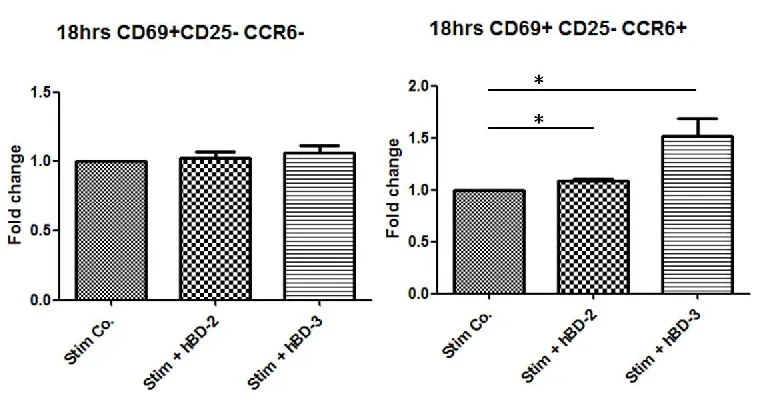
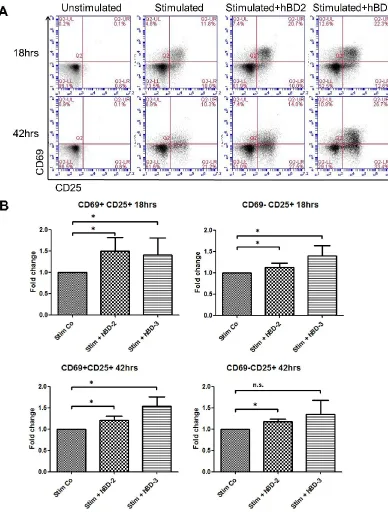
3.2.4 hBD-2 and hBD-3 induce the appearance of a CD69+CD25-CCR6+ subset at 18hrs, but at 42hrs, hBD-2 and hBD-3 induced the appearance of a CD69+CD25+CCR6- subset and a CD69-CD25+CCR6- subset. ... 34
3.3 Discussion ... 39
3.4 Conclusion ... 42
Chapter 4: Effect of hBD-2 and hBD-3 on purified human CD4+ T cells ... 43
4.1 Introduction ... 43
4.2 Results ... 45
4.2.1 hBD-2 treatment in purified CD4+ T cells induces an increase in the percentage of FoxP3+ cells in human CD4+CD25high T cells by 18hrs, but suppresses the Foxp3+ cells by 42hrs. ... 45
4.2.2 Proliferation of CD4+ T cells was increased following treatment with hBD-2 and 3 for 72hrs and 96hrs. ... 50
4.2.3 FoxP3 and CTLA-4 expression of CD4+ T cells co-cultured with hBD-2 and 3………52
4.3 Discussion ... 57
4.4 Conclusion ... 64
Chapter 5: Regulation of human CD4+ T cell plasticity following treatment with hBD-2 and hBD-3 ... 65
5.1 Introduction ... 65
5.2 Results ... 67
5.2.1 Intracellular staining of RORγt, T-bet and FoxP3 in human CD4+ T cells culture at 18hrs ... 67
5.2.2 Intracellular staining of RORγt, T-bet and FoxP3 in human CD4+ T cells culture at 42hrs. ... 71
5.2.3 Phenotyping of CD4+CD25+ T cells in the presence or absence of hBD-2 and 3………75
5.3 Discussion ... 77
5.4 Conclusion ... 81
Chapter 6: Function assay of human CD4+CD25+CD127- Treg cells in the presence of hBD-2 in vitro ... 82
6.1 Introduction ... 82
6.2 Results ... 83
6.2.1 Treatment of human CD4+ T cells with hBD-2 may not only enhance Teff cell resistance to suppression but also result in a defective ability of Treg cell to mediate suppression. ... 83
6.3 Discussion ... 87
6.4 Conclusion ... 92
VI
7.1 Introduction ... 93
7.2 Results ... 93
7.2.1 hBD-2 regulates human CD4+ T cell gene expression at 18hrs and 42hrs………93
7.2.2 Preliminary results of qPCR indicate that certain genes are differently expressed in hBD-3 treated human CD4+ T cells relative to the untreated control………101
7.3 Discussion ... 103
7.4 Conclusion ... 107
Chapter 8: General Discussion and Future Directions ... 109
8.1General discussion ... 109
8.2 Future directions... 115
8.2.1 Using naïve T cells ... 115
8.2.2 Further investigation on CCL1 signaling ... 116
8.2.3 Further validation of the other genes found in Microarray analysis ... 117
8.2.4 Characterization of β-defensins using in vivo models ... 117
8.2.5 DefbΔ9/DefbΔ9 mice ... 118
8.2.6 Epigenetic/post-translational level study ... 119
8.2.7 Allergy ... 119
8.3 Concluding remarks ... 120
References ... 121
Appendix ... 130
Appendix 2.1 NHS Ethical Approval... 130
Appendix 2.2 The UREC Sponsorship Confirmation Letter ... 134
Appendix 2.3 Quality Control of Affymatrix Microarray analysis... 135
Appendix 2.4Calculation for qRT-PCR ... 136
Appendix 2.5 Melting curve ... 138
Appendix 3.1 Gate stratergy for FoxP3 staining in CD4+CD25High T cells in human PBMCs. ... 139
VII
List of Tables
Table 1.1 The antimicrobial activities and immunomodulatory function of hBD-2 and
hBD-3………..10
Table 2.1 Primers used in RT-PCR experiment. ………..19
Table 6.1 Codes for different population of Teff and Treg cells with or without
VIII
List of Figures
Figure 1.1 The solution structure of hBD-2 (PDB ID: 1FQQ) and hBD-3 (PDB ID: 1KJ6)……….3 Figure 3.1 hBD-2 treatment induced the percentage of FoxP3+ cells in CD4+CD25high T cell population at 18hrs, but down-regulates the percentage of FoxP3+ cells in the same subsets at 42hrs………27 Figure 3.2 hBD-2 treatment induces CD4+ T cells proliferation in vitro. ………….…30 Figure 3.3 hBD-2 treatment induces CD8+ T cell proliferation in vitro. ………..31 Figure 3.4 Annexin-V staining on CD4+ T cells at 18hrs and 42hrs. ………33 Figure 3.5 CCR6 staining on CD4+ T cells in human PBMCs culture. ……….35 Figure 3.6 hBD-2 and hBD-3 induced increase of CD69+CD25-CCR6+ T cell subset at 18hrs. ………..36 Figure 3.7 hBD-2 induced both CCR6- and CCR6+ CD69+CD25+ cell subset at 42hrs, whereas hBD-3 induced increase of CCR6- but not CCR6+ T cells in CD69+CD25+ cell subset at 42hrs. ………...…38 Figure 3.8 hBD-2 and hBD-3 induced increase of CCR6- but not CCR6+ T cells in CD69-CD25+ cell subset at 42hrs. ………..…38 Figure 4.1 Morphology of purified CD4+ T cell culture with or without the treatment of hBD-2 and 3 at 18hrs. ……….…47 Figure 4.2 Morphology of purified CD4+ T cell culture with or without the treatment of hBD-2 and 3at 42hrs. ………..…48 Figure 4.3 hBD-2 and 3 induce CD69 and CD25 expression on human CD4+ T cells…. ……….…………49 Figure 4.4 hBD-2 and hBD-3 treatment induces the proliferation of purified CD4+ T
cells in vitro. ………...…51
IX
4………...63
Figure 5.1 Gating strategy for intracellular staining of RORγt and T-bet staining in CD69+CD25+ T effector cells or CD69-CD25+ Treg cells following 18hrs culture...69
Figure 5.2 Intracellular staining of RORγt, T-bet and Foxp3 of human CD4+ T cells at 18hrs with the treatment of hBD-2 or hBD-3. ………70
Figure 5.3 Gating strategy for intracellular staining of RORγt and T-bet in CD69+CD25+ T effector cells or CD69-CD25+ Treg cells following 42hrs culture……73
Figure 5.4 Intracellular staining of RORγt, T-bet and Foxp3 of human CD4+ T cells at 42hrs with the treatment of hBD-2 or hBD-3. ………74
Figure 5.5 Cytokine ELISA for IL-6, IL-10 and IL-17A production in the supernatants of T cell culture. ……….75
Figure 5.6 Phenotypes of human CD4+ T cell in the presence or absence of hBD-2 and hBD-3. ………76
Figure 5.7 A proposed schematic model summarising the key findings in Chapter 5………...80
Figure 6.1 Cell sorting strategy and diagram of the experiment design of the experiment analysing the effects of hBD-2 treatment on Treg suppressive function. ………..85
Figure 6.2 The suppression of proliferation of CFSE labelled Teff by Tregs. ………..86
Figure 6.3 Statistical analysis of fold changes in total number of Teff cells in proliferation or those cells having undergone 2,3,4 or 5 cycles only. ………87
Figure 6.4 A proposed schematic model summarising the key findings in Chapter 6………...91
Figure 7.1 PCA analysis of all stimulated samples. ………..95
Figure 7.2 PCA results of stimulated samples at 18hrs. ………96
Figure 7.3 PCA results of stimulated samples at 42hrs. ………97
Figure 7.4 Heatmap of 24 genes whose expression changed more than 1.5 fold following 18hrs hBD-2 treatment………..100
Figure 7.5 PCA analysis of genes regulated by hBD-2 treatment. ……..………101
Figure 7.6 Preliminary results of qPCR showing genes differently expressed in hBD-3 treated human CD4+ T cells. ……….……...103
X
Abbreviations
AMPs antimicrobial peptides
APCs antigen presenting cells
CCL20 CC chemokine ligand 20
CCR6 CC chemokine receptor 6
CD Crohn‟s Desease
CD3 cluster of differentiation 3
CFSE carboxyfluorescein diacetate succinimidyl ester CTLA-4 cytotoxic T-lymphocyte antigen 4
DCs dentritic cells
EAE Experimental autoimmune encephalomyelitis ELISA enzyme-linked immunosorbent assay
FACS fluorescence-activated cell sorting FoxP3 forkhead box transcription factor 3
hBDs human β-defensins
IFN-γ interferon γ
IL interleukin
mBDs murine β-defensins
PBMCs peripheral blood mononuclear cells
RORγt Retinoic acid (RA)–related orphan receptor γt T-bet T-box transcription factor
TCR T cell receptor
Teffs effector T cells
TGF-β transforming growth factor beta Th17 type 17 T helper cells
TLR Toll-like receptor
Tregs regulatory T cells
XI
Acknowledgement
Firstly, I would like to express my deepest gratitude to my supervisor Dr. Sue Outram
for the continuous support of my Ph.D study and related research. I sincerely appreciate
the opportunity she offered me to work with her four years ago. I am grateful for her
patience, trust, and immense knowledge. I appreciate her guidance in all the time of my
study and writing of this thesis. I could not have imagined having a better supervisor
and mentor for my Ph.D study.
Besides my advisor, I would like to thank the rest of my supervisory team: Dr. John
George and Dr. David Rowley, for their insightful comments and encouragement, but
also for the hard question which inspired me a lot to widen my research from various
perspectives.
I would like to thank the technicians past and present for their great assistance in my
research. Also, I would like to thank Dr. Amina Dilmohamed and Anisha Solanki, Dr.
Ayad Eddaoudi and Stephanie Canning from UCL for all their assistance in my studies.
I would like to thank my colleagues in UEL for the stimulating discussions and for all
the good time we have had in the last four years. In particular, I am grateful to Dr.
Cynthia Umukoro for her great assistance and inspiring discussion in my experiments
and the writing process.
I sincerely thank all the participants who donate their blood samples for this research.
Last but not the least, I would like to thank my family: my parents and my wife, Wen
Wei Siow, for supporting me spiritually throughout these years of my study and my life
1
Chapter 1: Introduction
1.1
Antimicrobial peptides
Antimicrobial peptides (AMPs) play a crucial role in the innate immune system to
protect the host from microbial infection (Wang, 2014). The majority of mammal AMP
shave been identified in a variety of epithelial surfaces that directly interface with the
environment such as skin, respiratory tract, intestine and reproductive tract(Mukherjee
and Hooper, 2015).In human, the key AMP families are cathelicidins, such as LL-37,
REG3 lectins and defensins (Kahlenberg and Kaplan, 2013, Mukherjee and Hooper,
2015).
Defensins form one family of AMPs which are a large group of 10 peptides in humans
and 14 in mice (Muniz et al., 2012, Ouellette, 2005, Yamaguchi and Ouchi, 2012).
These peptides are small proteins ranging in size from 2–4 kDa and they are all cationic
peptides capable of directly responding to, and destroying, a wide range of microbial
infections, such as bacterial, fungal and viral infections (Mukherjee and Hooper, 2015).
The mammalian defensins constructed a multi-gene family which consist of different
types of orthologs which are identifiable by their cysteine spacing, intramolecular
disulphide bonds and genomic organization (Semple and Dorin, 2012). The defensin
family comprises three sub-families, α-defensins, β-defensins and θ-defnsins (Jarczak et
al., 2013).
Generally, β-defensins have 6-cysteine motif and the molecular structure is constructed
by disulphide bonds between Cys I-V, Cys II-IV and Cys III-VI, forming the typical
β-sheet structure of β-defensins (Wang, 2014, Semple and Dorin, 2012). In the human
2
on chromosome 8p23.1 and the other β-defensin genes were found in clusters on
chromosome 20p13, 20q11.1 and 6p12 (Schutte et al., 2002). The human β-defensin 2
gene (hBD-2, DEFB2) is located in the p22–23 region of chromosome 8 which is close
to the hBD-1 gene (DEFB1). This indicates that hBD-1 and hBD-2 genes were created
by duplication of a single parental gene (Bals et al., 1999). The hBD-3 gene (DEFB3) is
located close to DEFB2 gene, which is only about 13 kb from the DEFB-2 gene (Lehrer
and Ganz, 2002).
Most of β-defensin genes comprise of two exons. The exon 1 encodes the leucine-rich
signal peptide, and the exon 2 encodes the mature peptide (Semple and Dorin, 2012).
According to the sequence analysis of the murine β-defensin (mBD) gene cluster on
chromosome 8, it was found that both of the DNA and protein sequence of the signal
peptide encoded by exon 1 is highly conserved amongst mBD genes (Semple and Dorin,
2012). In contrast to the signal peptide, the mature peptide encoded by exon 2 is not as
well conserved as the signal peptide, leading to the diversity of β-defensin sequences
which has developed as a response to selective pressure by a range of pathogens
(Semple and Dorin, 2012, Jarczak et al., 2013). The molecular diversity can also reflect
the different antimicrobial activity and tissue distribution of β-defensins, which suggests
that β-defensins can provide the host with a range of different responses to a variety of
pathogens and also may modulate different immune functions (Jarczak et al., 2013).
In recent years, the biological functions of β-defensins have been not only restricted in
their antimicrobial activities but also extended to immunomodulation and their
involvement in other processes, such as cancer and wound healing. In this study, we
3
Figure 1.1 The solution structure of hBD-2 (PDB ID: 1FQQ) (Sawai et al., 2001) and
hBD-3 (PDB ID: 1KJ6) (Schibli et al., 2002).
1.2
Multifunctional role of Human β-defensins in immune system
1.2.1 Antimicrobial activity of hBDs
hBD-2 was originally purified from psoriatic skin lesions using Escherichia coli affinity
column (Harder et al., 1997). The antimicrobial activity of hBD-2 is mainly against
Gram-negative bacteria, yeasts, and HIV but not against HSV (Winter and Wenghoefer,
2012, Ganz, 2003). Like hBD-1, the antimicrobial activity of hBD-2 is inhibited by high
concentrations of NaCl (20mM to 150 mM) (Bals et al., 1998), although the
concentration of both salt and the peptides can influence its antimicrobial activity
(Jarczak et al., 2013). Unlike hBD-2, hBD-3 is effective in killing Gram-positive
vancomycin-resistant Enterococcus faecium and Staphylococcus aureusas well as the
yeast Candida albicans at physiological salt concentrations (Harder et al., 2001). These
findings may indicate that the antimicrobial activity of defensins could be regulated by
4
In contrast to hBD-1 which is constitutively expressed by epithelial cells, the expression
of hBD-2 and hBD-3 is triggered during infections or following various inflammatory
stimuli, such as activation of IL-1β (Ramasundara et al., 2009, Doss et al., 2010). The
expression of the hBDs in epithelial cells is mediated by Nucleotide-binding
Oligomerization Domain-containing Proteins (NODs) as a receptor recognizing
intracellular bacterial that, in turn, activates Nuclear Factor (NF)-κB to trigger gene
expression of β-defensins (Voss et al., 2006). Interestingly, it was found that
up-regulation of hBD-2 expression was induced through a NOD1-dependent signalling
pathway, while the expression of hBD-3 was enhanced by a mechanism that is mediated
through a NOD-independent, EGFR-mediated pathway (Boughan et al., 2006).
The expression of hBD-2 was significantly increased by human colonic epithelial cell
lines HT-29 and Caco-2 cells following exposure to pro-inflammatory levels of IL-1α
and/or enteroinvasive E. coli (O29:NM), suggesting that hBD-2 plays an crucial role in
the pathology of colitis and colitis-associated growth of microflora (Ho et al., 2013).
Additionally, George et al. (2003) demonstrated that infection by Helicobacter pylori
up-regulated hBD-2 and hBD-3 mRNA and protein expression in gastric cell lines both
in vitro and in vivo, and hBD-2 as well as hBD-3 display strong antimicrobial activity
against H. pylori. Further investigation by Paolillo et al. (2009) indicated that the
mRNA and protein expression of hBD-2 were significantly enhanced in Caco-2 cells
when exposed to Lactobacillus plantarum in a time and dose-dependent manner.
Additionally, the reduction of murine β-defensin 10 expression caused the impaired
regulation of growth of several major components of the intestinal microbiota, such as
Bacteroides fragilis, E. coli, E. faecalis, and C. albicans (Peyrin-Biroulet et al., 2010).
5
their normally sterile urine (Morrison et al., 2002) and a defective ability to inhibit
Haemophilus influenza growth in the airway (Moser et al., 2002). These findings
demonstrate the importance of β-defensins in the innate defence against infections.
Collectively, hBDs function as antimicrobial agents and their expression is regulated by
the signalling induced following exposure to both inflammatory and bacterial stimuli.
However, the in vitro antimicrobial activity of β-defensins may not represent the full
function in vivo, as the peptide concentrations required for in vitro antimicrobial activity
are higher than those that are observed in vivo(Semple and Dorin, 2012). Despite the
difference between in vitro culture condition and in vivo physiological conditions, it is
suggested that β-defensins can not only inhibit bacteria growth by directly interacting
with bacteria, but also modulate both innate and adaptive immunity(Semple and Dorin,
2012).
1.2.2 hBDs regulate pro-inflammation in innate immune responses
In addition to their antimicrobial activities against both positive and
Gram-negative bacteria, defensins are also capable of mediating inflammatory innate immune
reactions. These mediators are also known to possess chemoattractant activities able to
recruit and activate other leukocyte populations into the inflamed area. (Oppenheim and
Yang, 2005). Moreover, hBD-2 is capable of inducing recruitment of mast cells and
neutrophils (Niyonsaba et al., 2002, Niyonsaba et al., 2004). In addition to hBD-2,
mBD-14 (DEFB14), the mouse ortholog of hBD-3, was also shown to chemoattract
both human and mouse CCR6-expressing cells (Taylor et al., 2008, Rohrl et al., 2008).
hBD-3 was also demonstrated to suppress the apoptosis of neutrophils via binding to
CCR6 at the neutrophil cell surface, increasing the expression of the anti-apoptotic
6
However, hBD-3 and hBD-4 also were also shown to induce chemoattraction of
macrophages which are not CCR6+, suggesting alternative receptors other than CCR6
may be involved in the interaction with β-defensins. Rohrl et al. (2010) demonstrated
that it was the CCR2 receptor which mediates the migration of monocytes and
macrophages in response to hBD-2 and hBD-3. Additionally to the interaction with
CCR2 and CCR6, β-defensins also have been demonstrated to interact with Toll-like
receptors (TLRs) on antigen presenting cells (APCs) (Dorin and Barratt, 2014). hBD-3
was also reported to induce the expression of the co-stimulatory molecules CD80,
CD86, and CD40 on monocytes and myeloid dendritic cells (DCs), and interestingly,
this up-regulation in expression is dependent upon TLR1 and TLR2 ligation
(Funderburg et al., 2007), whilst mBD-2 enhances the activation of DCs in a
TLR4-dependent manner (Biragyn et al., 2002). hBD-3 is also reported to increase the protein
level of pro-inflammatory cytokines, including IL-1β, IL-6 and IL-8, in human
monocytes via TLR1/2 (Funderburg et al., 2011). Alternatively, hBD-3 is capable of
blocking CXCR4 activation by CXCL12 (Feng et al., 2013). In addition, hBD-2, hBD-3
and hBD-4 have been previously shown to induce pro-inflammatory mediators in
keratinocytes including macrophage inflammatory protein-3α (MIP-3α), monocyte
chemoattractant protein-1 (MCP-1), RANTES, IL-6, IL-10 and IP-10, through the
G-protein and phospholipase C (G G-protein-PLC) signalling pathway (Niyonsaba et al.,
2007).
As well as their pro-inflammatory role, β-defensins have also been reported to be
suppressors of inflammation as well. Semple et al. (2010) demonstrated that hBD-3 and
mBD-14 could inhibit TNF-α and IL-6 accumulation in human and mouse primary
macrophages, respectively. They also showed that in the presence of hBD-3, the
7
et al., 2010). Further investigation supported the finding that hBD-3 inhibits the
transcription of pro-inflammatory genes in TLR4-stimulated macrophages (Semple et
al., 2011). It is suggested that hBD-3 down-regulated the protein levels of
pro-inflammatory cytokines, such as IL-6 and IL-12p40, and cell surface molecules, such as
CD40 and CD86. In addition, hBD-3 reduces NF-κB signalling in cells transfected with
MyD88 or TRIF, which are down-stream of TLR4 signalling, suggesting that the
Myd88 and TRIF are the downstream targets of hBD-3 mediated suppression of the
activation of macrophages (Semple et al., 2010).
Collectively, these findings suggest that β-defensins are able to regulate both pro- and
anti-inflammatory immune responses by interacting with different receptors on several
different types of immune cells.
1.2.3 hBDs regulate pro-inflammation in T-cell-mediated adaptive immune response
Recent studies have demonstrated that hBDs are also capable of regulating the adaptive
immune response. Yang et al. (1999) demonstrated that hBD1–3 induced
chemoattraction of CD4+ memory T cells and immature DCs through interaction with
CCR6. Although hBD-2 has a lower affinity than CCL20 for the interaction with CCR6,
both ligands can compete for binding to CCR6. Ghannam et al. (2011) demonstrated
that hBD-2 was able to mediate the migration of the pro-inflammatory Th17 cell, in an
in vitro model using induced inflammation in endothelial cells under flow conditions.
Their data also showed that the Th17 derived cytokines, IL-17 and IL-22, could induce
the secretion of hBD-2 by epidermal keratinocytes leading to the increase of
8
As mentioned briefly above, in addition to the capability of hBDs to act as a
chemoattractant to T cells, Boniotto et al. (2006) found that hBD-1, 2 and 3 are all
capable of up-regulating the secretion of a variety of cytokines, such as IL-6, IL-8 and
IL-10, and chemokines, such as MCP-1 by human peripheral blood mononuclear cells
(PBMCs). These defensins also showed different abilities to induce the secretion of
selected cytokines and chemokines. Following this study, Kanda et al. (2011)
demonstrated that hBD-2 regulated cytokine mRNA expression and protein secretion by
human CD3+ T cells in vitro. Their data suggested that hBD-2 induced TNF-α, IFN-γ,
IL-1β, IL-6, IL-10, and IL-22 production by these CD3+ T cells but inhibited IL-17
production. Additionally, the induction of cytokine production was found to be due to
the enhanced expression of SOCS3 and the suppressed phosphorylation of STAT3 by
hBD-2 treatment in αCD3/28-stimulated T cells (Kanda et al., 2011). These effects
were suggested to be induced by hBD-2 via PTX-sensitive GPCR (Kanda et al., 2011).
Additionally, investigation by Meisch et al. (2013) indicated that hBD-3 causes STAT1
tyrosine phosphorylation in human CD3+CD45RO+ T cells.
Further investigation suggested that hBD-2 induced IL-22 and oncostatin M in human
CD3+ T cells (Kanda and Watanabe, 2012). The induction of T cell cytokines by hBD-2
treatment provides the evidence that treatment with hBD-2 potentially influences T cell
differentiation following activation. Recent studies by Agatha Schwarz‟s lab
demonstrated that the treatment of T cells with murine β-defensin 14 (mBD-14) is
capable of inducing a regulatory phenotype in CD4+ T cells. They used a murine model
of contact hypersensitivity (CHS) induced by painting 2,4-dinitro-1-fluorobenzene
(DNFB) on the skin of a mouse to test the suppressive function of mBD-14 on tissue
inflammation. They found that the injection of mBD-14 before sensitization can protect
9
Additionally, the transfer of the splenocytes and lymph node cells obtained from
mBD-14-treated mice can significantly suppress CHS response in the recipient mice (Navid et
al., 2012). Finally, they showed that mBD-14 treatment in vitro can induce the
expression of FoxP3, CTLA-4, CD62L and neuropilin on CD4+CD25- T cells, which
are considered as conventional T cells (Navid et al., 2012). These studies suggest that
mBD-14 can induce regulatory phenotypes in vivo. More recently, a similar regulatory
effect was demonstrated using an EAE mice model. The injection of mBD-14 into mice
before immunization can significantly reduce the clinical score of experimental
autoimmune encephalomyelitis (EAE), suggesting that mBD-14 treatment can induce
Treg cell development to inhibit the inflammation in central nervous system (Bruhs et
al., 2015). Interestingly, this regulatory effect induced by mBD-14 in CD4+CD25- T cell
is found to be IL-10-dependent because the T cells obtained from IL-10-/- mice could
not protect the recipient mice from ear-swelling (Navid et al., 2012).
Additionally, a recent study by Tomalka et al. (2015) demonstrated that the murine
β-defensin, mBD-1, mediates the mucosal defense against C. albicans. They found that
mBD-1 deficient mice exhibit impaired neutrophil infiltration which leads to the
increased C. albicans infection. On the other hand, the deficiency of mBD-1 causes
significant down-regulation of IL-1β, IL-6 and IL-17, suggesting defective Th17 lineage
differentiation which is required in antifungal immune response against C. albicans
infection.
In summary, these studies suggest a role for β-defensins in regulating T cell
development and function. In respect to the functional diversity of human T cells in
particular, it is of great interest to investigate the effect of hBD-2 and 3 in driving
10
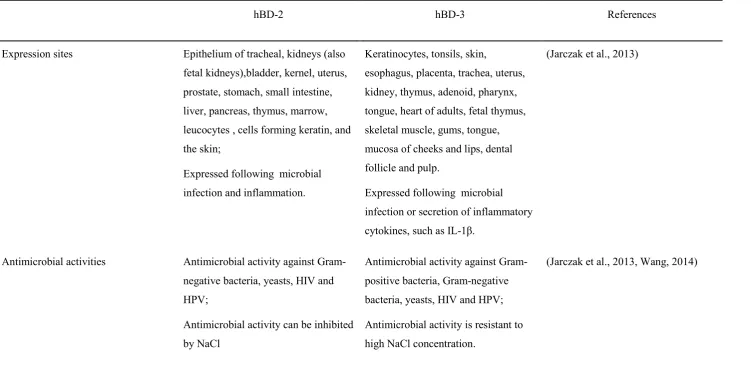
Table 1.1 The antimicrobial activities and immunomodulatory function of hBD-2 and hBD-3.
hBD-2 hBD-3 References
Expression sites Epithelium of tracheal, kidneys (also fetal kidneys),bladder, kernel, uterus, prostate, stomach, small intestine, liver, pancreas, thymus, marrow, leucocytes , cells forming keratin, and the skin;
Expressed following microbial infection and inflammation.
Keratinocytes, tonsils, skin,
esophagus, placenta, trachea, uterus, kidney, thymus, adenoid, pharynx, tongue, heart of adults, fetal thymus, skeletal muscle, gums, tongue, mucosa of cheeks and lips, dental follicle and pulp.
Expressed following microbial infection or secretion of inflammatory cytokines, such as IL-1β.
(Jarczak et al., 2013)
Antimicrobial activities Antimicrobial activity against Gram-negative bacteria, yeasts, HIV and HPV;
Antimicrobial activity can be inhibited by NaCl
Antimicrobial activity against Gram-positive bacteria, Gram-negative bacteria, yeasts, HIV and HPV;
Antimicrobial activity is resistant to high NaCl concentration.
11 Immunomodulatory function Chemotactic activity for monocytes,
macrophages, neutrophils and
immature dendric cells;
Induces phosphorylation of JNK,
ERK, and Akt in human CD3+ T cells;
Suppresses phosphorylation of STAT3
and enhances expression of SOCS3 in
αCD3/28-stimulated human
CD3+Tcells;
Enhances cytokine secretion and
mRNA expression.
Chemotactic activity for monocytes,
macrophages, neutrophils and
immature dendric cells via CCR6,
CCR2 or CXCR4;
Inhibits TLR4 downstream signaling,
such as MyD88 and TRIF, in
macrophages;
Induces STAT1 phosphorylation,
tyrosine phosphatase activity, and
cytokine synthesis in human CD3+ T cells.
(Jarczak et al., 2013, Semple et al.,
2011, Semple et al., 2010, Meisch et
12
1.3
Research aims
Recent studies have suggested a role for defensins in Treg development (Navid et al.,
2012), however the effect of hBD-2 and 3 on human CD4+ T helper cell differentiation
is not fully explored. Thus, the aim of this study is to investigate the role of hBD-2 and
hBD-3 in driving human CD4+ T cell activation, proliferation and differentiation.
1.4 Research objectives
To investigate the effect of hBD-2 and hBD-3on CD4+ T cell activation and
proliferation using human whole PBMCs;
To investigate the effect of hBD-2 and hBD-3 on purified human CD4+ T cell
activation and proliferation;
To characterize the polarization of purified human CD4+ T cells in the presence
or absence of hBD-2 and hBD-3 and investigate cytokine production in the cell
culture;
To assess the suppressive function of hBD-2 pre-treated Treg cells and the
resistance of hBD-2 pre-treated Teff cells from Treg suppression.
To investigate the transcriptome profile of human CD4+ T cells after treatment
with of hBD-2 using microarray analysis.
13
Chapter 2: Methodology
2.1
Ethical approval
This study has been reviewed and approved by the NHS City Road and Hampstead
Research Ethics Committee (Appendix 2.1) as well as the University Research Ethics
Committee of University of East London (Appendix 2.2). Human venous blood samples
were collected with written consent from healthy volunteers according to the NREC
approvals (Ref: 13/LO/0296).
2.2
Antibodies and reagents
Synthesized peptides of hBD-2 and hBD-3 were purchased from Severn Biotech (UK).
Anti-human CD3 (Clone: OKT3) and anti-human CD28 (Clone: CD28.6) antibodies
were purchased from eBioscience. The following eBioscience mAbs were used in flow
cytometry: FITC-conjugated human CD69 (Clone: FN50); PE-conjugated
anti-human CD25 (Clone: BC96); PE-conjugated anti-anti-human CD127 (Clone: eBioRDR5);
PE-Cyanine7-conjugated anti-human CD4 (Clone: RPA-T4); PE-Cyanine7-conjugated
anti-human T-bet (Clone: 4B10); allophycocyanin (APC)-conjugated anti-human FoxP3
(Clone: 236A/E7); PE-conjugated anti-human RORγt (Clone: AFKJS-9). 5-(and
6)-Carboxyfluorescein diacetate succinimidyl ester (CFSE; eBioscience) was used to trace
cell proliferation.
2.3
Isolation and activation of human PBMCs
Initially, 50ml of peripheral blood was taken from healthy donors using heparinized
vacutainer tubes. PBMCs were isolated by density gradient centrifugation using the
14
medium (Gibco, UK). The diluted blood were carefully layered onto 10ml of
Histopaque 1077 in a sterile conical centrifuge tube and then centrifuged at 400×g
without break for 30mins. After centrifugation, the interface containing the whole
PBMCs was carefully taken and moved into a new centrifuge tube. Subsequently, the
cells were washed by medium twice to remove the excess Histopaque. After washing,
the isolated PBMCs were seeded at 2.0×10⁶ cells/ml in 96-well plates and stimulated
with soluble anti-human CD3 (0.005μg/ml) and anti-human CD28 (0.005μg/ml)
antibodies (eBioscience) in the presence or absence of 1, 3 and 10µg/ml hBD-2 in 200µl
AIM-V medium. Cell cultures were incubated at 37℃, 5% CO2. After 18hrs and 42hrs,
PBMCs were assayed for cell surface marker expression and a range of cytoplasmic
markers including CD4, CD69 and CD25 using flow cytometry.
2.4
Purification of human CD4
+T Cells
CD4+ T cell were isolated using EasySepTM human CD4+ T cell enrichment kit
(StemCell, UK) according to the manufacturer‟s instruction. Human PBMCs were
suspended in a sterile polystyrene tube with recommended buffer (PBS with 2% FCS).
Cell suspensions were incubated with antibody cocktail (CD8, CD14, CD16, CD19,
CD20, CD36, CD56, CD66b, CD123, TCRγ/δ, glycophorin A) for 10mins. Then,
magnetic beads were added into cell suspension and incubated for 5mins. Finally, the
tube was inserted into magnet. After 5mins incubation, the fraction of purified CD4+ T
cells was poured into a new sterile tube. These isolated CD4+ T cells were stimulated
using plate bound anti-human CD3 antibodies (0.1μg/ml) and soluble anti-human CD28
antibodies (2μg/ml), according to the published methodology (Kanda, 2011, Kanda and
15
2.5
Enzyme linked immunoabsorbent assay (ELISA)
For assay of IL-2, IL-6, IL-10 and IL-17A secretion, supernatants of cell culture were
collected and the cytokine concentrations were determined by ELISA Ready-Set-Go
kits (eBioscience, UK) according to the manufacturer‟s instructions. Firstly, 96-well
plates were coated with capture antibodies overnight at 4℃. Then, the wells were
washed using ELISA wash buffer (1× PBS, 0.05% Tween-20) to remove unbound
antibody and blocked using 1× ELISA/ELISPOT Diluent from the kit for 1hr. After
washing, 100µl of diluted supernatant samples along with a serial dilution of
recombinant cytokine protein were added and the plate was incubated at 4℃ overnight
in order to get the maximal sensitivity. After incubation, the samples were aspirated and
the plate was washed using ELISA wash buffer. Detection antibody against each
individual cytokine was added and incubated at room temperature for 1hr. Then, the
plate was washed again and the diluted Avidin-HRP was added and incubated for
30mins. After washing, the substrate was added and the colour was allowed to develop
for 15mins at room temperature. After 15mins incubation, the stop solution was added
to the plate (2N H2SO4) to stop the reaction. Finally, The plates were read using the
Thermo Multiskan plate reader (Thermo) at 450nm. The actual values for analysis were
obtained by subtracting the values obtained at 570nm.
2.6
Cell Proliferation assay
Isolated PBMCs were washed twice with PBS to remove fetal calf serum (FCS) in the
culture. Then, cells were suspended in PBS at 2.0×10⁶ cells/ml in PBS.
Carboxyfluoroescein diacetate succinimidyl ester (CFSE) was added (5mM) to a final
concentration of 5µM, vortexed gently and the suspension allowed sitting for 15mins in
16
was added to the cell suspension. The cells were centrifuged for 5min, 400×g. The
supernatant was discarded and the cell pellet resuspended to obtain a single cell
suspension. Cells were washed twice by suspending in 10ml of 2% FCS/PBS. Cells
were centrifuged for 5min, 400×g. Finally, the labelled cells were resuspended in
AIM-V at 2.0×10⁶ cells/ml. Where described, IL-2 (0.02μg/ml) was added to promote T cells
proliferation.
2.7
Flow cytometry
Cells were prepared and incubated with fluorescence-conjugated antibodies for cell
surface markers, such as CD4, CD69 and CD25. Briefly, cells were washed and
suspended in 50µl of FACS buffer (PBS containing 2% FCS). Then, 50µl of antibody
cocktail was added into each cell suspension. After gently flicking, the cell suspension
was incubated on ice for 30mins. Then, cells were washed using FACS buffer and were
then analysed using an Accuri C6 Flow Cytometer (BD Bioscience, UK). For the
staining of intracellular transcriptional factors, FoxP3, T-bet and RORγt, intracellular
staining was performed using FoxP3/Transcription Factor Staining Buffer Set
(eBioscience, UK). After labelling with surface antibodies as described earlier, cells
were initially fixed and permeabilized using Fixation/Permeabilization solution and
stained with selected antibodies in 1× Permeabilization Buffer. After staining, cells
were washed and resuspended in FACS buffer ready for analysis using the Accuri C6.
2.8
RNA extraction
RNA samples were isolated and purified using PureLink RNA Mini Kit (12183018A,
Life Technologies). Cultured human CD4+ T cells were collected and pelleted in RNase
free tubes. After removing the supernatant, lysis buffer containing 1% β-
17
cell lysate was processed in order to extract RNA according to the manufacturer‟s
instruction in which a step of DNase on column digestion was also applied using
PureLink DNase set (Life technologies, UK). The quality and quantity of RNA samples
was determined using the Nanodrop ND-1000 spectrophotometer (Nanodrop
technologies, Wilmington, US). Samples with an absorbance of 260/280nm ratio
between 1.8 and 2.1 were considered as accepted quality to be used in downstream
experiments. The isolated RNA samples were stored at -80℃. cDNA was synthesised
using the iScript cDNA Synthesis Kit (Bio-Rad, CA, USA). RNA samples were
extracted as described earlier. 300-400ng RNA was added in the reaction to make up a
total volume of 20μl. The other components, such as Oligo(dt) primers, reverse
transcriptase, are provided by the kit. The cDNA synthesis was performed using the
Bio-rad T100TM Thermal Cycler (Bio-Rad, Inc., US). The reaction program was set as
it is suggested in the manufacturer‟s reaction protocol. cDNA samples were stored at
-20℃.
2.9
Micro-array assay
An ethanol precipitation step was carried out in order to further purify RNA samples.
RNA samples were applied to an Affymetrix HuGene Exon Expression Microarray
Chip. Poly-A controls were used to monitor the entire target labelling process. Poly-A
controls were dap, lys, phe, thr. Hybriziation controls were bioB, bioC, bioDn, creX.
The signal intensities of the hybridization control probes are presented in Appendix 2.3.
As it is shown in Appendix 2.3, the profiles of all samples are similar, indicating good
hybridization and washing of the arrays. CEL files were produced and then analysed
using Agilent GeneSpring GX 13 software. The data was normalized using the
GeneSpring GX 13 software with the Robust Multi Array (RMA) algorithm and.
18
to be significant. In addition, fold changes of gene expression of more than 1.5 were
considered biologically relevant. Principal Component Analysis (PCA) was carried out
as described in Furmanski et al. (2013). Briefly, CEL files were analysed for PCA using
the CRAN package (Bioconductor, U.S). Genes identified from GeneSpring and PCA
was verified using qRT-PCR.
2.10
Quantitative RT-PCR
Relative gene expression levels of selected target genes were measured using
quantitative real-time PCR (qPCR). RNA extraction and cDNA synthesis were
performed using the same method as described earlier. qPCR were performed using the
iTaq UniverSYBR Green RT-PCR kit (Bio-rad, UK) following the manufacturer‟s
protocol. The house-keeping gene, human hypoxanthine guanine phosphoribosyl
transferase 1 (Hprt1), was used as internal standard for the quantification of template as
well as the normalisation of target gene expression. Amplification of Hprt1 was
quantified using a dilution series of neat cDNA, 1:10, 1:100, 1:1000 and 1:10000
prepared from stimulated control CD4+ T cells RNA and the relative standard curve for
the gene of interest was generated by a 1:10 serial dilution of RNA prepared from
cultured CD4+ T cells in the presence or absence of hBD-2 (10µg/ml) or hBD-3
(10µg/ml). The efficiency of the qRT-PCR was determined for each gene with the slope
of a linear regression model (Pfaffl, 2001). The efficiencies (E) were calculated
according to the equation: E= (10(-1/slope-1) ×100).
The primers used for the reaction are listed below in Table 2.1. All primers used were
purchased from Quantitech (Qiagen, UK). The primer sequences are protected by
Qiagen. Each reaction contained approximately 100ng of cDNA, 300nM of forward and
19
dNTPs, MgCl2). The reaction was made up to 20μl using nuclease free water (Qiagen
Inc., US) in a 96 well plate (Thermo Scientific, U.K). Data analysis was performed
according to using standard curve method (Bolha et al., 2012). The calculation of
relative expression is shown in Appendix 2.4. Gene expression levels were first
normalized to the expression levels of the Hprt1 and then calculated relative to the
normalized gene expression in the stimulated control (Maine et al., 2014).
qRT-PCR reaction was performed under the recommended conditions for each primer
used according to the manufacturer‟s protocol: initial denaturation at 95oC, for 30s
followed by 40 cycles of denaturation at 95oC for 30s and annealing at 60oC for 30s. In
each experiment, an additional programme for the detection of melting curve was
performed in order to check the melting temperatures of the products to assess
primer-dimer formation and confirm the product size was as expected (Appendix 2.3).
Table 2.1 Primers used in RT-PCR experiment
Target genes Primer Ref. No.
Ccl1 QT00203154
Ctla4 QT01670550
Il23r QT00032914
Il21 QT00038612
Hprt1 QT00059066
2.11
Treg/Teff sorting and Treg suppression assay
Purified human CD4+ T cells were stained with anti-CD4-Pe-Cy7, anti-CD25-APC and
anti-CD127-PE antibodies before FACS sorting. Then, CD4+CD25+CD127- Treg cells
and CD4+CD25-CD127+ Teff cells were sorted using BD FACSAria III. After sorting,
20
CFSE labelled target Teff cells and Tregs were seeded in separate wells at 2.0×10⁶
cells/ml and incubated in the presence or absence of hBD-2 for 4hrs. After hBD-2
treatment, Teff and Treg cells were collected and washed with fresh medium twice and
target Teffs were cultured alone at 5.0×10⁴ cells/well or co-cultured with Tregs at a
Teff/Treg ratio 1:1 in 96-well plate. Teffs were stimulated using αCD3/28 antibody
coated beads (Dynabeads, Life Technologies) at a bead/cell ratio 1:10. Proliferation of
Teffs was assessed by flow cytometry following 4 days in culture.
2.12
FACS gating strategy
PBMCs were stained and analysed using flow cytometry (Accuri C6, BD). To exclude
dead cells, a plot of forward scatter (FSC-A) vs. side scatter (SSC-A) was set at the
beginning of analysis. Lower granularity on SSC-A and FSC-A indicates dead cells. In
PBMCs, CD4 was used as the first marker and it is plotted against the SSC gated as
shown in R1. Cells were then analysed for the expression of T cell activation markers,
CD69 and CD25, within the CD4+ T cell gate. In the case of purified CD4+ T cells, T
cell activation was analysed also using CD69 and CD25 similar to the PBMCs. In
addition to activation, the Treg population was gated as CD4+CD25+CD127- subset,
whereas the activated effector T cell (Teff) population was gated as
CD4+CD25+CD127+ subset. The expression of transcription factors, such as FoxP3,
T-bet and RORγt was analysed using the gates for Treg cells or activated Teff cells.
2.13
Statistical analysis
Statistical analysis was performed using the Student t Test for statistical testing between
two groups, or One-way ANOVA for three groups. Column graphs were generated by
GraphPad Prism 5. Dot-plots and peak-plots were generated by Accuri CFlow software
21
with p values of 0.05 or less, were considered statistically significant. Unless otherwise
stated, the figures in the results show one representative experiment of at least three
22
Chapter 3: Effects of hBD-2 on whole PBMCs population
3.1
Introduction
β-defensins were initially described as peptides with only direct antimicrobial activity
and therefore were regarded as an essential innate immune component protecting the
host from infection (Jenssen et al., 2006, Harder et al., 2007). Biragyn et al. (2002)
were considered as the first to report that defensins may play a role as a mediator in
both the innate and the adaptive immune response. Their studies demonstrated that
mBD-2 up-regulates co-stimulatory molecules on immature DCs by interacting with
TLR-4, thereby inducing DC maturation. Additionally, hBD-3 as well as LL-37 was
shown to exhibit chemotactic activity for monocytes, immature DCs, neutrophils and T
cells (Doss et al., 2010).
It has also been shown that the closely related, α-defensins cannot only regulate the
maturation and differentiation of leukocytes but also act as chemotactic factors. In
particular, the α-defensins, HNP1–3, have been reported to control the maturation of
human monocyte-derived DCs and regulate the maturation of these cells as judged by
CD83, CD86 and HLA-DR expression in a dose dependent manner (Rodriguez-Garcia
et al., 2009).
In addition to HNP1, hBD-1 was also suggested to be chemotactic for
monocyte-derived DCs by inducing the activation of these cells and production of
pro-inflammatory mediators in these cells (Presicce et al., 2009). Moreover, Boniotto et al.
(2006) revealed that human PBMCs treated with hBD-2 can up-regulate secretion of a
23
reveal the fact that defensins may play a crucial role in regulating both the innate and
adaptive immune responses.
Dysregulated expression of the defensins may also lead to the development of
pathologies. The over-expression of hBD-2 in keratinocytes is considered to participant
in the induction of autoimmune pathology, such as chronic psoriasis by inducing the
infiltration of IL-17-producing T cells into psoriatic skin (Lowes et al., 2014). Kanda et
al. (2011) detected elevated levels of hBD-2 in serum from patients suffering from
psoriasis which correlated in a positive fashion with levels of TNF-α, IFN-γ, 1β,
IL-6, IL-10 and IL-22, but were inversely correlated with IL-17 levels. Consistent with this
finding, they found that mRNA levels of TNF-α, IFN-γ, IL-1β, IL-6, IL-10 and IL-22
were significantly higher in hBD-2 treated CD3+ T cells in contrast to the untreated
control, suggesting that the defensins were working to up-regulate the pro-inflammation
which may lead to autoimmunity.
β-defensins have also been shown to regulate the development of Tregs. The mouse
homolog of hBD-2 and hBD-3, Defb14, has been indicated to be capable of switching
CD4+ effector T cells into Treg cells with an accompanying increase in secretion of the
immunosuppressive cytokine, IL-10 (Navid et al., 2012). Moreover, mBD-14 has been
shown to be able to direct CD4+CD25- T cells into a regulatory phenotype by
up-regulating the expression of FoxP3 and CTLA-4 in these cells (Navid et al., 2012).
In this chapter, we investigate the immune-modulatory effects of hBD-2 on human
peripheral blood derived T cells in the culture of whole PBMCs. Synthetic hBD-2
peptides were used at a range of different doses and were added to the cultures of
PBMCs together with soluble αCD3/28. Any effect of hBD-2 on T cell activation,
24
also investigated the development of CD4+CD25high Treg cells by analysing the
expression of the marker for Tregs, FoxP3.
3.2
Results
3.2.1 Treatment with hBD-2 up-regulates the number of percentage of FoxP3+ cells in
CD4+CD25high T cells at 18hrs, but down-regulates FoxP3+ cells at 42hrs.
It has been suggested in several studies that the commensal microbiota in intestine plays
an important role in facilitating the immune system, including the generation of an
appropriate environment for the development of Tregs (Brenchley and Douek, 2012,
Muniz et al., 2012, Ostaff et al., 2013). Antimicrobial peptides (AMPs) are an essential
component of this environment. In this chapter, we have selected to study hBD-2 in
order to assess what impact this AMP might have on the adaptive immune response and
in particular the emergence of Tregs.
Tregs represent a distinct phenotype of T cells that express CD4, α chain of IL-2R
(CD25), and FoxP3 (Josefowicz et al., 2012). FoxP3 has been demonstrated as a
transcriptional factor specifically expressed in CD4+CD25high Tregs (Hori et al., 2003).
It has been demonstrated that FoxP3 functions as a key regulatory gene for the
development of Tregs, as retroviral gene transfer of FoxP3 converts naive T cells into a
Treg phenotype similar to that of naturally occurring Tregs (Navid et al., 2012, Bilate
and Lafaille, 2012).
Additionally, CD69 is a type II C-lectin membrane receptor barely expressed on resting
lymphocytes but then rapidly induced on effector T cells upon cell activation which
makes it a good marker of choice to measure early activation of T cells
25
can interact with the transcriptional factor STAT5, which is an essential mediator of
IL-2 signalling in T cells. IL-IL-2 enhances Treg function via increased expression of FoxP3,
whilst inhibits Th17 differentiation and IL-17 production through the inhibition of
STAT3 signalling (Gonzalez-Amaro et al., 2013).
In order to investigate the effect of hBD-2 treatment on the development of Tregs
within a PBMC mixed cell culture, expression of CD4 and CD25 was used to identify
putative Tregs and then intracellular expression of FoxP3 was analysed in this gated
population. Upon incubation of PBMCs with 10ug/ml hBD-2 at 18hrs, a 50% increase
in levels of FoxP3 fluorescence intensity was observed in CD4+CD25+ T cells (Figure
3.1A, upper left). In addition, the percentage of CD4+CD69+CD25+ T cells significantly
increased upon co-incubation with 10μg/ml hBD-2 from 35% in the stimulated control
to 39.9% in the presence of hBD-2. As it is shown in Figure 3.1C, there is an increase of
the percentage of CD69+CD25+ T cells (Q2-UR) on incubation of PBMCs treated with
hBD-2 at 18hrs (from 35% to 39.9%). Several recent reports suggest that CD69 may
exert a regulatory function in different activated T cell subsets. Considered as a
recent early activation marker, the expression of CD69 has also been found on FoxP3+
Tregs and may act as a marker for recently activated Treg cells which are able to
recognize locally presented antigens in different tissues (Lieberman et al., 2012). Our
data indicates that hBD-2 may increase the presence of CD69+CD25+ T cells at 18hrs
and this observation may correlate with either the appearance of a greater number of
CD25+CD69+ activated T cells or these may represent an increase in the presence of
newly activated Tregs that express both CD69 and CD25. These data are consistent with
previously published findings which reveal that mBD-14, an ortholog of hBD-2, is
26
However, interestingly, we found that the percentage of FoxP3+ cells in CD4+ CD25high
T cells was significantly reduced following 42hrs treatment with 10ug/ml of hBD-2
(Figure 3.1A, lower left; 3.1B), although there was no significant change in the numbers
of either CD69+CD25+or CD69-CD25+T cells at this time point (Figure 3.1C). Previous
studies suggested the essential role of FoxP3 in CD4+CD25+ Treg cells (Hill et al., 2007,
Sugimoto et al., 2006, Gavin et al., 2007). Additionally, ablation of a conditional FoxP3
allele in mature Treg cells was found to result in a loss of characteristic gene expression
and suppressor function as well as the acquisition of effector T cell function (Williams
and Rudensky, 2007). Thus, the heritable maintenance of a developmentally established
Treg cell transcriptional and functional program requires continuous expression of
FoxP3 (Josefowicz et al., 2012). Following 42hrs treatment with 10μg/ml of hBD-2, the
reduced expression of FoxP3 could indicate a loss of immunosuppressive function of
27
Figure 3.1 hBD-2 treatment increased the percentage of FoxP3+ cells in CD4+CD25high
T cell population at 18hrs, but down-regulates the percentage of FoxP3+ cells in the
28
(0.005μg/ml) and anti-human CD28 (0.005μg/ml) and co-incubated in the presence or
absence of 1, 3 and 10μg/ml of hBD-2. After 18hrs and 42hrs incubation, cells were
stained and analysed by flow cytometry. Data were collected from 3 independent
experiments (n=3). Statistical analysis was performed using Student t test. *p<0.05 versus stimulated control (Stim Co); ** p<0.01 versus stimulated control (Stim Co).B. Histograms showing expression of FoxP3 in CD4+CD25high T cells. C. Dot-plots of
expression of CD25 and CD69 on CD4+ T cells.
3.2.2 hBD-2 treatment in the culture of PBMCs induces proliferation of both CD4+
and CD8+ T cells.
As discussed previously, we demonstrated that percentage of FoxP3+ cells in
CD4+CD25high T cells is significantly reduced following 40hrs incubation with 10ug/ml
of hBD-2 in these same CD4+CD25high T cell population. It has been suggested that the
decrease of FoxP3 expression in CD4+CD25high Tregs may lead to their impaired
suppressive function. Thus, we would hypothesize that there could be a loss of
immunosuppressive activity induced by hBD-2 treatment in these cultures following
42hrs incubation. In order to assess the in vitro immunosuppressive activity of Treg
cells after treatment with hBD-2, PBMCs were stained with CFSE prior to stimulation
with αCD3/28 antibodies in order to assess any regulation of proliferation of CD4+ T
cells following treatment with hBD-2. CFSE is able to bind to intracellular proteins by
reacting with lysine side-chains and other available amine groups. When cells
proliferate, CFSE labelled proteins are separated equally into the daughter cells, which
therefore obtain half of their fluorescence from their parent cells (Hawkins et al., 2007).
As a result, each generation of proliferation is marked by a halving intensity of CFSE
fluorescence which can be characterised as several finger-like fluorescent peaks
29
Data presented in Figure 3.2 and 3.3 suggested that the proliferation of CD4+ T cell
population as well as CD8+ T cell population was increased at 72hrs and 96hrs after
treatment with 10μg/ml hBD-2 (Figure 3.2A and 3.3A). The lower fluorescence
intensity of CFSE in the treated cells indicates the higher level of proliferation that cells
were undergoing. With the treatment of hBD-2, the increasing percentage of T cells
expressing the lower fluorescence intensity can be identified (Figure 3.2B and 3.3B). At
96hrs there was a shift in percentage of cells that had divided from 53.8% in cells
stimulated with αCD3/28 alone to 69.6% cells in cell cycle when treated with hBD-2.
A similar, but less increased finding was observed at 72hrs (Figure 3.2B). Additionally,
for CD8+ T cells, there was an increase in percentage of cells that had proliferated from
66.5% to 73.5% at 72hrs and an increase from 69% to 81.9% at 96hrs (Figure 3.3B).
These data suggests that hBD-2 treatment can induce T cell proliferation at 72hrs and
96hrs.
As discussed previously, the expression of FoxP3 in CD4+CD25high Treg cells is
significantly down-regulated following 42hrs incubation with 10ug/ml of hBD-2 in
these same CD4+CD25High T cells, which may imply defective immunosuppression of
CD4+CD25high Tregs. Tregs are a distinct lineage among newly arising CD4+
thymocytes in expressing CD25. Additionally, it has been previously reported that
CD4+FoxP3+ Tregs suppress virus-specific CD8+ T cells proliferation and production of
cytotoxic molecules. The depletion of Treg cells induced CD43+ effector CD8+ T cells
to enhanced the levels of the cytotoxic molecules, such as granzyme A and B
(Zelinskyy et al., 2013). We hypothesise that down-regulation of FoxP3 in Tregs would
result in an increase of CD8+ T cell proliferation due to impaired Treg suppressive
30
In summary, in vitro proliferation assay using CFSE stained PBMCs revealed that
hBD-2 treatment enhances proliferation of both CD4+ and CD8+ T cells following 72hrs and
96hrs culture. These data suggests that any negative control of proliferation provided by
the FoxP3+ Tregs of these CD4+ T cells has been partially lost (Figure 3.2 and 3.3).
Figure 3.2 hBD-2 treatment induces CD4+ T cells proliferation in vitro. A. PBMCs
were stained with CFSE (5µM) prior to the stimulation with soluble anti-human CD3
(0.005μg/ml) and anti-human CD28 (0.005μg/ml) and co-incubated in the presence or
[image:41.595.121.508.198.637.2]31
to promote T cell proliferation. After 72hrs and 96hrs incubation, cells were stained and
analyzed by flow cytometry. Data were collected from 3 independent experiments (n=3).
Statistical analysis was performed using Student t test. *p<0.05 versus stimulated control (Stim Co). B. Dot-plots and peak-plots of CFSE fluorescence intensity in CD4+
[image:42.595.121.525.208.678.2]T cells.
Figure 3.3 hBD-2 treatment induces CD8+ T cell proliferation in vitro. A. PBMCs were
32
(0.005μg/ml) and anti-human CD28 (0.005μg/ml) and co-incubated in the presence or
absence of 1, 3 and 10μg/ml hBD-2. Recombinant human IL-2 (0.02μg/ml) was added
to promote T cell proliferation. After 72hrs and 96hrs incubation, cells were stained and
analyzed by flow cytometry. Data were collected from 3 independent experiments
(n=3).Statistical analysis was performed using Student t test. *p<0.05 versus stimulated control (Stim Co). B. Dot-plots and peak-plots of CFSE fluorescence
intensity in CD8+ T cells.
3.2.3 Co-culture with hBD-2 reduces induction of T cell apoptosis at 18hrs but
enhances levels of apoptosis at 42hrs.
In order to analyse the level of apoptosis induced in CD4+ T cells by treatment with
hBD-2, PBMCs were stained with Annexin-V to characterise any apoptotic cells
following αCD3/28 co-stimulation in the presence and absence of hBD-2. Annexin-V is
a phospholipid-binding protein that is capable of binding with phosphatidylserine (PS).
In normal cells, PS is located in the inner leaflet of the cytoplasm membrane. However,
upon initiation of apoptosis, PS loses its asymmetric distribution across the cell
membrane and is trans-located to the cell surface. This then allows Annexin V, labelled
with fluorescence, to bind to PS on the cell surface of the membrane indicating
apoptosis occurring in cells.
Results presented in Figure 3.4 indicated that, at 18hrs, there was a small but significant
decrease in Annexin-V expression following treatment with hBD-2 which suggested
that the apoptosis of CD4+ T cells was partially suppressed in the presence of 10μg/ml
hBD-2 (Figure 3.4, left hand panel). However, at 42hrs, there was a significant increase
observed in Annexin-V staining which suggested that the apoptosis of CD4+ T cells was
33
hand panel). These data suggest that hBD-2 may play a role in inhibiting CD4+ T cells
apoptosis at 18hrs and induce CD4+ T cells apoptosis at 42hrs. According to a recently
published paper, hBD-3 was found to be capable of suppressing neutrophil apoptosis by
up-regulating in expression of Bcl-x(L) and suppressing the activation of caspase-3
(Nagaoka et al., 2010). However no role has been documented to date for a
pro-apoptotic effect of hBD-2 on immune cells making these findings particularly
interesting
Figure 3.4 Annexin-V staining on CD4+ T cells at 18hrs and 42hrs. PBMCs were
stimulated with soluble anti-human CD3 (0.005μg/ml) and anti-human CD28
(0.005μg/ml) and treated with 1, 3 and 10μg/ml hBD-2. After staining by cell surface
markers, cell suspension was washed by Annexin-V binding buffer. FITC-conjugated
Annexin-V was added in cell suspension with a recommended concentration by the
manufacturer‟s instructions. Data were collected from 3 independent experiments (n=3).
34
3.2.4 hBD-2 and hBD-3 induce the appearance of a CD69+CD25-CCR6+ subset at
18hrs, but at 42hrs, hBD-2 and hBD-3 induced the appearance of a
CD69+CD25+CCR6- subset and a CD69-CD25+CCR6- subset.
CCR6 is a CC chemokine receptor which is an important receptor that is involved in
regulating several many aspects of mucosal immunity (Ito et al., 2011). It has been
reported that not only the chemokine CCL20, but also the non-chemokine peptides
hBD-2 and hBD-3 can function as ligands for human CCR6 (Yang, 1999, Schutyser et
al., 2003). In order to investigate whether expression of CCR6 was required for hBD-2
induced CD4+ T cell activation, this CCR6+ population was looked at specifically.
Firstly, we analysed the percentage of CCR6+CD4+ T cells in the PBMCs