FINITE ELEMENT ANALYSIS AND DESIGN OF SUSPENDED
STEEL-FIBRE REINFORCED CONCRETE SLABS
OLUGBENGA BABAJIDE SOYEMI
A thesis submitted in partial fulfilment of the requirements of the University of East London for the degree of Doctor of Philosophy
i
Abstract
Over the last 20 years, there has been a rapid expansion in the construction of pile-supported and elevated steel-fibre-reinforced [SFRC] concrete slabs. The use of fibres to replace some or all of the conventional steel reinforcement leads to a significant reduction in construction time. However, current guidance is limited and is dominated by approximate elastic and plastic classical solutions. The design guidelines and construction of the majority of constructed SFRC slabs is almost entirely proprietary (provided by fibre manufacturers and suppliers) and different guidelines from nations (embedded with safety concerns). As a result, designers are unwilling to underwrite current designs in the absence of adequate independent guidance.
In this research work, the behaviour of suspended SFRC slabs was studied under concentrated loadings. Available experimental data were used to study the effect of steel fibres on the post-cracking response of concrete. Subsequently, the SFRC constitutive model proposed by Lok and Xiao (1999) was adopted alongside the concrete damaged plasticity model of ABAQUS based on the validation work done. The reliability of the FE numerical model predictions was ensured by calibrating it against existing experimental data. Consequently, additional analyses were carried out examining three main case studies of SFRC slabs namely, single simply supported slabs, 4-panel pile-supported slab (i.e. statically-indeterminate) and 9-panel elevated slab. Parametric studies were carried out covering the full practical range of steel fibre dosages. The results testify that numerically steel fibres can replace rebar in slabs as obtained in the experiment and additional fibres increase the load-carrying capacity, strength and stiffness (thus enhancing response at both the serviceability and ultimate limit states). Ductility was improved by the additional Fibres, and the mode of failure was altered from brittle to ductile.
ii
List of Symbols
The following symbols were used in this thesis. Their definition is given where they were first used. Where a symbol has more than one meaning assigned to it, the correct definition will be provided where it appeared.
𝑙 Length of Fibre
𝑑 Equivalent diameter of a fibre 𝜎𝐶 Compressive stress in the concrete
𝑓𝑐𝑚 Mean value of concrete cylinder compressive strength 𝑓𝑐 Peak stress
𝑓𝑦 Characteristic strength in steel 𝜎𝑤 Traction applied to the crack surface 𝐸𝑐𝑚 Modulus of elasticity in compression 𝐸𝑐 Modulus of elasticity of concrete 𝐸𝑠 Modulus of elasticity of steel
𝑓𝑐𝑘 Characteristic compressive cylinder strength of concrete at 28 days
𝜀𝑐 Compressive strain in concrete
𝜀𝑐1 Compressive strain in concrete at the peak stress 𝜀𝑐𝑢 Ultimate Compressive strain in concrete
𝜎𝑤 Stress at crack area
𝑃 Applied load [maximum load obtained] 𝐴𝑛 Cross-sectional area at the notch 𝛿 Displacement
𝑤 Crack width
𝛿𝑝 Average displacement at peak stress 𝐷𝐵𝑍𝑏 Energy absorption capacity [plain concrete]
𝐷𝐵𝑍,2𝑓 Energy absorption capacity [influences of steel fibres] 𝐷𝐵𝑍,3𝑓 Energy absorption capacity [influences of steel fibres] ML Moment at mid-span
fL Load at the limit of proportionality Py Yield Load
Pmax Peak Load
L Span of the beam specimen 𝑏 Width of the failed cross-section ℎ Height of the failed section 𝑇𝑏 Flexural toughness
𝛿𝑡𝑏 Deflection of 1/150 of span
𝑙𝑐𝑠 Structural characteristic length
𝛾𝑐 Partial safety factor for SFRC in compression
𝛾𝑐𝑡 Partial safety factor for SFRC in tension
𝑙𝑥 Shorter side of a slab
𝑙𝑦 Longer side of a slab
iii 𝑀𝑝 Positive [sagging] moment 𝑀𝑛 Negative [hogging] moment 𝑞𝑢 UDL
𝐿𝑒 Effective span 𝑄𝑡 Line load
𝑞𝑠𝑤 Self-weight of the pile supported slab 𝐿1 Pile to pile centres in x-direction 𝐿2 Pile to pile centres in y-direction 𝐴 Cross-sectional area of the pile
𝑙ℎ Effective dimension 𝑙ℎ of the column head 𝑙ℎ0 Actual dimension of the column head
𝑙𝑐 Column dimension measured in the same direction as 𝑙ℎ 𝑑ℎ Drop height
𝑉𝑒𝑓𝑓 Design effective shear force
𝑉𝑡 Design shear transferred to the column 𝑣 Shear stress on a failure zone
𝑣𝑚𝑎𝑥 Maximum shear stress at the face of the column 𝑢0 Perimeter of the column
𝜏𝑑 Bond stress 𝑓𝑡𝑢 Flexural Strength
𝜀𝑡1 Corresponding strain to the flexural strength 𝑀𝑐𝑟 Crack Moment
𝑀𝑢𝑙𝑡 Ultimate Moment 𝑓𝑢𝑙𝑡 Ultimate Load
𝜎𝑐 Compressive Strength 𝐺𝑓 Fracture energy
𝐸0 Uniaxial initial tangent modulus 𝑣 Poisson's ratio
𝛼 Mean coefficient of thermal expansion 𝜎𝑡 Uniaxial cut-off tensile stress
𝜎𝑡𝑝 Post-cracking uniaxial cut-off tensile stress 𝜎𝑐 Uniaxial maximum compressive stress
𝑒𝑐 Uniaxial compressive strain at 𝜎𝑐 𝜎𝑢 Uniaxial ultimate compressive stress u 𝑒𝑢 Uniaxial strain at 𝜎𝑢
iv
Abbreviations
ACI America Concrete Institute
ADINA Automatic Dynamic Incremental Nonlinear Analysis BSI British Standard Institute
CBC Concrete Brittle Cracking CDP Concrete Damaged Plasticity CSC Concrete Smeared Cracking
CMOD Crack Mouth Opening Displacement CTOD Crack Tip Opening Displacement
ESFRC Elevated Steel Fibre Reinforced Concrete FEA Finite Element Analysis
FEM Finite Element Method LFEA Linear Finite Element Analysis
LVDT Linear Vertical Displacement Transducers MFRC Metal-Fibre Reinforced Concrete
MFRC Metal-Fibre Reinforced Concrete NLFEA Non-Linear Finite Element Analysis SCC Self Compacting Concrete
SFRC Steel-Fibre Reinforced Concrete
SFRSCC Steel-Fibre Reinforced Self Compacting Concrete SLS Serviceability Limit State
v
List of Figures
Figure 1.1: Plain concrete in bending 2
Figure 1.2: (a) Crack Patter in Concrete with No Reinforcement when
Load is applied 3
(b) Crack Patter in Concrete with Steel Reinforcement when
Load is applied 3
Figure 1.3: Typical Slab Reinforcement laid on [a] Pile Foundation and
[b] columns 4
Figure 1.4: A Typical Pile-Supported Slab Layout 5
Figure 1.5: Pile-Supported Floor Slab for Warehouse Partly finished 6
Figure 1.6: Applications of FRC 11
Figure 1.7: Research Outlay 13
Figure 2.1: Sources of Fibres 19
Figure 2.2: Types of Steel-Fibre (The Concrete Society TR63, 2007) 21 Figure 2.3: DramixTM RC-65/35-BN and [b] TABIX-Twincone (Bekaert, 2012,
ArcelorMittal, 2011) 21
Figure 2.4: Stress-Strain Relation of concrete in compression (BSI 2004) 23 Figure 2.5: Stress-strain graph adapted from (Kooiman, 2000) 24 Figure 2.6: Setup of [a] Flexural test on notched beam [b] Fracture energy
evaluation 25
Figure 2.7: Typical stress distributions in a concrete section subjected to
four-point bending (Tlemat et al., 2006a) 26
Figure 2.8: Schematic description of stress-crack opening for [a] plain
concrete and [b] SFRC. Adapted from (Löfgren, 2005) 27 Figure 2.9: High performance SFRC. Adapted from (Kooiman, 2000) 28 Figure 2.10: Typical set-up for uni-axial tension testing (RILEM, 2001) 29 Figure 2.11: Crack width Opening w calculation (RILEM, 2001) 30 Figure 2.12: 3-Point bending test set-up (Fall, 2014) 30 Figure 2.13: [a-c] Load – deflection graphs [d] Load-CMOD graph 31 Figure 2.14: 4-point bending test adapted from (Kooiman, 2000) 33
Figure 2.15: Load – deflection Curve (JCI Test) 33
Figure 2.16: Schematic diagram of statically determinate round panel
(Bernard, 2000) 34
Figure 2.17: Load-deflection responses of [a] beams and [b] plates
(Sukontasukkul, 2003) 35
Figure 2.18: Compressive Stress-Strain of SFRC adapted from BS 8110 38 Figure 2.19: Tensile Stress-Strain Relationship adapted from
(Lok and Xiao, 1998) 39
Figure 2.20: Compression stress-strain diagram (Barros and Figueiras, 1999) 42 Figure 2.21: Proposed tensile stress-strain diagram adapted from
(Barros and Figueiras, 1999) 43
Figure 2.22: Schematic representation of fracture energy evaluation
adapted from (Barros and Figueiras, 1999) 43
Figure 2.23: Stress-Strain Diagram adapted from (RILEM, 2002b) 44 Figure 2.24: 3-Point Bending Test with 25mm Notch adapted from
vi
Figure 2.25: Load-Displacement Diagram adapted from (RILEM, 2000) 45 Figure 2.26: Tensile behaviour of SFRC adapted from (Lok and Xiao, 1998) 46 Figure 2.27: Stress-Strain constitutive model adapted from
(Lok and Xiao, 1999) 47
Figure 2.28: One and Two-way slabs 51
Figure 2.29: Yield Line Development in 2-way slab 53
Figure 2.30: Folded plate yield line mechanism
(The Concrete Society TR34, 2014) 54
Figure 2.31: Folded plate yield line mechanism
(The Concrete Society TR34, 2014) 55
Figure 2.32: Fan yield line mechanism at pile
(The Concrete Society TR34, 2014) 56
Figure 2.33: Diagrammatic Representation of Modelling Pile-Supported
SFRC slabs in [a] 3D-Brick and [b] spring 57
Figure 2.34: Flat slab arrangement for a floor with [a] square columns and
[b] drop panels (British Standard Institute, 1997) 60 Figure 2.35: Punching Shear Failure Mechanism Misconception 64
Figure 2.36: Punching Shear Failure Mechanism 64
Figure 2.37: Punching Shear at the support or loading area 67 Figure 2.38: Simplified stress block adapted from (TR 63, 2007) 72 Figure 2.39: Simplified stress block at ULS adapted from (NEN 6720) 73 Figure 2.40: Simplified stress block at SLS adapted from (NEN 6720) 74 Figure 2.41: Simplified stress block adapted fib Model Code 2010 (MC2010) 77
Figure 3.1: Truss Elements available in ADINA (adapter from ADINA 2012) 91 Figure 3.2: 2-D Solid Elements (adapter from ADINA 2012) 92 Figure 3.3: 3-D Solid elements adapted from (ADINA, 2012) 93 Figure 3.4: Linear and Bilinear Stress-Strain Models for Steel 94 Figure 3.5: Uniaxial stress-strain relation adapted from (ADINA, 2012) 95 Figure 3.6: Three-dimensional tensile failure envelope of concrete model
(ADINA 2012) 98
Figure 3.7: Biaxial concrete compressive failure envelope (adapter from
ADINA 2012) 99
Figure 3.8: Triaxial compressive failure envelope (adapter from ADINA 2012) 99 Figure 3.9: Material Moduli for Stress Calculation after Tensile Failure
(adapter from ADINA 2012) 101
Figure 3.10: Stress-strain behaviour of DF-concrete adapted from
(ADINA, 2012) 102
Figure 3.11: Failure Surface of the Data Fitted Concrete Material Model
(adapter from ADINA 2012) 103
Figure 3.12: First crack formation of the data fitted concrete material model
(a) before, and (b) after 104
Figure 3.13: Second crack formation of the data fitted concrete material
model (a) before, and (b) after 104
Figure 3.14: Third crack formation of the data fitted concrete material model
(a) before, and (b) after 104
vii
Figure 3.16: Element models in ABAQUS adapted from ABAQUS (2009) 108 Figure 3.17: ABAQUS 2-D Solid Elements (adapter from ABAQUS 2012) 109 Figure 3.18: ABAQUS 3-D Solid Elements (adapter from ABAQUS 2012) 110 Figure 3.19: Uniaxial concrete behaviour adapted from (ABAQUS, 2009) 112 Figure 3.20: Tension Stiffening Model (adapter from ABAQUS 2012) 113 Figure 3.21: Stress-Strain Relation of concrete in compression adapted from
(BS EN 1992-1-1) 116
Figure 3.22: Compressive inelastic (or crushing) strain defining compression
hardening dataadapted from ABAQUS (2012) 117
Figure 3.23: Response of Concrete to Uniaxial Loading in Compression
adapted from ABAQUS (2012) 118
Figure 3.24: Compressive Stress-Strain Curve 119
Figure 3.25: Response of Concrete to Uniaxial Loading in tension
adapted from ABAQUS (2012) 119
Figure 3.26: Tensile Stress-Strain Curve based on Lok and Xiao (1999) 120 Figure 3.27: Post-Failure Stress-Strain Curve adapted from ABAQUS (2012) 120 Figure 3.28: Power Law Form of the Shear Retention Model adapted from
ABAQUS (2012) 121
Figure 3.29: Stress-strain graph Adapted from (RILEM, 2000) 123 Figure 3.30: Schematic diagrams of crack opening without and with fibres
adapted from (RILEM, 2002a) 124
Figure 3.31: The principle of [a] single cracking and [b] multiple cracking
adapted from (RILEM, 2002a) 124
Figure 3.32: Round-Plate simply supported over (a) Isolated, (b) Continuous
Supports and (c) Square-Panel with Edge supports 126 Figure 3.33: 4-Panel SFRC Slab (a) without rebar and (b) with rebar 127
Figure 3.34: 9-Panel SFRC Slab 128
Figure 4.1: Cross-section of the Bresler-Scordelis (1963) beam 132 Figure 4.2: Test setup for Bresler-Scordelis (1963) beam 133 Figure 4.3: FE Model of Bresler-Scordelis (1963) beam 133 Figure 4.4: Load-Deflection Graph for Sensitivity Analysis
Bresler-Scordelis (1963) beam [ADINA] 133
Figure 4.5: Load-Deflection Graph for Sensitivity Analysis
Bresler-Scordelis (1963) beam [ABAQUS] 134
Figure 4.6: FE Model of Bresler-Scordelis (1963) Beam [a] ADINA and
[b] ABAQUS 135
Figure 4.7: Crack pattern in Bresler-Scordelis (1963) beam [Experiment] 135 Figure 4.8: Crack pattern for Bresler-Scordelis (1963) beam [ADINA] 136 Figure 4.9: Crack pattern for Bresler-Scordelis (1963) beam [ABAQUS] 137 Figure 4.10: Load-Deflection curve for Bresler-Scordelis (1963) beam 138 Figure 4.11: Load-Deflection curve for Bresler-Scordelis (1963) beam 139 Figure 4.12: Load-Deflection curve [Best Fits] for Bresler-Scordelis (1963)
beam 139
viii
Figure 4.16: Crack pattern in Hughes and Speirs (1982) Beam [ABAQUS] 143 Figure 4.17: Load-Deflection curve of Hughes and Speirs (1982) Beam [ADINA] 143 Figure 4.18: Load-Deflection curve of Hughes and Speirs (1982) Beam
[ABAQUS] 143
Figure 4.19: Load-Deflection curve [Best Fits for ADINA and ABAQUS] 144 Figure 4.20: Experiment Setup for Barros et al SFRC Beam 2005 145 Figure 4.21: Tensile Stress-Strain Curve for Constitutive Models Barros et al
SFRC Beam 2005 147
Figure 4.22: Crack-Pattern in [a] ADINA-Conc, [b] ABAQUS and [c] ADINA-DF
for Barros et al SFRC Beam 2005 148
Figure 4.23: Barros et al SFRC Beam (2005) Load-Displacement Curve
[ABAQUS] 148
Figure 4.24: Barros et al SFRC Beam (2005) Load-Displacement Curve [ADINA] 149 Figure 4.25: SFRC tensile Modelling in [a] ADINA-Conc and [b] ADINA-DF 149 Figure 4.26: Experiment Setup for de Montaignac et al (2011) SFRC Beam 150 Figure 4.27: Tensile Stress-Strain Curve for de Montaignac et al SFRC Beam
(2011) 151
Figure 4.28: Crack Pattern for de Montaignac et al SFRC Beam (2011) 152 Figure 4.29: Load-Displacement Curve for de Montaignac et al SFRC Beam
(2011) 153
Figure 4.30: Experimental Set-up for Tlemat et al (2006) SFRC Beam 154 Figure 4.31: Tensile Stress-Strain Curve for Tlemat et al SFRC Beam (2006)
with Vf = 1.5% 154
Figure 4.32: Crack patterns for Tlemat et al (2006) [ABAQUS] 156 Figure 4.33: Load-Displacement Curve for Tlemat et al SFRC Beam (2006) 156 Figure 4.34: Experiment Setup for Olivito and Zuccarello’s SFRC Beam (2010) 157 Figure 4.35: Tensile Stress-Strain Curve for Olivito and Zuccarello’s SFRC Beam
(2010) 158
Figure 4.36: Crack patterns for Olivito and Zuccarello’s SFRC Beam (2010) 159 Figure 4.37: Load-Displacement Curve for Olivito and Zuccarello’s SFRC Beam
(2010) 159
Figure 4.38: Panel Testing in the Lab Hadi (2008) Square Plate 160 Figure 4.39: Tensile Stress-Strain Curve for Hadi’s SFRC Square Panel (2008) 161 Figure 4.40: Crack patterns in Hadi’s SFRC Slab (2008) [a] ABAQUS and
[b] ADINA 162
Figure 4.41: Load-Displacement Curve for Hadi’s SFRC Slab (2008) [a] ABAQUS
and [b] ADINA 163
Figure 4.42: Tensile Stress-Strain Curve for Blanco et al’s SFRC Panel (2015) 164 Figure 4.43: Crack Pattern Results [a] Experiment and [b] ABAQUS CDP 166 Figure 4.44: Load-Displacement Curve for Blanco et al’s SFRC Panel (2015) 166 Figure 4.45: Experiment Set-up Montaignac et al RP (2011) 167 Figure 4.46: Crack patterns Top and Bottom [ABAQUS] Montaignac et al RP
(2011) 168
ix
(2007) 170
Figure 4.51: NLFEA Results of Soranakom et al Round Plate (2007)
[a] Crack Pattern [b] Displacement and [c] Reaction at the support 172 Figure 4.52: Load-Displacement Curve for Soranakom et al Round Plate (2007) 172 Figure 4.53: Experimental set-up for Bernard (2000) Round Plate 173 Figure 4.54: Tensile Stress-Strain Curve for Bernard (2000) Round Plate 174 Figure 4.55: Crack Patterns in Bernard (2000) Round Plate [a] pictorial diagram
of collapse mechanism [b] x-z section of the damaged panel through the centre [c] FEA crack pattern at full damage
[d] FEA crack propagation at early stage 175
Figure 4.56: Load-Displacement Curve for Bernard (2000) Round Plate 175 Figure 4.57: FE representation of the Test set-up for Destree and Mandl (2008) 176 Figure 4.58: FEA Results showing Cracking Pattern at (a) bottom and
(b) internal 177
Figure 4.59: Experimental Set-up of Thooft (1999) 4-Panels Slab 178 Figure 4.60: Tensile Stress-Strain Curve for Thooft (1999) Pile-Supported Slab 179 Figure 4.61: Top and Bottom face after cracking in Experimental work
(Thooft, 1999) 180
Figure 4.62: FEA Results showing Cracking Pattern at (a) Top and (b) Bottom 180 Figure 4.63: Load-Displacement Curve for Thooft (1999) Pile-Supported Slab 181 Figure 4.64: Geometry of the built prototype (Barros et al 2012) 181
Figure 4.65: Prototype model of Barros et al (2012) 182
Figure 4.66: FEA Modelling of Barros et al (2012) slab 183 Figure 4.67: FEA Crack pattern of Barros et al slab [a] top and [b] bottom 183
Figure 5.1: Dimensions of Round-Plate adapted from
(de Montaignac et al., 2011) 188
Figure 5.2: Tensile Stress-strain Parameters for SFRC
(de Montaignac et al., 2011) 189
Figure 5.3: Tensile Stress-strain Parameters for SFRC at fcu with
Different fibre volume ratios 190
Figure 5.4: Frequency-Time input Data for Loading 191
Figure 5.5: Load-Displacement Curve for range of 𝑉𝑓 192 Figure 5.6: Load-Displacement Curve for range of 𝑉𝑓 = 1.00% - 2.50% 193
Figure 5.7: Load-Displacement Curve for range of 𝑉𝑓 at 𝑓𝑐𝑘= 30MPa – 60MPa 195 Figure 5.8: Yield load and Fibre Volume Ratio Graphs for 𝑉𝑓 200 Figure 5.9: Peak load and Fibre Volume Ratio Graphs for 𝑓𝑐𝑢 200
Figure 5.10: Displacement at Yield load and Fibre Volume Ratio Graphs for 𝑓𝑐𝑢 202
Figure 5.11: Displacement at Peak load and Fibre Volume Ratio Graphs for 𝑓𝑐𝑢 202 Figure 5.12: Tensile Strain-Displacement Curve for range of 𝑉𝑓 203 Figure 5.13: Load-Displacement Curve for range of 𝑉𝑓 up to 35mm
displacement 203
Figure 5.14: Tensile Strain-Displacement Curve for range of 𝑉𝑓 [a=1.00,
b=1.25, c=1.50, d=1.75, e=2.00 and f=2.5%] 204
Figure 5.15: Principal strain contour for Case Study 1A with 𝑉𝑓 [a= 1.00,
b=1.25, c=1.50, d=1.75, e=2.00 and f=2.50%] 208
x
[b] 1.25% [c] 1.50% [d] 1.75% [e] 2.00% and [f] 2.50% 209 Figure 5.17: Principal strain vector [section y-y] for Case Study 1A with 𝑉𝑓 =
[a] 1.00% [b] 1.25% [c] 1.50% [d] 1.75% [e] 2.00% and [f] 2.50% 210 Figure 5.18: Compressive Damaged patterns at the bottom of the round-plate
with 𝑉𝑓 = [a] 1.00% [b] 1.25% [c] 1.50% [d] 1.75% [e] 2.00% and
[f] 2.50% 211
Figure 5.19: Compressive Damaged patterns at the top of the round-plate with 𝑉𝑓 = [a] 1.00% [b] 1.25% [c] 1.50% [d] 1.75% [e] 2.00% and
[f] 2.50% 211
Figure 5.20: Tensile Damaged patterns at the bottom of the round-plate with 𝑉𝑓 = [a] 1.00% [b] 1.25% [c] 1.50% [d] 1.75% [e] 2.00% and
[f] 2.50% 212
Figure 5.21: Tensile Damaged patterns at the bottom of the round-plate with 𝑉𝑓 = [a] 1.00% [b] 1.25% [c] 1.50% [d] 1.75% [e] 2.00% and
[f] 2.50% 212
Figure 5.22: Deflected Shapes [y-y] for the round-plate with 𝑉𝑓 = [a] 1.00%
[b] 1.25% [c] 1.50% [d] 1.75% [e] 2.00% and [f] 2.50% 213 Figure 5.23: Graph of 𝑉𝑓 against 𝑃𝑚𝑎𝑥⁄𝑃𝑚𝑎𝑥𝑐 for 𝑓𝑐𝑢 for Case Study 1A 214
Figure 5.24: Graph of 𝑉𝑓 against 𝑃𝑦⁄𝑃𝑦𝑐 for 𝑓𝑐𝑢 for Case Study 1A 214 Figure 5.25: Graph of 𝑉𝑓 against 𝜇/𝜇c for 𝑓𝑐𝑢 for Case Study 1A 215 Figure 5.26: Schematic representation of experimental set-up for Case
Study 1B 215
Figure 5.27: Tensile Stress-strain Parameters for SFRC round-Panel in Case
Study 1B 216
Figure 5.28: Load-Displacement Curve for range of 𝑉𝑓 for Case Study 1B 217 Figure 5.29: Deflected Shapes [y-y] for the Case Study 1B round-plate with
𝑉𝑓 = [a] 1.00% [b] 1.25% [c] 1.50% [d] 1.75% [e] 2.00% and
[f] 2.50% 219
Figure 5.30: Principal strain contour for Case Study 1B with 𝑉𝑓 [a= 1.00,
b=1.25, c=1.50, d=1.75, e=2.00 and f=2.50%] 220
Figure 5.31: Principal strain vector for Case Study 1B with 𝑉𝑓 = [a] 1.00%
[b] 1.25% [c] 1.50% [d] 1.75% [e] 2.00% and [f] 2.50% 221 Figure 5.32: Principal strain vector for Case Study 1B [section y-y] with 𝑉𝑓 =
[a] 1.00% [b] 1.25% [c] 1.50% [d] 1.75% [e] 2.00% and [f] 2.50% 222 Figure 5.33: Tensile Damaged patterns at the top of the round-plate with
𝑉𝑓 = [a] 1.00% [b] 1.25% [c] 1.50% [d] 1.75% [e] 2.00% and
[f] 2.50% 223
Figure 5.34: Tensile Damaged patterns at the bottom of the round-plate with 𝑉𝑓 = [a] 1.00% [b] 1.25% [c] 1.50% [d] 1.75% [e] 2.00% and
[f] 2.50% 224
Figure 5.35: Compressive Damaged patterns at the top of the round-plate with 𝑉𝑓 = [a] 1.00% [b] 1.25% [c] 1.50% [d] 1.75% [e] 2.00% and
[f] 2.50% 225
Figure 5.36: Compressive Damaged patterns at the bottom of the round-plate with 𝑉𝑓 = [a] 1.00% [b] 1.25% [c] 1.50% [d] 1.75% [e] 2.00% and
xi
Figure 5.37: Graph of 𝑉𝑓 against 𝑃𝑚𝑎𝑥⁄𝑃𝑚𝑎𝑥𝑐 for Case Study 1B 227 Figure 5.38: Graph of 𝑉𝑓 against 𝜇𝑦⁄𝜇𝑐 for Case Study 1B 227 Figure 5.39: Schematic representation of the experimental set-up for Case
Study 1C 228
Figure 5.40: Tensile stress-strain diagram 229
Figure 5.41: Load-Displacement Curves of Experiment and FEA 229 Figure 5.42: Tensile Stress-Strain Curve for Input Parameters for 𝑉𝑓 230
Figure 5.43: Load-Displacement Curve for 𝑉𝑓 231
Figure 5.44: Principal Strain Contours [section y-y] for Case Study 1C with 𝑉𝑓 = [a] 1.00% [b] 1.25% [c] 1.50% [d] 1.75% [e] 2.00% and
[f] 2.50% 232
Figure 5.45: Principal Strain Contours for Case Study 1C with 𝑉𝑓 = [a] 1.00%
[b] 1.25% [c] 1.50% [d] 1.75% [e] 2.00% and [f] 2.50% 233 Figure 5.46: Principal Strain Vectors for Case Study 1C with 𝑉𝑓 = [a] 1.00%
[b] 1.25% [c] 1.50% [d] 1.75% [e] 2.00% and [f] 2.50% 234 Figure 5.47: Tensile Damaged patterns at the bottom of the square-panel
with 𝑉𝑓 = [a] 1.00% [b] 1.25% [c] 1.50% [d] 1.75% [e] 2.00% and
[f] 2.50% 235
Figure 5.48: Compressive Damaged patterns at the bottom of the
square-panel with 𝑉𝑓 = [a] 1.00% [b] 1.25% [c] 1.50% [d] 1.75%
[e] 2.00% and [f] 2.50% 236
Figure 5.49: Deflected Shapes [x-y plane] for the Case Study 1C square-panel with 𝑉𝑓 = [a] 1.00% [b] 1.25% [c] 1.50% [d] 1.75% [e] 2.00% and
[f] 2.50% 237
Figure 5.50: Graph of 𝑉𝑓 against 𝑃𝑚𝑎𝑥⁄𝑃𝑚𝑎𝑥𝑐 for Case Study 1C 238
Figure 5.51: Graph of 𝑉𝑓 against 𝜇⁄𝜇𝑐 for Case Study 1C 238
Figure 6.1: Experimental Set-up (Thooft 1999) 243
Figure 6.2: Tensile Stress-Strain Curve 245
Figure 6.3: Load-Displacement Curve for Sensitivity Analysis 245 Figure 6.4: Tensile Stress-Strain Curves for different fibre volume ratios [𝑉𝑓] 246 Figure 6.5: Loading Pattern of Slab without Rebar [Full and Quarter-Size] 247 Figure 6.6: Load-Displacement Curves for Experiment and FEA 249 Figure 6.7: Comparison between Experimental and FEA Crack Pattern [Top] 250 Figure 6.8: Comparison between Experimental and FEA Crack Pattern [Soffit] 250 Figure 6.9: Principal Strain Vector and Deflected Shape of FEA Model 251 Figure 6.10: Load-Displacement Curves for various 𝑉𝑓 under Dual Loading 253 Figure 6.11: Principal Strain Contours for Pile-Supported SFRC Slab without
Rebar with 𝑉𝑓 [a]= 1.00%, [b]= 1.25%, [c]= 1.50%, [d]= 1.75%,
[e]= 2.00% and [f]= 2.5% 254
Figure 6.12: Principal Strain Vectors for Pile-Supported SFRC Slab without Rebar with 𝑉𝑓 [a]= 1.00%, [b]= 1.25%, [c]= 1.50%, [d]= 1.75%,
[e]= 2.00% and [f]= 2.5% 256
Figure 6.13: Deflected Shapes for Pile-Supported SFRC Slab without Rebar with 𝑉𝑓 [a]= 1.00%, [b]= 1.25%, [c]= 1.50%, [d]= 1.75%,
xii
Figure 6.14: Tensile Damaged Shapes for Pile-Supported SFRC Slab without Rebar with 𝑉𝑓 [a]= 1.00%, [b]= 1.25%, [c]= 1.50%,
[d]= 1.75%, [e]= 2.00% and [f]= 2.5% 258
Figure 6.15: Graph of 𝑉𝑓 against 𝑃𝑚𝑎𝑥⁄𝑃𝑚𝑎𝑥,𝑐 260 Figure 6.16: Graph of 𝑉𝑓 against 𝑃𝑦⁄𝑃𝑦,𝑐 260
Figure 6.17: Graph of 𝑉𝑓 against 𝜇 𝜇⁄ 𝑐 261
Figure 6.18: Load-Displacement Curves for various 𝑉𝑓 with 𝑓𝑐𝑢=30MPa
[Slab without Rebar] 263
Figure 6.19: Load-Displacement Curves for various 𝑉𝑓 with 𝑓𝑐𝑢=40MPa
[Slab without Rebar] 263
Figure 6.20: Load-Displacement Curves for various 𝑉𝑓 with 𝑓𝑐𝑢=50MPa
[Slab without Rebar] 263
Figure 6.21: Graph of 𝑉𝑓 against 𝑃𝑦⁄𝑃𝑦,𝑐 with varying 𝑓𝑐𝑢
[Slab without Rebar] 264
Figure 6.22: Graph of 𝑉𝑓 against 𝑃𝑚𝑎𝑥⁄𝑃𝑚𝑎𝑥,𝑐 with varying 𝑓𝑐𝑢
[Slab without Rebar] 264
Figure 6.23: Loading Pattern of Slab with Rebar [Full and Quarter-Size] 266 Figure 6.24: Load-Displacement Curves for Experiment and FEA
[Slab with Rebar] 268
Figure 6.25: Comparison between Experimental and FEA Crack Pattern [a] Top
and [b] soffit [Slab with Rebar] 269
Figure 6.26: Damaged Plasticity and Principal Strain Vector Shape of FEA
Model [Slab with Rebar] 269
Figure 6.27: Load-Displacement Curves for various 𝑉𝑓 [Slab with Rebar] 271 Figure 6.28: Principal Strain Contours for Pile-Supported SFRC Slab with Rebar
with 𝑉𝑓 [a]= 1.00%, [b]= 1.25%, [c]= 1.50%, [d]= 1.75%,
[e]= 2.00% and [f]= 2.5% 272
Figure 6.29: Principal Strain Vectors for Pile-Supported SFRC Slab with Rebar with 𝑉𝑓 [a]= 1.00%, [b]= 1.25%, [c]= 1.50%, [d]= 1.75%,
[e]= 2.00% and [f]= 2.5% 273
Figure 6.30: Deflected Shapes for Pile-Supported SFRC Slab with Rebar with 𝑉𝑓 [a]= 1.00%, [b]= 1.25%, [c]= 1.50%, [d]= 1.75%,
[e]= 2.00% and [f]= 2.5% 274
Figure 6.31: Tensile Damaged Shapes for Pile-Supported SFRC Slab with Rebar with 𝑉𝑓 [a]= 1.00%, [b]= 1.25%, [c]= 1.50%, [d]= 1.75%,
[e]= 2.00% and [f]= 2.5% 275
Figure 6.32: Graph of 𝑉𝑓 against 𝑃𝑚𝑎𝑥⁄𝑃𝑚𝑎𝑥,𝑐 [Slab with Rebar] 276
Figure 6.33: Graph of 𝑉𝑓 against 𝑃𝑦⁄𝑃𝑦,𝑐 [Slab with Rebar] 277 Figure 6.34: Graph of 𝑉𝑓 against 𝜇 𝜇⁄ 𝑐 [Slab with Rebar] 277 Figure 6.35: Load-Displacement Curves for various 𝑉𝑓 with 𝑓𝑐𝑢=30MPa
[Slab with Rebar] 279
Figure 6.36: Load-Displacement Curves for various 𝑉𝑓 with 𝑓𝑐𝑢=40MPa
[Slab with Rebar] 279
Figure 6.37: Load-Displacement Curves for various 𝑉𝑓 with 𝑓𝑐𝑢=50MPa
[Slab with Rebar] 279
xiii
Figure 6.39: Graph of 𝑉𝑓 against 𝑃𝑚𝑎𝑥⁄𝑃𝑚𝑎𝑥,𝑐 with varying 𝑓𝑐𝑢
[Slab with Rebar] 280
Figure 6.40: Graph of 𝑉𝑓 against 𝜇 𝜇⁄ 𝑐 with varying 𝑓𝑐𝑢 [Slab with Rebar] 281 Figure 6.41: Load-Displacement Curve for SFRC with and without Rebar 283
Figure 7.1: Picture of the full-scale testing of the 9-Panel slab (Destrée, 2001) 288
Figure 7.2: Tensile Stress-Strain Curve 289
Figure 7.3: Load-Displacement Curve for Sensitivity Analysis 289 Figure 7.4: Tensile Stress-Strain Curves for different fibre volume ratios [𝑉𝑓] 290
Figure 7.5: Loading Patterns at ULS [Full-Size] 291
Figure 7.6: Loading Pattern at ULS [Quarter-Size] for Middle Panel 292 Figure 7.7: Load-Displacement Curves for Experiment and FEA for
Middle Panel 293
Figure 7.8: Load-Displacement Curves for various fibre volume ratio 𝑉𝑓
for Middle Panel 295
Figure 7.9: Principal Strain Contours for Middle Panel with 𝑉𝑓 [a]= 1.00%,
[b]= 1.25%, [c]= 1.50%, [d]= 1.75%, [e]= 2.00% and [f]= 2.5% 296 Figure 7.10: Principal Strain Vectors for Middle Panel with 𝑉𝑓 [a]= 1.00%,
[b]= 1.25%, [c]= 1.50%, [d]= 1.75%, [e]= 2.00% and [f]= 2.5% 298 Figure 7.11: Deflected Shapes for Middle Panel with 𝑉𝑓 [a]= 1.00%,
[b]= 1.25%, [c]= 1.50%, [d]= 1.75%, [e]= 2.00% and [f]= 2.5% 299 Figure 7.12: Tensile Damaged Shapes for Middle Panel with 𝑉𝑓 [a]= 1.00%,
[b]= 1.25%, [c]= 1.50%, [d]= 1.75%, [e]= 2.00% and [f]= 2.5% 300 Figure 7.13: Graph of 𝑉𝑓 against 𝑃𝑦⁄𝑃𝑦,𝑐 for Middle Panel 302 Figure 7.14: Graph of 𝑉𝑓 against 𝑃𝑚𝑎𝑥⁄𝑃𝑚𝑎𝑥,𝑐 for Middle Panel 302 Figure 7.15: Load-Displacement Curves for various 𝑓𝑐𝑢 with fibre volume
ratio 𝑉𝑓 =1.00% for Middle Panel 304
Figure 7.16: Load-Displacement Curves for various 𝑓𝑐𝑢 with fibre volume
ratio 𝑉𝑓 =1.25% for Middle Panel 304
Figure 7.17: Load-Displacement Curves for various 𝑓𝑐𝑢 with fibre volume
ratio 𝑉𝑓 =1.50% for Middle Panel 304
Figure 7.18: Load-Displacement Curves for various 𝑓𝑐𝑢 with fibre volume
ratio 𝑉𝑓 =1.75% for Middle Panel 305
Figure 7.19: Load-Displacement Curves for various 𝑓𝑐𝑢 with fibre volume
ratio 𝑉𝑓 =2.00% for Middle Panel 305
Figure 7.20: Load-Displacement Curves for various 𝑓𝑐𝑢 with fibre volume
ratio 𝑉𝑓 =2.50% for Middle Panel 305
Figure 7.21: Graph of 𝑉𝑓 against 𝑃𝑦⁄𝑃𝑦,𝑐 with varying 𝑓𝑐𝑢 for Middle Panel 306 Figure 7.22: Graph of 𝑉𝑓 against 𝑃𝑚𝑎𝑥⁄𝑃𝑚𝑎𝑥,𝑐 with varying 𝑓𝑐𝑢 for Middle
Panel 307
Figure 7.23: Loading Pattern at ULS [Quarter-Size] for Edge Panel 310 Figure 7.24: Load-Displacement Curves for Experiment and FEA for Edge Panel 311 Figure 7.25: Load-Displacement Curves for various fibre volume ratio 𝑉𝑓
for Edge Panel 313
Figure 7.26: Comparison between Crack Patterns in Experiment and FEA
xiv
Figure 7.27: Principal Strain Contours for Edge Panel with 𝑉𝑓 [a]= 1.00%,
[b]= 1.25%, [c]= 1.50%, [d]= 1.75%, [e]= 2.00% and [f]= 2.5% 314 Figure 7.28: Principal Strain Vectors for Edge Panel with 𝑉𝑓 [a]= 1.00%,
[b]= 1.25%, [c]= 1.50%, [d]= 1.75%, [e]= 2.00% and [f]= 2.5% 315 Figure 7.29: Deflected Shapes for Edge Panel with 𝑉𝑓 [a]= 1.00%,
[b]= 1.25%, [c]= 1.50%, [d]= 1.75%, [e]= 2.00% and [f]= 2.5% 316 Figure 7.30: Tensile Damaged Shapes [Top and Soffit] for Edge Panel with
𝑉𝑓 [a]= 1.00%, [b]= 1.25%, [c]= 1.50%, [d]= 1.75%, [e]= 2.00%
and [f]= 2.5% 317
Figure 7.31: Graph of 𝑉𝑓 against 𝑃𝑦⁄𝑃𝑦,𝑐 for Edge Panel 318 Figure 7.32: Graph of 𝑉𝑓 against 𝑃𝑚𝑎𝑥⁄𝑃𝑚𝑎𝑥,𝑐 for Edge Panel 219 Figure 7.33: Load-Displacement Curves for various 𝑉𝑓 with 𝑓𝑐𝑢=30MPa for
Edge Panel 321
Figure 7.34: Load-Displacement Curves for various 𝑉𝑓 with 𝑓𝑐𝑢=40MPa for
Edge Panel 321
Figure 7.35: Load-Displacement Curves for various 𝑉𝑓 with 𝑓𝑐𝑢=50MPa for
Edge Panel 321
Figure 7.36: Graph of 𝑉𝑓 against 𝑃𝑦⁄𝑃𝑦,𝑐 with varying 𝑓𝑐𝑢 for Edge Panel 322
Figure 7.37: Graph of 𝑉𝑓 against 𝑃𝑚𝑎𝑥⁄𝑃𝑚𝑎𝑥,𝑐 with varying 𝑓𝑐𝑢 for Edge Panel 323
Figure 7.38: Loading Pattern at ULS [Quarter-Size] for Corner Panel 325 Figure 7.39: Load-Displacement Curve for Validation work for Corner Panel 326 Figure 7.40: Comparison between Crack Patterns in Experiment and FEA
for Corner Panel 327
Figure 7.41: Load-Displacement Curves for various fibre volume ratio 𝑉𝑓
for Corner Panel 328
Figure 7.42: Principal Strain Contours for Corner Panel with 𝑉𝑓 [a]= 1.00%,
[b]= 1.25%, [c]= 1.50%, [d]= 1.75%, [e]= 2.00% and [f]= 2.5% 330 Figure 7.43: Principal Strain Vectors for Corner Panel with 𝑉𝑓 [a]= 1.00%,
[b]= 1.25%, [c]= 1.50%, [d]= 1.75%, [e]= 2.00% and [f]= 2.5% 331 Figure 7.44: Deflected Shapes for Corner Panel with 𝑉𝑓 [a]= 1.00%,
[b]= 1.25%, [c]= 1.50%, [d]= 1.75%, [e]= 2.00% and [f]= 2.5% 332 Figure 7.45: Tensile Damaged Shapes [Top and Soffit] for Corner Panel with
𝑉𝑓 [a]= 1.00%, [b]= 1.25%, [c]= 1.50%, [d]= 1.75%, [e]= 2.00%
and [f]= 2.5% 333
Figure 7.46: Graph of 𝑉𝑓 against 𝑃𝑚𝑎𝑥⁄𝑃𝑚𝑎𝑥,𝑐 for Corner Panel 334 Figure 7.47: Graph of 𝑉𝑓 against 𝑃𝑦⁄𝑃𝑦,𝑐 for Corner Panel 335
Figure 7.48: Load-Displacement Curves for various 𝑉𝑓 with 𝑓𝑐𝑢=30MPa for
Corner Panel 337
Figure 7.49: Load-Displacement Curves for various 𝑉𝑓 with 𝑓𝑐𝑢=40MPa for
Corner Panel 337
Figure 7.50: Load-Displacement Curves for various 𝑉𝑓 with 𝑓𝑐𝑢=50MPa for
Corner Panel 337
Figure 7.51: Graph of 𝑉𝑓 against 𝑃𝑦⁄𝑃𝑦,𝑐 with varying 𝑓𝑐𝑢 for Corner Panel 338
Figure 7.52: Graph of 𝑉𝑓 against 𝑃𝑚𝑎𝑥⁄𝑃𝑚𝑎𝑥,𝑐 with varying 𝑓𝑐𝑢 for Corner
xv
List of Tables
Table 2-1: Main Test methods 36
Table 2-2: Constitutive models in European guidelines and codes
(Blanco et al., 2013) 50
Table 2-3: Distribution of Moments in flat slabs 61
Table 2-4: Differences between Pile-Supported and flat slabs 63
Table 2.5: Summary of Design Methods 82
Table 3.1: Failure Ratios for Concrete Smeared Cracking Model 113 Table 3.2: Plasticity Parameters for Concrete Damaged Plasticity Model 115
Table 4.1: Geometrical details and material properties of the beam 133
Table 4.2: Compression and Tensile Parameters 136
Table 4.3: Stress-Strain Value for Reinforcement 137
Table 4.4: Result from FEA for Bresler-Scordelis (1963) 138 Table 4.5: Geometrical details and material properties of the beam 140
Table 4.6: Compression and Tensile Parameters 142
Table 4.7: Stress-Strain Value for Reinforcement 142
Table 4.8: Results from FEA for Hughes and Speirs (1982) 144 Table 4.9: Tensile Stress-Strain Relationship for Constitutive Models
Barros et al. SFRC Beam 2005 146
Table 4.10: Compression and Tensile Parameters for Barros et al. SFRC
Beam 2005 147
Table 4.11: Tensile Stress-Strain Relationship for Constitutive Models
de Montaignac et al SFRC Beam (2011) 151
Table 4.12: Compression and Tensile Parameters for de Montaignac et al
SFRC Beam 2011 152
Table 4.13: Tensile Stress-Strain Relationship for Constitutive Models
Tlemat et al SFRC Beam (2006) 154
Table 4.14: Compression and Tensile Parameters for Tlemat et al
SFRC Beam 2005 155
Table 4.15: Tensile Stress-Strain for R.S. Olivito and F.A. Zuccarello (2010)
SFRC Beam 157
Table 4.16: Compression and Tensile Parameters for
Olivito and Zuccarello (2010) SFRC Beam 158
Table 4.17: Tensile Stress-Strain Relationship for Hadi’s SFRC Square Panel
(2008) 161
Table 4.18: Compression and Tensile Parameters for Hadi’s SFRC Square
Panel (2008) 162
Table 4.19: Tensile Stress-Strain Relationship for Blanco et al SFRC Square
Panel (2015) 164
Table 4.20: Compression and Tensile Parameters for Tlemat et al SFRC
Beam 2005 165
Table 4.21: Tensile Stress-Strain for Soranakom et al. Round Plate (2007) 170 Table 4.22: Compression and Tensile Parameters for Soranakom et al.
Round Plate (2007) 171
xvi
Table 4.24: Compression and Tensile Parameters for Bernard (2000)
Round Plate 174
Table 4.25: Comparison of Test results with FEA for Destree and Mandl (2008) 177 Table 4.26: Tensile Stress-Strain for Thooft (1999) Pile-Supported Slab 179 Table 4.27: Compression and Tensile Parameters for Thooft (1999)
Pile-Supported Slab 179
Table 4.28: Composition of SFRSCC per m3 of concrete 182 Table 4.29: Comparison of FEM and Experimental Results 184
Table 5.1: Tensile Stress-strain Values for Parametric Study of SFRC
Round Plate 188
Table 5.2: Tensile Stress-strain Parameters for SFRC at 𝑓𝑐𝑢 with Different
fibre volume ratios 190
Table 5.3: Results for SFRC Round Plate 197
Table 5.4: Results for SFRC Round Plate at 𝑓𝑐𝑢 198
Table 5.5: Comparison of Yield Load and Peak Load against Fibre Volume
Ratio 199
Table 5.6: Comparison of Displacement at Yield Load and Peak Load against
Fibre Volume Ratio 201
Table 5.7: Tensile Stress-strain Parameters for SFRC for Case Study 1B 216
Table 5.8: Results for SFRC Round Plate 218
Table 5.9: Tensile Stress-strain Parameters for SFRC for Case Study 1C 230
Table 5.10: Results for SFRC Round Plate 231
Table 5.11: Comparison between Experiment, FEA-Based Predictions and
Design Guidelines 239
Table 6.1: Material Constituents of SFRC Per m3 244
Table 6.2: Tensile Stress-Strain Input 244
Table 6.3: Mesh-Sizes and Time of Execution 246
Table 6.4: Tensile Stress-Strain Parameters for different fibre volume ratios
[𝑉𝑓] 247
Table 6.5: Comparison of Experimental and FEA Validation Results 249
Table 6.6: Strength Parameters for 𝑓𝑐𝑢=45MPa 252
Table 6.7: Strength and Ductility Ratios 259
Table 6.8: Strength and Ductility Ratios for various 𝑉𝑓 [Slab without Rebar] 262
Table 6.9: Strength and Ductility Ratios for various 𝑉𝑓 [Slab without Rebar] 265
Table 6.10: Stress-Strain Value for Reinforcement 267
Table 6.11: Comparison of Experimental and FEA Validation Results
[Slab with Rebar] 268
Table 6.12: Strength Parameters for 𝑓𝑐𝑢=45MPa [Slab with Rebar] 270 Table 6.13: Strength and Ductility Ratios of Slab with Rebar 276 Table 6.14: Strength and Ductility Ratios for various 𝑉𝑓 [Slab with Rebar] 278 Table 6.15: Strength and Ductility Ratios for various 𝑉𝑓 282
Table 6.16: Comparison with Existing Guidelines 284
Table 7.1: Material Constituents of SFRC Per m3 287
xvii
Table 7.3: Mesh-Sizes and Time of Execution 290
Table 7.4: Tensile Stress-Strain Parameters for different fibre volume
ratios [𝑉𝑓] 291
Table 7.5: Comparison of Experimental and FEA Validation Results for
Middle Panel 293
Table 7.6: Strength Parameters of Middle Panel for fcu=43.7MPa for
Middle Panel 294
Table 7.7: Strength and Ductility Ratios for Middle Panel 301 Table 7.8: Strength Ratios for various 𝑉𝑓 for Middle Panel 303 Table 7.9: Strength Ratios for various 𝑉𝑓 for Middle Panel for 180mm depth 308 Table 7.10: Strength Ratios for various 𝑉𝑓 for Middle Panel for 220mm depth 308
Table 7.11: Validation Results for Edge Panel 311
Table 7.12: Strength Parameters for Edge Panel 312
Table 7.13: Strength Ratios for Edge Panel 318
Table 7.14: Strength Ratios for various 𝑉𝑓 for Edge Panel 320 Table 7.15: Strength and Ductility Ratios for various 𝑉𝑓 for Edge Panel 324 Table 7.16: Comparison of Experimental and FEA Validation Results for Corner
Panel 326
Table 7.17: Strength Ratios for Corner Panel 328
Table 7.18: Strength Ratios for Corner Panel 334
Table 7.19: Strength Ratios for various 𝑉𝑓 for Corner Panel 336 Table 7.20: Strength Ratios for various 𝑉𝑓 for Corner Panel 339 Table 7.21: Comparison with Existing Guidelines for Maximum Loading
xviii
Acknowledgement
My utmost gratitude goes to the Almighty GOD for in HIS infinite wisdom and knowledge was I able to complete this PhD research work. To HIM be all the glory, honour and adoration.
This thesis is a product of the research undertaken at the University of East London, School of Architecture, Computing and Engineering [ACE] under the supervisory guidance of Dr Ali Abbas and Dr Ravi Jayaratne, to whom I am grateful. I also want to thank all the faculty in ACE, Prof Hassan S. Abdalla, Prof. Brimincombe, Dr John Walsh, Dr Jawed, and Dr Anca.
I will like to appreciate the Federal Government of Nigeria through the Tertiary Education Trust Fund [TETFund] for providing over 75% of the funds for the program.
Special thanks go to the Management of the Federal Polytechnic, Ilaro from Dr R.A. Oloyo [who approved the program], to Arc. Segun Aluko PhD [who released me for the program] and everyone who has contributed in one way or the other [Engr H.A. Sanni, Engr (Prof) Olagoke, Tpl F. Babalola, Engr F.A. Akinboboye, Engr B.S. & Engr (Mrs) M.O. Balogun, Engr (Mrs) I.K. Ogunfayo, Engr O.A. Aikulola, Mr O.O & Elder (Mrs) Oduwobi, Engr O.O & Dcns O.A. Osore, Chief [Mrs] Yemisi Oloyo, Tpl & Mrs Sunday Oyesile, Dr & Mrs Wale Ajayi,
To all my colleagues at the Federal Polytechnic Ilaro, Mr O.P. Okafor, Engr. DWS Alausa, Engr & Mrs Wale Ogunyinka, Mr Oyedeji, Engr (Dr) Olarewaju, Dr Akinbola, Lolade ‘Guv’
Adegbesan, Tayo Ojuawo, Sulaimon Oderinde, Funke Aiyegbusi, Engr Adeala, Kehinde Aladelusi, Ojo Adaramola, Mr Fabi, Mr Aro, Mr Adeyinka, Pst Oyenuga, Femi Feyisitan
To all Pastors in Winners’ Chapel International Dartford and Ilaro [David & Kemi
Oyedepo Jnr, Mike & Victoria Sekudo, Abiodun & Aarinola Idowu-Titus, Kayode & Toyin Oremakinde, Abiodun Ope, Kolade & Yemisi Abel, Rotimi Ajibola, John Awojobi, Obinna Nwokire, Matthew Adeyeye, Yuki Igbinosa, Nicholas Udoh, Pius Awulor, Richard Nana-Akyin, Nathaniel Odin, David Shiyanbade, Gbenga Babatunde, Peter Macaulay, Sylver Omeaka, Jacob Adedeji, Tolu Oralusi], I say a big thank you for your spiritual and moral supports.
All PhD students at UEL and most especially Ifueko Imason, Ahmed Albarran [Iraq], Oluwaseun Alele, Comfort Olutola, Umar Mukhtar, Raghu [India], Alice Mukaka, Rabiu Mukhtar, Ify Dan-Ogosi, Kathy-Ann [Barbados], Solomon, Ezekiel Jidong, Roxanne Gooden [Jamaica], Halima Kure, Mustapha, Aslam, Sanny [Zambia], Tarela Ike, Linah [Jordan], Abba, and those who have graduated Mohammed Garba, Bibi, Richard Otuka, Austin Nwajana, Amodu Dinken, Umaima Haider [Pakistan], Ronke Akerele, Ifiok Etim, Christiana Emmanuel-Stephen, to you all I say thank you
xix
My entire family, Rev. & Evang. Bisi Olutade, Jumoke, Mrs Funmi Otitoju Soyemi-Tella,
Lekan & Betty ‘Sama’ Osinnaike, Bisoye, Pst & Mrs Segun Soyemi, Tunde, Mr & Mrs Femi Ibrahim, Engr Bola Falusi, Dr Niyi & Sade Isinkaiye, Bayo & Foluso Adedeji, Jide & Yinka Olulana, Kayode & Lola Agoke, Seyi & Funmi Balogun, Hajia Idayat Hammed, Gbenga & Funmi Soyemi, Idris & Jumoke Bello, Sola & Jumoke Aguda, Fatai Osinnaike, all Gaskiya Global Forum,
To my children, Oluwaseyifunmi, Oluwademilade and IreOluwa and their cousin, Justina Olutade, thank you for holding forth for this last 3years plus.
xx
Dedication
xxi
Table of Content
Contents
ABSTRACT ... I
LIST OF SYMBOLS ... II
ABBREVIATIONS ... IV
LIST OF FIGURES ... V
LIST OF TABLES ... XV
ACKNOWLEDGEMENT ... XVIII
DEDICATION ... XX
TABLE OF CONTENT ... XXI
CHAPTER 1: INTRODUCTION ... 1 1.1 Background ... 2
1.2 Statement of Problem ... 7
1.3 Aim and Objectives ... 9
1.4 Scope of Research ... 9
1.5 Application of SFRC ... 10
1.6 Novelty of Research... 11
1.7 Research Methodology ... 12
xxii
2.1.6 Shape and size ... 20 2.2 Steel Fibres ... 20
2.2.1 Shape of the Fibre ... 20 2.2.2 Classification of Steel-Fibre ... 21 2.2.3 Characterisation of steel-fibre ... 22 2.2.4 Basic Definition of Physical Properties ... 22 2.3 Properties of Steel Fibre Reinforced Concrete ... 22
2.3.1 Compressive Strength of SFRC ... 22 2.3.2 Tensile Strength of SFRC ... 24 2.4 Crack propagation and formulation ... 26
2.5 Test Methods ... 28 2.5.1 Uni-axial tension test ... 28 2.5.2 3-Point bending test ... 30 2.5.3 4-Point bending test ... 33 2.5.4 Slab (Plate) test ... 34 2.5.5 Review of Testing Methods of SFRC ... 36 2.6 Material Constitutive Models ... 38
2.6.1 Lok & Pei (1998) ... 38 2.6.2 Barros and Figueiras (1999) ... 41 2.6.3 Rossi (1999) ... 44 2.6.4 RILEM TC 162-TDF (2002) ... 44 2.6.5 Lok and Xiao (1999) ... 46 2.6.6 Review of Constitutive Models ... 48 2.6.7 Highlights on some constitutive models in EU guidelines and codes (Álvarez, 2013) 49
2.7 Slabs Overview ... 51 2.7.1 Supports for slabs ... 51 2.7.2 Methods of analysing and designing Elevated and Pile-supported slabs ... 51 2.7.3 Flat Slabs ... 59 2.7.4 Difference between pile-supported and flat slabs ... 61 2.8 Punching shear ... 63
2.8.1 Mechanism of Failure ... 64 2.8.2 Contribution of Steel Fibre ... 65 2.9 Design Guidelines for SFRC Slabs ... 65
xxiii
2.9.5 The Concrete Society (2007) – TR 63 ... 71 2.9.6 The Dutch Code [NEN 6720] (1995) ... 73 2.9.7 Eurocode 2 BS EN 1992 (2004) ... 74 2.9.8 The Swedish Proposal (2008) ... 75 2.9.9 𝒇𝒊𝒃 Model Code 2010 (MC2010) ... 76 2.9.10 The Concrete Society (2014) – TR 34 ... 78 2.9.11 Deficiencies in Existing Design Methods for Elevated or Pile-supported Slabs
79
2.9.12 Summary of Design Methods ... 82 2.10 Summary ... 84
CHAPTER 3: FINITE ELEMENT METHOD ... 87 3.1 Introduction ... 88
3.2 Finite Element Analysis ... 88
3.3 Non-Linear Finite Element Analysis ... 90
3.4 Finite Element Analysis using ADINA and ABAQUS ... 90
3.5 ADINA ... 91 3.5.1 Elements in ADINA ... 91 3.5.2 Meshing ... 93 3.5.3 Material Model for Steel ... 94 3.5.4 Material Models for Concrete ... 94 3.6 ABAQUS ... 107
3.6.1 Elements in ABAQUS ... 107 3.6.2 Concrete Material Models ... 111 3.6.3 Brittle cracking model ... 120 3.7 Material Model for Rebar ... 121
3.8 Philosophies of Constitutive Models ... 122 3.8.1 Stress-Strain Constitutive model ... 122 3.8.2 Stress-crack width [σ-w] constitutive model ... 123 3.8.3 Review of Philosophies of Constitutive Models ... 124 3.9 Scope of Parametric/Case Studies ... 125
xxiv
3.6 Summary ... 129
CHAPTER 4: VALIDATION OF NUMERICAL MODELS USING AVAILABLE EXPERIMENTAL RESULTS ... 130 4.1 Introduction ... 131 4.2 Reinforced Concrete Beams Cases [No Fibres] ... 132 4.2.1 Bresler and Scordelis (1963) Beam – Brittle Failure ... 132 4.2.2 Hughes and Speirs (1982) Beam ... 140 4.3 Steel-Fibre Reinforced Concrete Experimental Works ... 144
4.3.1 3-Point Bending Beam Tests ... 145 4.3.2 4-Point Bending Tests ... 153 4.3.3 SFRC Slabs [Plates] ... 160 4.4 Full-Scale Testing ... 176
4.4.1 Destree X and Mandl J. (2008) Square Slab ... 176 4.4.3 Thooft (1999) Pile supported slabs ... 177 4.4.4 Barros J.A.O., Salehian H., Pires N.M.M.A and Goncalves D.M.F (2012) ... 181 4.5 Summary of Validation works ... 183 4.6 Summary ... 185
CHAPTER 5: CASE STUDY 1: SIMPLY SUPPORTED SINGLE SLABS UNDER POINT LOAD .... 186 5.1 Introduction ... 187 5.2 Case Study 1A: R. de Montaignac, B. Massicotte, JP Charron & A. Nour Round Plate (2011) 187
5.2.1 The Load-Displacement Curves ... 192 5.2.2 Strength ... 197 5.2.3 Ductility ... 206 5.2.4 Cracking Pattern... 206 5.2.4.4 Deflected Shapes ... 212 5.2.5 Comparative Study with Experimental Results Using Non-Dimensional Ratios
213
5.3 Case Study 1B: Soranakom, C., Mobasher, B. and Destrée, X. (2007) Round Plate 215
xxv
5.3.5 Comparative Study with Experimental Results Using Non-Dimensional Ratios 226
5.4 Case Study 1C: Blanco, A., Cavalaro, S., De La Fuente, A., Grünewald, S., Blom, CBM & Walraven, JC Square Plate (2014) ... 228
5.4.1 Load-Displacement Curves ... 230 5.4.2 Strength ... 231 5.4.3 Ductility ... 232 5.5.4 Crack Patterns ... 232 5.5.5 Using Non-Dimensional Ratios for Comparative Study with Control Specimen 237 5.5.6 Comparison between FE-Based Predictions and Design Guidelines ... 239 5.6 Summary ... 240
CHAPTER 6: CASE STUDY 2 - 4-PANEL PILE-SUPPORTED SLABS WITH AND WITHOUT REBAR OVER SUPPORTS ... 242 6.1 Introduction ... 243 6.2 Sensitivity Analysis ... 244 6.3 Parametric Study ... 246 6.4 Slab without Rebar ... 247 6.4.1 Load-Displacement Curves [Slab without Rebar] ... 248 6.4.2 The Strength [Slab without Rebar] ... 251 6.4.3 Ductility ... 253 6.4.4 Crack Shapes [Slab without Rebar] ... 253 6.4.5 Comparative Study with Experimental Specimen using Non-Dimensional Ratios [Slab without Rebar] ... 258 6.4.6 Additional Analysis with Different 𝒇𝒄𝒖 [Slab without Rebar] ... 261 6.4.7 Proposed Equation for Peak and Maximum Load [Slab without Rebar] ... 266 6.5 Case Study 2[b]: 4-Panel Slab with Rebar ... 266
xxvi
6.8 Summary ... 284
CHAPTER 7: CASE STUDY 3 - 9-PANEL ELEVATED SLAB UNDER POINT LOAD ... 286 7.1 Introduction ... 287 7.2 Sensitivity Analysis ... 288 7.3 Parametric Study ... 290 7.4 Loadings under Ultimate Limit State [ULS] ... 291 7.5 Part I: Middle Panel ... 292 7.5.1 Load-Displacement Curves ... 292 7.5.2 The Strength ... 294 7.5.3 Ductility ... 295 7.5.4 Crack Shapes ... 295 7.5.5 Comparative Study with Experimental Specimen using Non-Dimensional Ratios
301
7.5.6 Further Analysis with Different 𝒇𝒄𝒖 ... 302 7.5.6 Proposed Equation for Maximum Load Carrying Capacity ... 309 7.6 Part II: Edge Panel ... 310
7.6.1 Load-Displacement Curves ... 310 7.6.2 The Strength ... 312 7.6.3 Comparative Study with Experimental Specimen using Non-Dimensional Ratios
318
7.6.4 Further Analysis with Different 𝑓𝑐𝑢 for Edge Panel ... 319 7.6.5 Proposed Equation for Maximum Load Carrying Capacity for Edge Panel ... 324 7.7 Part III: Corner Panel ... 325
7.7.1 Load-Displacement Curves ... 325 7.7.2 The Strength ... 327 7.7.3 Comparative Study with Experimental Specimen using Non-Dimensional Ratios
334
7.7.4 Further Analysis with Different 𝑓𝑐𝑢 for Corner Panel ... 335 7.7.5 Proposed Equation for Yield Load and Maximum Load Carrying Capacity for Corner Panel ... 340 7.8 Comparison with Existing Guidelines and Codes using Middle Panel ... 340 7.9 Conclusions ... 342
xxvii
8.2 Summary of Conclusions ... 346 8.3 Recommendations and Future Work ... 349
REFERENCES ... 350
1
2
1.1 Background
Concrete in its natural state consists of limestone (cement), fine and coarse aggregate, and water. It has emerged the most used human-made construction material of all time (Beddar, 2004). Every year, the Association of Concrete Industrial Flooring Contractors [ACIFC] pours around 10 million m2 of concrete for industrial flooring in the United Kingdom (Concrete Centre, 2006). In 2011 the estimated construction of industrial floors was at the level of 2.5 million m2, an increase of 25 % compared with 2004 that seemed to be a low notation (Hedebratt, 2012a). Also, the damages reported have been on the increase in the last 30 years (Johansson, 2003).
There has been a significant improvement both in the art and usage of concrete over the years compared to when it was first used for masonry work by the Romans in which pozzolanic mortar was used as a binder. Generally, concrete is strong in compression (British Standard Institute, 1997, Lok and Xiao, 1999, Barros and Cruz, 2001, America Concrete Institute, 2002, British Standard Institute, 2004, Crowther, 2009, Abbas et al., 2014b) and possesses about one-eighth of this strength in tension. At the application of loads, the concrete member bends and cracks at the tension face as shown in Figure 1.1.
Tensile forces pull apart the bottom of this concrete slab when it bends
Figure 1.1: Plain concrete in bending [Adapted from https://www.quora.com/Why-do-we-put-steel-in-concrete-for-construction on November 12, 2016]
3
Figure 1.2: (a) Crack Pattern in Concrete with No Reinforcement when Load is Applied (b) Crack Pattern in Concrete with Steel Reinforcement when Load is applied [Adapted from www.google.com on November 12, 2016]
The overall performance of any structure, particularly the industrial and warehouses has been attributed to the concrete floor slabs (CFS) where a lot of activities take place and as businesses grow and expand its operations, the need for large industrial warehouses
4
[a] [b]
Figure 1.3: Typical Slab Reinforcement laid on [a] Pile Foundation adapted from http://nationwidediamondgroup.co.uk 25/05/2017] and [b] columns for elevated slab adapted from http://xoomtube.com/video/RKk8TEEKLBI on 25/05/2017]
Also, offices, residential buildings and other structures in which flat slab floors are constructed on the ground or supported on piles are subjected to the failure and cracking behaviour which often has been a worrying concern for clients, contractors and designers. The quality and durability of industrial floors have been a vital consideration in the construction of industrial premises, including warehouses, factories, large workshops, shopping centres and buildings for other range of applications.
5
Pile-supported steel-fibre reinforced concrete [henceforth SFRC] slabs are usually
constructed in square pile grids of about 3 x 3m, 5 x 5m, 6 x 6m and most recently 8 x
8m (Destree, 2004, Destrée, 2007a, Vollum, 2007, Destrée and Jürgen, 2008, The
Concrete Society TR34, 2014). Their thicknesses are typically 200 - 300 mm but can be
as high as 500 mm for heavily-loaded slabs and as low as 180 for residential buildings.
The thickness of the slab is picked based on a minimum span-depth ratio of 15 (The
Concrete Society TR63, 2007, Destrée and Jürgen, 2008). Slip membrane is commonly
provided at the interface between the top of the pile and bottom of the slab [the piles
are not constructed monolithically with the slab] to minimise the risk of cracking caused
by restrained early-age thermal contraction and drying shrinkage. A Typical
[image:33.595.116.499.357.565.2]Pile-Supported Slab Layout is shown in Figure 1.4.
Figure 1.4: A Typical Pile-Supported Slab Layout
In plain concrete subjected to loading, cracks are propagated on the tension surface.
This damage first starts as a single crack when the tensile strength of the material has
been exceeded and are thus mitigated by the introduction of fibres in the concrete
matrix (CHANH, 1990, Campione, 2002, Beddar, 2004, Labib and Eden, 2004, British
Standard Institute, 2006, Jansson, 2011, Rai and Joshi, 2014, Ghaffar et al., 2014)
With the improvement in the knowledge and understanding of steel-fibre usage in
steel-6
[image:34.595.112.565.224.536.2]fibre-reinforced concrete pile-supported slabs (Barros and Figueiras, 1999, Destrée, 2001, Cameron, 2003, Destrée, 2006, Vollum, 2007, Destrée, 2007a, Hedebratt and Silfwerbrand, 2008, Mobasher and Destrée, 2010a, ArcelorMittal, 2011, Destrée et al., 2011, Barros, 2011, Destrée and Silfwerbrand, 2012, Barros et al., 2012, Oikonomou-Mpegetis, 2013, Blanco et al., 2014a, Singh, 2015). Figure 1.5 shows the Pile-Supported Floor Slab for Warehouse Partly finished with soil acting as falsework
Figure 1.5: Pile-Supported Floor Slab for Warehouse Partly finished with soil acting as falsework [Adapted from Twintec Thailand- http://www.twintec.co.th/sfrc-jointless-internal-floor-slabs.html, downloaded on May 25, 2016]
7
Institute, 2006, NZS, 2006, NRC, 2007, The Concrete Society TR63, 2007, Silfwerbrand, 2008, The Concrete Society TR34, 2014).
1.2 Statement of Problem
A plain unreinforced concrete matrix fails in a brittle manner at the appearance of cracking stresses due to its brittleness and lack of post-cracking resistance. Fibres have been found to enhance the ductility of concrete, by carrying stresses beyond matrix
cracking and thus improve the structure’s integrity and ability to accommodate
deformations. Taking advantage of the statically indeterminate characteristic of slabs supported on piles or columns, and the benefits from the high post-cracking residual strength of concrete reinforced with the relatively high content of steel fibres (1.00% to 2.50% in volume) the use of SFRC has recently been explored for the construction of different types of structural system. This type of slab is generally designated by pile-supported or Elevated SFRC (Destree, 2004)
Given the information examined above with respect to properties of steel-fibres and their capability to enhance the structural response of the RC structures, it is urgent and gainful to research further and understand the behaviour of SFRC structures, particularly in suspended slabs. Earlier studies carried out by (Thooft, 1999, Destrée, 2001, Cameron, 2003, Beckett, 2004, Barros et al., 2005) are restricted to certain types of structural arrangement and only consider a low range of volume fibres fraction due to time and economic limitations. These studies are mainly experimental, which does not have the advantage of implementing full parametric examinations such as the one carried out in this present research work.
8
understanding the behaviour of SFRC considering a wide range of fibre dosages using FEA. This will result in conclusions and recommendations to help in simplifying the design of SFRC suspended slabs.
Likewise, there are no guidelines that are accepted or adopted worldwide. Every nation in which the construction and research of SFRC have taken place provided some form of guidelines for design. Also, proprietary guidelines vary between manufacturers, and
some are based on ‘design assisted by testing’ method (Japanese Concrete Institute, 1984, British Standard Institute, 1994, IstructE, 1999, America Concrete Institute, 2002, British Standard Institute, 2006, NZS, 2006, NRC, 2007, The Concrete Society TR63, 2007, Institute, 2007, ArcelorMittal, 2011, The Concrete Society TR34, 2014). This research work looked into these various guidelines and evaluated their responses in the design of slab supported by piles and columns and compared same with results from FEA.
The present research work purposes to produce a simplified approach for the design of SFRC suspended slab using FEA. Parametric and case studies were undertaken to propose the simplified design guidelines where possible. The focus of the present study is on SFRC suspended slabs (i.e. single panel, 4-panel and 9-panel slabs), taking into consideration the overall structural responses as well as the local response at the critical sections examined. Conclusions are then made on whether or not FEA can demonstrate the capability of SFRC to achieve sufficient strength, stiffness and ductility.
The research work investigates the following key structural issues:
• Strength: shear force, load-carrying capacity, and bending moment capacities at critical sections on the slab
• Stiffness: maximum displacement and slope
• Ductility: the ratio of maximum displacement/displacement at yield.
9
1.3 Aim and Objectives
Aim
To this effect, this research work is aimed at investigating the structural behaviours of steel-fibre reinforced concrete [SFRC] pile-supported and elevated slabs using the commercially available structural engineering software ADINA and ABAQUS [linear and non-linear finite element analysis (FEA)].
The objectives of the research work are to:
1. Critically examine current design guidelines by studying the corresponding elastic and yield-line analyses.
2. Collate available numerical models and evaluate them
3. Calibrate and validate the constitutive models into the FE models using ADINA and ABAQUS to Produce complete load-deflection histories from the start of loading to collapse.
o Provide predictions of load-carrying capacities at the ultimate limit-state.
o Determine the structural loads at first crack and the location of these initial cracks.
4. Carry out parametric studies on experimental works chosen as case studies
5. Compare the results of the numerical investigations and existing experimental data with current design guidance in order to assess the safety, serviceability and economy of the latter.
o Use the ensuing data to establish a transparent, unified, and improved design method in the form of simplified closed-form formulae and/or design charts for eventual use by practising engineers
1.4 Scope of Research
10
• Available experimental works with hooked-end and cramped steel-fibres were used for case studies.
• Three cases were studied, and these covers single [round and square] panels, 4-panel slabs, and 9-4-panel slabs. The single 4-panels were used to study the behaviour of the slabs at the material level while the 4-panel and 9-panel slabs were used for the structural responses.
• parametric studies carried out on the vital parameter, particularly the volume fibre fraction 𝑉𝑓 and characteristic strength of SFRC 𝑓𝑐𝑢 to extend it beyond the
scope of the experiment.
• The 𝑉𝑓 and 𝑓𝑐𝑢 are the main parameters that were considered in all the parametric studies and in addition, the span-depth 𝑙⁄𝑑 ratio for the cases considered at the structural level. The 𝑉𝑓 adopted were guided by the values used in the experiments considered for case studies and are 0.5%, 1.00%, 1.25%, 1.50%, 2.00% and 2.50% and 𝑓𝑐𝑢 were 30MPa, 40MPa and 50MPa.
• Also, for the Finite Element Analysis, two commercially available software, ADINA and ABAQUS, were used in the analysis. They were chosen based on their acceptability in the industry and their availability at the University of East London.
1.5 Application of SFRC
The ability to arrest crack openings effectively by the reinforcement mechanisms of steel fibres bridging the crack surfaces of Cementous materials leads to substantial increase in load carrying capacity and energy dissipation capability of the concrete structures (Barros, 2011). SFRC has been found to effectively arrest cracks and also used where irregular or complex shapes are desired. The following areas have witnessed the tremendous use of SFRC and some are shown in Figure 1.6:
▪ Airport Runways
11
▪ Residential and Commercial Floor slabs ▪ Box culvert
Figure 1.6: Applications of FRC
(a) Heydar Aliyev Center by Zaha Hadid, Baku, Azerbaijan. Glass-fibre reinforced concrete [adopted from www.pinterest.com on 10/05/2016]
(b) Tunnel lining [adopted from www.tunneltalk.com on 10/05/2016] (c) Triangle Office Building Tallinn/Estonia (Destrée, 2006)
(d) Fortress Stabilization Systems [adopted from www.fortressstabilization.com on 10/05/2016]
1.6 Novelty of Research
12
1.7 Research Methodology
The method deployed for this research work is divided into four parts:
First, a critical review of the available literature (on reinforced concrete, fibre reinforced concrete, type of fibres, testing procedures, numerical and constitutive models, real-life applications etc.) was carried out all through the research period
Secondly, identification of existing models and design guides; gathering of available experimental data on SFRC slab with reference to samples with and without rebar, and a combination of rebar and fibres. The constitutive models were inputted into FEA software and used to determine their accuracy in predicting the responses of the experimental works correctly.
Furthermore, comparisons are made between the existing elastic design and proposed serviceability design rules at Serviceability Limit State (SLS). A complete load-deflection history at the Ultimate Limit State (ULS). An extensive parametric study using varying parameters [L/d, 𝑉𝑓 and 𝑓𝑐𝑘] were carried out.
13
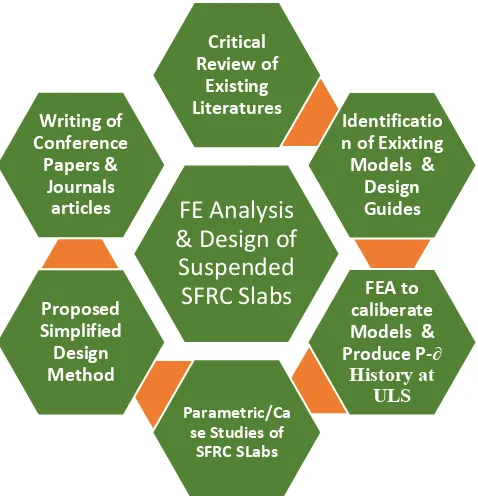
Figure 1.7: Research Outlay
FE Analysis & Design of Suspended SFRC Slabs
Critical Review of
Existing Literatures
Identificatio n of Exixting
Models & Design Guides
FEA to caliberate Models & Produce P-∂
History at ULS
Parametric/Ca se Studies of SFRC SLabs Proposed
Simplified Design Method Writing of Conference
14
15
2.1 Introduction
In 1874, an American, A. Berard patented an idea in which grains of steel left-overs (waste) are mixed to the concrete to create a material that is more ductile (Berard, 1874a). In the present world, there are many types of fibres being used in the construction industry for structural and non-structural works. Examples are steel, carbon, polyethene, natural fibres and so on, but the most researched on is the steel fibre. The steel fibres come in various shapes, sizes and strength (Zollo, 1997, Destrée, 2007a). As found in earlier researches, the advantages of inclusion of steel-fibres in concrete in structural members are numerous. These include [i] enhancing the post-cracking behaviour of the concrete regarding more ductility which leads to an increase in flexural strain capacity, [ii] the significant reduction in construction time [since they are conveniently cast in large pours compared to time to lay the traditional reinforcement]; [iii] improve tensile strength and energy absorption and, [iv] reduction in crack-width giving rise to enhanced damage tolerance (RILEM, 2002a, Lok and Pei, 1998, Oslejs, 2008). However, in some other early works on SFRC provisions were made for additional reinforcement to resist peak moments over piles or supports, notably in the corner panel, and to control cracks due to early-age thermal stresses and then it was concluded that it is impossible to have steel-fibres only reinforced concrete (CHANH, 1990, IstructE, 1999). Howe

![Figure 1.5: Pile-Supported Floor Slab for Warehouse Partly finished with soil acting as falsework [Adapted from Twintec Thailand- http://www.twintec.co.th/sfrc-jointless-internal-floor-slabs.html, downloaded on May 25, 2016]](https://thumb-us.123doks.com/thumbv2/123dok_us/402297.1040302/34.595.112.565.224.536/supported-warehouse-falsework-adapted-thailand-jointless-internal-downloaded.webp)
![Figure 2.3: [a] DramixTM RC-65/35-BN (hooked end) and [b] TABIX-Twincone (ArcelorMittal, 2011, Bekaert, 2012) (crimped)](https://thumb-us.123doks.com/thumbv2/123dok_us/402297.1040302/49.595.117.535.73.339/figure-dramixtm-hooked-tabix-twincone-arcelormittal-bekaert-crimped.webp)


![Figure 2.8: Schematic description of stress-crack opening for [a] plain concrete and [b] SFRC](https://thumb-us.123doks.com/thumbv2/123dok_us/402297.1040302/55.595.133.511.353.562/figure-schematic-description-stress-crack-opening-plain-concrete.webp)

![Figure 2.13: [a-c]: Load – deflection graphs [d] Load-CMOD graph](https://thumb-us.123doks.com/thumbv2/123dok_us/402297.1040302/59.595.114.538.365.670/figure-load-deflection-graphs-load-cmod-graph.webp)
