2017 3rd International Conference on Artificial Intelligence and Industrial Engineering (AIIE 2017) ISBN: 978-1-60595-520-9
Characteristics Analysis of Land Use Spatial Distribution on Terrain
Gradient in Henan Province
Kai-guang ZHANG
*, Ming-ting BA, Hong-ling MENG and Yan-min SUN
Zhengzhou Normal University, Zhengzhou 450044, China *Corresponding author
Keywords: Land use spatial distribution, Terrain gradient, Land use gradient distribution index, Geostatistical analysis, Henna province.
Abstract. Terrain is the most basic natural geographical elements, restricting the redistribution of surface material and energy, affecting the soil and vegetation formation and development process. Land use structure is the inevitable result of the interaction between nature and mankind. Based on the digital elevation model and land use classification grid data, the paper utilizes geostatistical analysis method to quantitatively analyze the spatial distribution characteristics of terrain gradient, and the spatial relations between land use structure and terrain gradient in Henan province. The results show that: In Henan province, the terrain gradient is dominated by low value, with the increase of terrain gradient, the area of unit gradient decreases gradually; With the increase of the longitude, the terrain gradient decreases gradually, showing the spatial pattern of the west high east low, the variety on the same latitude belt is significantly larger than that on the corresponding longitude belt. Farmland, water area, construction land and unused land are mainly distributed in the low gradient regions, and the grassland distributes in the middle gradient regions, and the gradient of forest land distribution is relatively high. The total area of construction land is increasing over time, occupying lots of farmland and forest land, the growth rate in middle low gradient region is higher than that in the low gradient region, and there is a trend of expanding to higher gradient region at the same time. The total area of farmland is decreasing over time, it tries to expand to higher gradient region to make up for the lost area, the area of middle gradient in its advantage region decreases mostly. In order to make up for the occupied area, the forest grassland is expanding toward higher gradient region. The area of water land has been increasing continuously, but the area of agricultural water in low gradient region is decreasing, and the advantage position is reducing.
Introduction
Terrain is the most basic natural geographical elements, restricting the redistribution of surface material and energy, affecting the soil and vegetation formation and development process, determining the land use type and land use quality[1]. With the development of social productive forces, the interaction between mankind and nature has been gradually strengthening. Economic development and social division of labor have been promoting the adjustment of regional economic structure, which has been affecting the change of land use structure [2, 3].
The terrain gradient is one of the important indexes to describe the regional geography characteristics by using elevation and geographic slope. Elevation and slope affect local temperature, light illumination conditions and soil water conservation capacity, and determine the way and direction of regional land use [4, 5]. The relation research between land use structure and terrain gradient could effectively reveal the elevation and slope characteristics of land use, the spatial expansion process and evolution mechanism, in order to provide some scientific references for natural evaluation of living environment, soil and water conservation, and the adjustment of economic structure [6-8].
of regional landform type, natural evaluation of living environment, land erosion evaluation, quantitative soil and water loss evaluation, geological environment evaluation and so on [9].
Based on the 30m×30m DEM and 1km×1km land use classification grid data, this paper quantitatively analyzes the spatial relationship between land use types distribution and terrain gradient, the change and expansion characteristics of land use along the terrain gradient by using geostatistical analysis method in Henan province.
Data and Research Methods
Research Area Overview
Henan Province (31°23'N-36°22'N, 110°21'E-116°39'E) is located in the middle and eastern part of China, with the total area of 167 thousand km2. The landform is complex and the terrain is west high
east low. The three sides as the north, west and south are semi-circular surrounded by Taihang, Funiu, Tongbai and Dabie mountains. The central and east regions are Huanghuaihai alluvial plain.
Data
The data used in the study include 30m×30m DEM provided by Computer Network Information Center(http://www.gscloud.cn), and the land use classification grid data(1980, 2000 and 2015) provided by Data Center for Resources and Environmental Sciences, Chinese Academy of Sciences (RESDC) (http://www.resdc.cn).
Terrain Gradient
Land use structure and its changes show regularity in elevation and slope. To analyze the terrain impact on land use structure and change, terrain gradient Tij is defined as [8, 10]:
lg[(1 )(1 )]
ij ij ij
T E E S S (1)
where Eijand Eis the elevation of ( , )i j and the mean of elevations in the study area respectively,
ij
S andSis the slope of ( , )i j and the mean of slopes in the study area respectively.
When the study area is determined, E and S are fixed values. Tijis a increasing function of
ij
E orSij, this is, the terrain gradient Tij increase with the values of EijorSij increasing. In the same
elevation belt, the terrain gradient in the large slope region is large, in the same slope region, the terrain gradient in the high elevation region is large.
Land Use Gradient Distribution Index
Land use gradient distribution index refers to the relationship between the distribution density of the land use in the gradient and the distribution density in the region, is defined as[7,8,10]
( ) ( )]
it it t i it t i
P S S S S S S S S (2)
where Sitis the area of land use i in the gradient t, St is the total area of gradient t in the study
region, Sit Stdescribes the density of i in the region with gradient t; Siis the total area of land use i,
Sis the total area of the study, S Si describes the density of i in the study region. 1
it
P means the distribution density of the land use i in the gradient t is larger than that in the
study area, the region of t is the advantage distribution region, t is called the advantage distribution
gradient of i, the set of t is called the advantage distribution interval of land use i. LargePit means
the high advantage, but for the region of t, i is not necessarily the absolute advantage in the
Distribution Characteristics of Terrain Gradient in Henan Province
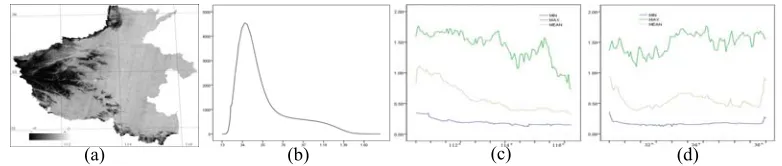
Based on Henan 30m×30m DEM, Using Eq.1 to calculate the terrain gradient, the result is showed in Figure 1(a).
Spatial Distribution Characteristics of Terrain Gradient in Henan Province
The terrain gradient of Henan province is between 0.05-4.77, proportional to elevation. the probability density of the terrain gradient(Figure 1(b)) shows the gradients are dominated by low values, the area of T0.50 is more than 75.02% of the province’s total area, the area of 0.50 T 1.00
is 30.06%, the area of 1.00 T 1.50 is 9.87%, and the area of T1.50 is less than 0.06% about
107.05 km2.
With the terrain gradient increases, the area of the terrain gradient gradually increases, reaching a maximum of 4539 km2 in the interval (0.36, 0.37], and then gradually decreases, the reduction rates in
[image:3.612.110.501.259.342.2]different intervals are significantly different, (0.36, 0.70] is the fastest, then (1.14,1.44], (0.70,1.44] and (1.44,1.76].
Figure 1. The distribution characteristics of terrain gradient in Henan province.
Longitude Distribution Characteristics of the Terrain Gradient in Henan Province
The terrain gradient distribution curve versus longitude (Figure 1(c)) shows, the mean of terrain gradient increase with the Longitude increases, reaching a maximum as 1.76 at 110°29'50"E, then gradually decreases, which is basically in accordance with the geomorphic features of the western mountainous and eastern plains. On the same longitude belt, the minimum value decreases gradually with the longitude increase. At the west of 115°31'E, the maximum is between 1.06-1.76 up and down, and then gradually decreases with the longitude increases, from 1.57 of 115°31'E to 0.73 of 116°39'E.
Latitude Distribution Characteristics the Terrain Gradient in Henan Province
The terrain gradient distribution curve versus latitude (Figure 1(d)) shows, with the latitude increases, the mean of the terrain gradient from the maximum 0.92 gradually decreases, reaching a local minimum value as 0.38 at 32°20'N, then gradually increases, at 33°47'N reaching a local maximum value, and then gradually decreases, at 36°10'N getting a local minimum value, and then quickly increases to 0.87. Except for the north (about 427 km2) and south (about 218 km2) poles, the
minimum value is changing between 0.10-0.20. The maximum value is always keeping above 1.10, the maximum-maximum appears at 34°26'21"N.
Overall, the province's terrain gradient shows the characteristics of west high east low, the variety in the same latitude belt is significantly larger than that in the corresponding longitude belt.
Relationship between Land Use Distribution and Terrain Gradient in Henan Province
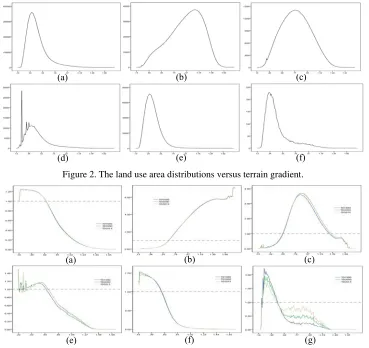
Overlying the land use grid with the terrain gradient, using Eq.2 to calculate the spatial distribution characteristics in terrain gradient (Figure 2), and the land use gradient distribution index( Figure 3) in 1980, 2000 and 2015. The change patterns of land use in the terrain gradient are basically the same in the three years. The low gradient region mainly distribute farmland, water land, construction land and unused land, grassland distributes in the middle gradient region, and the gradient of forest land is relatively high, but the distribution and change of different land types in the terrain gradient have their own characteristics.
(1) Farmland. With the increase of terrain gradient, the distribution area of each gradient unit gradually increases, reaching the maximum in the gradient interval (0.35, 0.36], and then gradually decreases, more than 99% of the farmland distributes in the region of gradient (0.00, 1.00]( Figure 2(a)). From 1980 to 2015, the area continues to decrease, the farmland gradient distribution indexes decrease with the increase of terrain gradient, the advantage distribution interval (0.00, 0.62] does not change, the advantage positions decrease with the increase of terrain gradient in the advantage distribution interval. The proportions of farmland in the advantage distribution interval to the total area account for 87.91%, 87.75% and 87.64% respectively in the three years. From 1980 to 2000, the reduction rate of farmland in the advantage interval is higher than that of the total farmland of the province 0.17 percentage points, the advantage position in (0.00, 0.58] rises, that in (0.00, 0.58] falls; from 2000 to 2015, the reduction rate of farmland in the advantage interval is higher than that of the total area of the province 0.20 percentage points, the advantage positions in (0.00, 0.31] and (0.58, 0.62] rise, that in (0.31, 0.58] falls (Figure 3(a)).
Figure 2. The land use area distributions versus terrain gradient.
Figure 3. The land use distribution indices versus terrain gradient.
(2) Forest land. With the increase of terrain gradient, the distribution area of each gradient unit gradually increases, reaching the maximum in the gradient interval (1.10, 1.11] of 1980, in (1.11, 1.12] of 2000 and 2015, and then gradually decreases. More than 49% of the forest land distributes in the region of gradient greater than 1.00, the area in the region of gradient less than 0.50 is only 8%. From 1980 to 2000, the area increases 0.5%, from 2000 to 2015, the area decreases 0.03%( Figure 2(b)). The forest land gradient distribution indexes increase with the increase of terrain gradient, the advantage distribution interval (0.64, 1.76] does not change, the advantage positions increase with the increase of terrain gradient in the advantage distribution interval. The proportions of forest land in the advantage distribution interval to the total forest land account for 84.34%, 84.17% and 84.15% respectively in the three years. From 1980 to 2000, the new forest land area in the advantage interval
(a) (b) (c)
(e) (f) (g)
(a) (b) (c)
accounts for 50.92% of the total new forest land area, the advantage position in (0.64, 0.91] rises, that in (0.91, 1.76] falls; From 2000 to 2015, the forest land area in the advantage interval loses 14.14km2,
the forest land area in the other interval adds 6.15 km2, the advantage position in (0.67, 1.50] rises,
that in (1.50, 1.67] falls( Figure 3(b)).
(3) Grass land. With the increase of terrain gradient, the distribution area of each gradient unit gradually increases, reaching the maximum in the gradient interval (0.74, 0.75] of 1980, in (0.78, 0.79] of 2000 and 2015, and then gradually decreases. More than 85% of the grass land distributes in the region of gradient (0.50, 1.50], the area in the region of gradient less than 0.50 is less than 8%, no grass land appears in the region of gradient greater than 1.50. The area of grass land gradually decreases from 1980 to 2015, the area decreases 768.77 km2 from 1980 to 2000, and the area
decreases 85.54 km2 from 2000 to 2015(Figure 2(c)). The grass land gradient distribution indexes
increase with the increase of terrain gradient, reaching the maximum in the gradient (1.10, 1.11], then decrease. The advantage distribution interval in 1980 is (0.54, 1.33], which rises to (0.55, 1.36] in 2000 and 2015, from 1980 to 2000, the advantage position in (0.55, 0.63] falls, that in (0.74, 1.33] rises, from 2000 to 2015, the advantage position in (0.55, 0.63] falls, that in (0.63, 1.36] rises( Figure 3(c)).
(4) Water land. Taking off the impact of large reservoirs in the low gradient regions, the distribution area of each gradient unit gradually increases with the increase of terrain gradient, reaching the maximum in the gradient interval (0.36, 0.37] of 1980, in (0.37, 0.0.38] of 2000 and 2015, and then gradually decreases. The water land gradient distribution indexes increase with the increase of terrain gradient, reaching the maximum in the gradient (0.53, 0.54] of 1980, in (0.55, 0.56] of 2000 and 2015, then decrease( Figure 2(d)). The advantage distribution interval in 1980 is (0.00, 0.66]; in 2000, the total area of water land in the province decreases by 644.02 km2, but the advantage
distribution interval enlarges to (0.00, 0.69], the advantage position in (0.00, 0.52] falls, that in (0.52, 0.69] rises; in 2015, the total area of water land in the province increases by 547.75 km2, but the
advantage distribution interval narrows to (0.26, 0.69], the advantage position in (0.26, 0.44] falls, that in (0.44, 0.69] rises( Figure 3(d)).
(5) Construction land. The distribution area of each gradient unit gradually increases with the increase of terrain gradient, reaching the maximum in the gradient interval (0.35, 0.36], and then gradually decreases. More than 99% of the construction land distributes in the region of gradient less than 0.78(Figure 2(e)). The construction land gradient distribution indexes decrease with the increase of terrain gradient. Although the construction land increases by 1388 km2 compared with that in
1980, the advantage distribution interval keeps in (0.00, 0.55], the advantage position in (0.00, 0.41] falls, the reduction rate is inversely proportional to the terrain gradient, the advantage position in (0.41, 0.55] rises, the rise rate is directly proportional to the terrain gradient. From 2000 to 2015, the total area of the construction land increases by 1648 km2 in the province, the advantage distribution
interval enlarges to (0.00, 0.56], the advantage position in (0.00, 0.39] falls, the reduction rate is inversely proportional to the terrain gradient, the advantage position in (0.39, 0.56] rises, the rise rate is directly proportional to the terrain gradient( Figure 3(e)).
(6) Unused land. The area of unused land gradually decreases over time, more than 90% of the area distributes in the region of gradient less than 0.50(Figure 2(f)). The advantage distribution interval in 1980 is (0.20, 0.45], which narrows to (0.20, 0.44] in 2000, and to (0.20, 0.43] in 2015(Figure 3(f)).
Conclusion
Based on the 30m×30m DEM, the paper calculates the terrain gradient in Henan Province, and then utilizes geostatistical analysis methods to quantitatively analyze the spatial distribution characteristics of terrain gradient, and the spatial relationships between land use structure and terrain gradient in Henan province, the results show that:
With the increase of longitude, the terrain gradient decreases gradually, showing the spatial pattern of the west high east low, the variety on the same latitude belt is significantly larger than that on the corresponding longitude belt.
(2) The distribution patterns of land use in the terrain gradient are basically the same in the three years as 1980, 2000 and 2015. The low gradient regions mainly distribute farmland, water land, construction land and unused land, grassland distributes in the middle gradient region, and the gradient of forest land is relatively high.
(3) Due to the needs of economic and social development, the total area of construction land is increasing over time, occupying lots of farmland and the forest land, the growth rate in middle low gradient region is higher than that in the low gradient region, and has a trend of expanding to higher gradient region at the same time. The area of farmland gradually decreases, mainly influenced by construction land expansion, returning farmland to forest and grassland policy and water conservancy projects, it tries to expand to higher gradient region to make up for the lost area, the area of middle gradient in its advantage region decreases mostly. The implementation of returning farmland to forest and grassland and the construction of urban ecological environment make lots of farmland and construction land change into forest land and grassland, but these still could not make up for their loss, they try to expand to higher gradient region. However, due to the forest and grassland saturation effect in higher gradient region, the expansion effect is not ideal. For the construction of Xiaolangdi Reservoir and South-to-North Water Diversion Project and urban water ecological engineering, the area of water land has been increasing continuously, making the advantage position is rising in the corresponding gradient region, the area of agricultural water land has been reduced, making the regional superiority has been reduced. The unused land mainly distributes in the lower reaches of the lower Yellow River. With the continuous re-farming, the area is gradually reduced.
References
[1] Fan Xingang, Ma Zhuguo, Yang Qing, et al. Land use/land cover changes and regional climate over the Loess Plateau during 2001–2009. Part II: Interrelationship from observations. Climatic Change, 4 (2014) 441-455.
[2] Li Jingjing, Lu Zhemin, Shi Xiaoping, et al.. Spatio-temporal variations analysis for land use in Fen River Basin based on terrain gradient. Transactions of the Chinese Society of Agricultural Engineering, 7 (2016) 230-236.
[3] Salazar Alvaro, Baldi Germán, Hirota Marina, et al. Land use and land cover change impacts on the regional climate of non-Amazonian South America: A review. Global and Planetary Change, 5 (2015) 103-119.
[4] Zhang Zhuzhou, Huang Qiuhao, Shi Yun. Relationship Between the Land Use Change and the Terrain Gradient in Counties in the Loess Hilly and Gully Region. Research of Soil and Water Conservation, 4 (2016) 331-337.
[5] Chen Yi, Lin Yiwei, Zhu Zhipeng, et al. Characteristic change and scaling effect of the land use pattern in Putian city based on the terrain gradient. Journal of Anhui Agricultural University, 1(2017) 102-107.
[6] Lu Zhixiang, Yang Yonggang, Zou Songbing, et al. A study of the land use change and its hydrologic response in the upper reaches of the Fen River. Journal of Glaciology and Geocryology, 1 (2014) 192-199.
[8] Chen Liding, Yang Shuang, Feng Xiaoming. Land use change characteristics along the terrain gradient and the spatial expanding analysis: A case study of Haidian District and Yanqing County Beijing. Geographical Research, 6 (2008)1225-1234.
[9] Salazar Alvaro, Baldi Germán, Hirota Marina, et al. Land use and land cover change impacts on the regional climate of non-Amazonian South America: A review. Global and Planetary Change, 5 (2015)103-119.