2017 2nd International Conference on Communications, Information Management and Network Security (CIMNS 2017) ISBN: 978-1-60595-498-1
A Time-aware POI Recommendation Method Exploiting User-based
Collaborative Filtering and Location Popularity
Ya-li SI
1,2,3, Fu-zhi ZHANG
1,3,*and Wen-yuan LIU
1,31School of Information Science and Engineering, Yanshan University, Qinhuangdao, 066004, China
2School of Liren, Yanshan University, Qinhuangdao, 066004, China
3
The Key Laboratory for Computer Virtual Technology and System Integration of Hebei Province, Qinhuangdao, 066004, China
*Corresponding author
Keywords: Location-based social networks, Point-of-interest recommendation, User-based
collaborative filtering, Location popularity, Temporal feature.
Abstract. Point-of-interest (POI) recommendation becomes an important research for location-based social networks, since it helps modern citizens to explore new locations in unvisited cites effectively according to their preferences. However, the current POI recommendation methods are lack of a deep mining in all time slots features and their effects on recommendation. To this end, in this paper we propose a POI recommendation method (called UPT) by combining time slot features, user-based collaborative filtering and spatial influence. Firstly, we extract time interval feature and time slot based popularity feature from history check-in datasets on LBSNs using probability statistical analysis method. Then, we devise a POI recommendation method based on the proposed temporal features to achieve better performance. In UPT, user-based collaborative filtering and smoothing technique are used by adding each time slot influence, and the overall popularity of a location is combined with each time slot feature. Our experimental results on Foursquare and Gowalla datasets show that UPT outperforms baseline POI recommendation methods in precision and recall.
Introduction
With the rapid development of modern cities, there are more and more point-of-interests (POIs), such as malls, hotels, tourist spots and restaurants, which enrich the recreational life of the public. Facing the huge number of POIs, it is difficult for citizens to select interesting or useful locations according to their interests, especially when they explore the unvisited areas. This is the well-known problem of “curse of choices” or “information overload”. Therefore, POI recommendation has been introduced to make satisfied decisions efficiently for users, which can also benefit business development [1].
The aim of POI recommendation is to recommend locations for citizens where they have not visited before [2]. In POI recommendation, the citizen personalized feature extraction is the most important content, which mainly utilizes the information of location-based social networks (LBSNs, e.g., Foursquare, Facebook, Gowalla, Twitter, Yelp and Dianping). In LBSNs, the user can check in a POI using his smartphone, and the corresponding time, coordinates of location and tips information are all stored in the LBSN database. By exploiting such check-in data, the multi-dimensional information features on location, time, social relationship and content [3] are extracted and used in the POI recommendation to achieve the better performance.
recommendation, which cause lower connection between users and locations. On the other hand, the existing POI recommendation methods only consider one time slot or adjacent time periods, which are lack of a deep mining in every time slot feature and its effect on recommendation.
To address the above limitations, we propose a new POI recommendation method exploiting user relation based on user-based CF, location popularity and temporal features, which is called UPT. The main contributions of this paper can be summarized as follows:
(1) We explore the time slots influences on the same location visited by a user and the popularity of a location, and extract the time interval feature and time slot based popularity feature from LBSNs check-in datasets using probability statistics analysis method.
(2) We propose a POI recommendation method based on the proposed temporal features, which combines the user-based CF and spatial popularity. The influences of every time slots are introduced to the user-based CF in order to realize the time smoothing technique and alleviate the data sparsity problem. The influence of each time slot is added to location popularity to enhance the relationship between geographical popularity factor and temporal factor.
(3) We conduct experiments on two large-scale real data sets, Foursquare and Gowalla, to evaluate the performance of proposed algorithm. The experimental results show that our algorithm outperforms the baseline POI recommendation methods in terms of precision and recall.
Related Work
The current research on POI recommendation can be categorized into four types: temporal factor, spatial factor, social factor and content factor. As two most special factors on LBSNs, temporal property and spatial feature are coherent and affect each other in citizens’ check-in behavior, which are used in POI recommendation algorithms to achieve better performance. For example, users regularly go to a popular mall for shopping in the evening. In this section, we mainly review the literatures of time-based and geography-based POI recommendation.
In time and geography aware POI recommendation methods, a day is split into 24 equal time slots by hour according to the check-in records, and POIs are recommended to users at target time using matrix factorization [9]. Aiming to solve the sparseness problem of each time slot, Yuan et al. [10] propose a time-aware POI recommendation method based on the user-based collaborative filtering, and use time slot smoothing technology to enhance the temporal influence on recommendation. Meanwhile, the popularity of target time is introduced to power law function to enhance the spatial influence. Furthermore, they propose a preference propagation algorithm using geographical- temporal influences aware graph to model check-in records [11]. Zhang et al. [4] propose a probabilistic framework by utilizing temporal influence correlations of both weekdays and weekends, and also integrate the temporal influence with social and geographical information. Zhao et al. [12] design a time indexing method according to month, weekday type, and hour slot for successive POI recommendation. The proposed model is built upon a ranking-based pairwise tensor factorization framework with a fine-grained modeling of user-POI, POI-time, and POI-POI interactions. Besides the power law distribution model on geographical factor [13], Liu et al. [14] combine a general Poisson geographical probabilistic factor model with user interest preferences factor, and capture the geographical influence based on Gaussian geographical distribution. Zhang et al. [15] propose the personalized two-dimensional kernel density estimation to replace the one-dimensional geographical distance, and they later propose a new gravity model exploiting the spatiotemporal sequential influence and the extended additive Markov chain [16]. The gravity model effectively integrates the spatiotemporal, social, and popularity influences by estimating a power law distribution. Debnath et al. [17] define a unified framework that takes four factors into consideration: user’s categorical preferences, temporal activities, location preferences and POI popularity.
The Proposed Method
Temporal Features Extraction
In this section, time interval feature and time slot based popularity feature are extracted from
large-scale LBSNs history check-in datasets. To facilitate the discussion, Uall denotes the set of all
check-in records in a LBSN, and each check-in record in the datasets is stored as a tuple <userID,
time, latitude, longitude, venueID>; U denotes the set of all users, L denotes the set of all
point-of-interests.
Time Interval Feature. The goal of POI recommendation is to provide users with locations of interest at a given time, and therefore temporal information is one of the most important factors to be considered. For example, a citizen used to go to the restaurant at 12:00, and we can infer that he will go to the same restaurant or other similar locations at around 12:00 (e.g., from 11:00 to 13:00) with great probability. According to the actual situations, the user may also visit restaurant at other time with a certain probability. Therefore, we call the time difference of a user visiting the same POI as time interval, and conduct probability statistics analysis on time interval. We split a day into 24 equal
time slots based on hour and use T to denote the set of all time slots, namely T={0, 1, ···, 22, 23}. Each
time slot is denoted by t (t is an integer and tT), e.g., 12:36 can be denoted as time slot t=12.
Definition 1 (Probability of Time Interval, TIP). Let tu,l and t’u,l be the time slots of a user uU
visiting a same location lL, and ∆t denotes time interval, ∆t=tu,l-t’u,l. Then, probability of time
interval, TIPΔt, is defined as the ratio of ∆t number to the total time interval number on a LBSN
check-in dataset, which can be calculated as follows:
, , ,
12
, , ,
11
( )
u l t u U l L
t
u l t u U l L
t
num TIP
num
. (1)
Where numu,l,∆t is the number of the user u check-in location l at a time interval ∆t. If ∆t>12, we have
∆t=∆t-24; if ∆t<-11, we have ∆t=∆t+24, and ∆t{-11, -10, ···, 11, 12}.
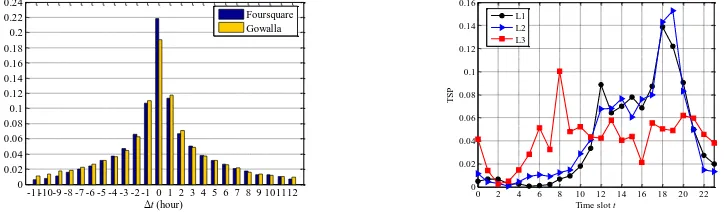
In order to mine time interval feature, we compute probabilities of all time intervals on Foursquare
and Gowalla, and plot the TIP results in Figure 1. As shown in Figure 1, the highest TIP values are
21.86% and 19.07% on Foursquare and Gowalla respectively, which are both at time interval ∆t=0. It
can also be seen that the probability value declines as the absolute value of ∆t increases, and it has the
visiting probability of 1.02% on Foursquare even when ∆t=11. The statistical results indicate that we
can not only recommend locations to users at the target time, but also recommend locations at other times, because each time slot has its own recommendation probability. Inspired by this, we combine probability of time interval with recommendation method, and use smoothing technology extended to all time slots to solve the problem of data sparsity and improve time correlation of recommendation.
-11-10-9 -8 -7 -6 -5 -4 -3 -2 -1 0 1 2 3 4 5 6 7 8 9 101112 0
0.02 0.04 0.06 0.08 0.1 0.12 0.14 0.16 0.18 0.2 0.22 0.24
T
IP
Δt (hour)
Foursquare Gowalla
0 2 4 6 8 10 12 14 16 18 20 22
0 0.02 0.04 0.06 0.08 0.1 0.12 0.14 0.16
Time slot t
T
S
P
[image:3.595.117.479.611.721.2]L1 L2 L3
Figure 1. Probability distribution of different time intervals. Figure 2. TSP values of top-3 locations on Foursquare.
Different from the prevalence in all locations, we focus on the detailed popularity of a location in each hour of a day, which will have a beneficial effect on recommendation.
Definition 2 (Popularity on Time Slots, TSP). The time slot based popularity of a POI lL at a time
slot tT, TSPt,l, is defined as the ratio of check-in number of visiting l at the time slot t to the total
check-in number of visiting l at all time slots, which can be calculated as follows:
, , ,
, ', '
u t l u U
t l
u t l t T u U
num TSP
num
. (2)In order to show the popularities of a location at different time slots, we give the TSP values of top
three locations with highest check-in number on Foursquare in Figure 2. As shown in Figure 2, there is a significant difference in popularity among different time slots for each location. This observation illustrates that the popularity of POIs can be influenced by time slots, and it has different popularity in different time slot for any location on LBSNs. Therefore, we will introduce the time slot prevalence to location popularity in spatial influence recommendation, in order to improve the relevance of popularity and time.
The Proposed POI Recommendation Algorithm
User-based CF with Time Interval Feature. In our POI recommendation method, we use user-based collaborative filtering to realize the user relation. In the existing POI recommendation works, some methods only use the similarity of users without considering temporal influence at first. Then, the target time is introduced to compute the user similarity, but it causes the more sparse data and worse performance of recommendation results. In order to solve the data sparsity, the smoothing technique is used by extending several time slots. However, it does not mean that other time slots have no chance of check-in for citizens, and all time slots with their respective popularity features are not used in recommendation. Therefore, we utilize smoothing technique of every time slots by combining the probability of time interval with user-based CF.
User-based CF is to recommend the locations for a target user where the similar users have visited. According to this idea, we calculate the similarities between the target user and other users in LBSNs based on cosine similarity method, which is widely used for measuring the implicit data. To make use of the time slot feature, we extend the user-based CF by leveraging the probability of each time interval. Considering that the user relation is one part of our method, we use the whole user set instead
of only top-n similar users to calculate the user-based CF probability for a target user.
Definition 3 (User similarity, simu,v). For users u, vU, the similarity between u and v, simu,v, is
calculated as follows:
, ,
, 2 2
, ,
( u l v l)
l L u v
u l v l l L l L
r r
sim
r r
. (3)Where ru,l is a binary check-in value, ru,l=1 if user u checked location l; otherwise ru,l=0. The
denominator will not be zero, because each user visits some locations and the corresponding information is recorded in the check-in dataset.
Definition 4 (Probability of user-based CF with time interval, P(u,t,lucf) ). For a target user uU, the
probabilistic value P(ucf)
u,t,l of user-based CF with time interval that the user will check in an unvisited
location l at time slot t is calculated as follows:
23
, , ', ( )
, , '
' 0 ,
( )
( u v v t l )
ucf v U
u t l t t
t v U u v
sim r
P TIP
sim
. (4)Location Popularity with Time Slot Feature. In spatial factor, we utilize the POI popularity to
make recommendation. The existing methods define the popularity of a POI l as the ratio of check-in
all locations. Different from that, we combine the overall POI popularity with the target time popularity according to the time slot based popularity feature of a location.
Definition 5 (Overall Popularity of a location, opl). The overall popularity of a location lL,
denoted as opl, is defined as the ratio of check-in number in location l to the total check-in number in
all locations, which can be calculated as follows:
, , ' ' u l u U l v l v U l L
num op num
. (5)Definition 6 (Probability of popularity with time slot, P(sp)
u,t,l). For a target user uU, the time slot
based popularity probabilistic value P(u,t,lsp) that the user will check-in an unvisited location l at time slot
t is calculated as follows:
( )
, , ,
sp
u t l l t l
P op TSP . (6)
The Integrated POI Recommendation Algorithm. Based on the user-based CF with time interval and location popularity with time slot, we give the unified framework of our UPT algorithm.
Firstly, given a user u and the target time t, we can calculate the probability value of the user u will
visit location l at time slot t. It includes two parts: one part is the probability value P(ucf)
u,t,l of user-time
based CF, the other part is the probability value P(sp)
u,t,l of time slot based spatial popularity.
Secondly, we carry on the normalization calculation using min-max normalization for user-based
CF with time interval probability P(ucf)
u,t,l and popularity with time slot probability P
(sp)
u,t,l. Because the two
probability values are measured by different methods and have different value ranges.
( ) ( ) , , , , ( ) , , ( ) ( ) , , , , min( )
max( ) min( )
ucf ucf u t l u t l ucf
u t l ucf ucf
u t l u t l
P P
r
P P
. (7)
( ) ( ) , , , , ( ) , , ( ) ( ) , , , , min( )
max( ) min( )
sp sp
u t l u t l sp
u t l sp sp
u t l u t l
P P
r
P P
. (8)
Finally, we combine the normalized results r(ucf)
u,t,l and r
(sp)
u,t,l using linear interpolation to compute the
probability value of our UPT algorithm, which is computed as Eq. (9). The parameter α is used to tune the weight between user-based CF probability and popularity probability. The probability values of all
POIs are sorted and the top-n POIs are returned as recommendation results.
( ) ( )
, , , , (1 ) , ,
ucf sp
u t l u t l u t l
r r r . (9)
The proposed UPT algorithm is described as follows.
Algorithm 1 UPT algorithm
Input: The user check-in dataset Uall, the target user u
and time slot t
Output: The recommended top-n POIs 1: for t’=0 to 23 do
2: compute TIPt’-t using Eq. (1);
3: end for
4: for each vU do
5: compute simu,v using Eq. (3);
6: end for
7: for each lL do
8: compute TSPt,l using Eq. (2);
9: compute opl using Eq. (5);
10: compute P(ucf)
u,t,l using Eq. (4);
11: P(sp)
u,t,l←opl·TSPt,l;
12: r(ucf) u,t,l←(r
(ucf) u,t,l-min(r
(ucf)
u,t,l))/(max(r (ucf) u,t,l)-min(r
(ucf) u,t,l));
13: r(sp) u,t,l←(r (sp) u,t,l-min(r
(sp)
u,t,l))/(max(r (sp) u,t,l)-min(r
(sp) u,t,l));
14: ru,t,l←αr
(ucf) u,t,l+(1-α)r
(sp) u,t,l;
15: add ru,t,l to an arraylist AL;
16: end for
17: sort AL by descending and returntop-n POIs;
We give the time complexity analysis of UPT algorithm. In the first step (Lines 1 to 3), all check-in
records are used to calculate the probability of time interval and the complexity is O(24×|U|×|Lu|),
where |Lu| is the maximum number of locations a user has visited. In the second step (Lines 4 to 6), the
locations users u and v have visited. Finally, the probabilities of all locations are computed (Lines 7 to
16) with the cost of O(|Uall|+|Uall|+24×|L|×|U|). The total time complexity of UPT is the sum of all
steps, which is O(24×|U|×|Lu|)+O(|U|×|Luv|)+O(2×|Uall|+24×|L|×|U|)≈O(24×|L|×|U|).
Experiments and Analysis
Datasets
In this paper, experiments are conducted on two publicly available LBSNs datasets. The Foursquare contains 194,108 check-in records made by 2,321 users at 5,596 locations, and Gowalla contains 456,988 check-in records made by 10,162 users at 24,250 locations. Most importantly, the check-in densities are 0.0149 and 0.00185 on Foursquare and Gowalla respectively, which can be seen that LBSNs datasets are extreme sparse. For each user, 25% of his or her visited POIs as testing data to evaluate the effectiveness of methods, and the rest 75% check-ins are marked as training data.
Evaluation Metrics
To evaluate the quality of the POI recommendation methods, we use two standard metrics in this paper: precision and recall. Precision is defined as the ratio of the visited POIs number to recommended POIs number, and recall is defined as the ratio of the visited POIs number to POIs
number in testing set. Let Tu denotes the POIs set of user u in the testing data, Ru denotes the top-n
recommended POIs set of user u, and then we can calculate precision and recall using the following
equations respectively.
| |
@
| |
u u u U
u u U
T R
precision n
R
. (10)| |
@
| |
u u u U
u u U
T R
recall n
T
. (11)Experimental Results and Analysis
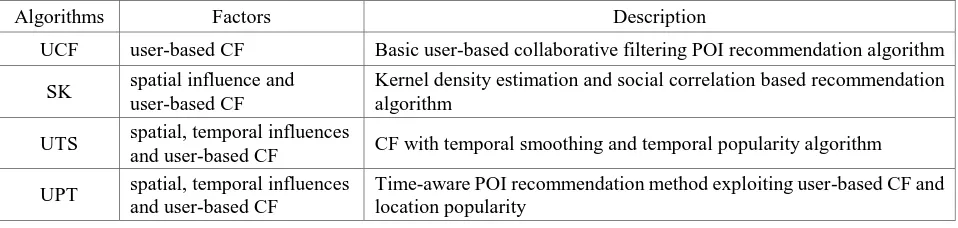
[image:6.595.59.538.605.719.2]We compare the proposed algorithm with the other three baseline algorithms in Table 1. UCF denotes the user-based collaborative filtering method without using any feature [7]. SK denotes the spatial-based recommendation algorithm using kernel density estimation theory and social correlation [15]. UTS denotes the enhancement of user-based collaborative filtering algorithm by temporal smoothing, and adding POI popularity at a time slot [10]. UPT is the algorithm proposed in this paper, which is combined user-based CF and location popularity with time slot features.
Table 1. Recommendation algorithms for comparison.
Algorithms Factors Description
UCF user-based CF Basic user-based collaborative filtering POI recommendation algorithm
SK spatial influence and
user-based CF
Kernel density estimation and social correlation based recommendation algorithm
UTS spatial, temporal influences
and user-based CF CF with temporal smoothing and temporal popularity algorithm
UPT spatial, temporal influences
and user-based CF
Time-aware POI recommendation method exploiting user-based CF and location popularity
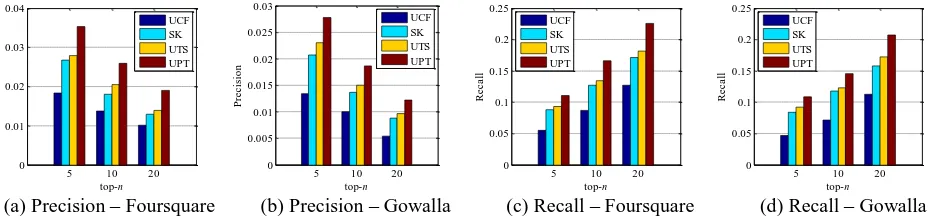
values for UPT algorithm in the following experiments. Figure 3(a) and Figure 3(b) show the precisions of four recommendation algorithms on Foursquare and Gowalla, respectively. As shown in
Figure 3(a) and Figure 3(b), the precision values of UPT are always highest at top-n for both datasets.
Take top-5 for an example, compared with UCF, SK and UTS, precision of UPT on Foursquare increases by 92%, 32% and 27%, respectively. These results show the superiority of UPT algorithm in metric of precision.
5 10 20 0
0.01 0.02 0.03 0.04
top-n
P
re
c
is
io
n
UCF SK UTS UPT
5 10 20
0 0.005 0.01 0.015 0.02 0.025 0.03
top-n
P
re
c
is
io
n
UCF SK UTS UPT
5 10 20
0 0.05 0.1 0.15 0.2 0.25
top-n
R
e
c
a
ll
UCF SK UTS UPT
5 10 20
0 0.05 0.1 0.15 0.2 0.25
top-n
R
e
c
a
ll
UCF SK UTS UPT
[image:7.595.65.530.159.269.2](a) Precision – Foursquare (b) Precision – Gowalla (c) Recall – Foursquare (d) Recall – Gowalla Figure 3. Precisions and Recalls of recommendation algorithms.
Figure 3(c) and Figure 3(d) show the recall results with different recommendation algorithms on Foursquare and Gowalla datasets, respectively. As shown in Figure 3(c) and Figure 3(d), the recall
values of UPT are also highest at top-n for both datasets. Take top-20 for an example, compared with
UCF, SK, UTS, recall of UPT on Foursquare increases by 77%, 32% and 24%, respectively; recall of UPT on Gowalla increases by 85%, 31% and 20%, respectively. The improvement results indicate that UPT performs well in recall.
From Figure 3, we can see that UPT always achieves the best results in precision and recall under the same situation on both datasets, and the performance of UPT is improved greatly. The reason is that UPT algorithm is incorporated with spatial popular, user-based CF and time slot features together. Specifically, every time slots are utilized in user-based CF according to their own probability feature and the time slot popular of a location is considered in the overall POI popularity. Thus, UPT is better than UCF that only takes user-based CF into account, better than SK algorithm that considers the spatial and social influences, and better than UTS that uses a part of time slots. Besides that, it can be seen obviously that the precisions and recalls on Foursquare are better than that on Gowalla for four algorithms in the same situation. The reason is that Gowalla have larger and sparser data than Foursquare, which causes more difficult to make recommendation using the same algorithm.
Summary
Acknowledgement
This research was financially supported by the National Natural Science Foundation of China (No.61379116, No.61300193), the Natural Science Foundation of Hebei Province (No.F2015501105, No.F2015203046).
References
[1] H. Gao, J. Tang, X. Hu, H. Liu, Modeling temporal effects of human mobile behavior on
location-based social networks, in: Proceedings of the 22nd ACM International Conference on Information & Knowledge Management, 2013, pp. 1673-1678.
[2] Y. Si, F. Zhang, W. Liu, CTF-ARA: An adaptive method for POI recommendation based on
check-in and temporal features, Knowledge-Based Systems, 128 (2017) 59-70.
[3] J. Lu, D. Wu, M. Mao, W. Wang, G. Zhang, Recommender system application developments: a
survey, Decision Support Systems, 74 (2015) 12-32.
[4] J.D. Zhang, C.Y. Chow, TICRec: A probabilistic framework to utilize temporal influence
correlations for time-aware location recommendations, IEEE Transactions on Services Computing, 9(4) (2016) 633-646.
[5] J. Zhang, C. Chow, CoRe: Exploiting the personalized influence of two-dimensional geographic
coordinates for location recommendations, Information Sciences, 293 (2015) 163-181.
[6] H. Gao, J. Tang, H. Liu, gSCorr: modeling geo-social correlations for new check-ins on
location-based social networks, in: Proceedings of the 21st ACM International Conference on
Information and Knowledge Management,2012, pp. 1582-1586.
[7] M. Chen, F. Li, G. Yu, D. Yang, Extreme learning machine based point-of-interest
recommendation in location-based social networks, in: Proceedings of the International Conference on Extreme Learning Machine, 2016, pp. 249-261.
[8] Y. Yu and X. Chen, A survey of point-of-interest recommendation in location-based social
networks, in: Workshops at the 29th AAAI Conference on Artificial Intelligence, 2015, pp.53-60.
[9] H. Gao, J. Tang, X. Hu, H. Liu, Exploring temporal effects for location recommendation on
location-based social networks, in: Proceedings of the 7th ACM International Conference on Recommender Systems, 2013, pp. 93-100.
[10]Q. Yuan, G. Cong, Z. Ma, A. Sun, N.M. Thalmann, Time-aware point-of-interest
recommendation, in: Proceedings of the 36th international ACM International Conference on Research and Development in Information Retrieval (SIGIR), 2013, pp. 363-372.
[11]Q. Yuan, G. Cong, A. Sun, Graph-based point-of-interest recommendation with geographical
and temporal influences, in: Proceedings of the 23rd ACM International Conference on Information and Knowledge Management, 2014, pp. 659-668.
[12]S. Zhao, T. Zhao, H. Yang, M. R. Lyu, I. King, STELLAR: Spatial-temporal latent ranking for
successive point-of-interest recommendation, in: Proceedings of the 30th AAAI International Conference on Artificial Intelligence, 2016, pp. 315-321.
[13]M. Ye, P. Yin, W.C. Lee, D.L. Lee, Exploiting geographical influence for collaborative
point-of-interest recommendation, in: Proceedings of the 34th ACM SIGIR international conference on Research and development in Information Retrieval, 2011, pp. 325-334.
[14]B. Liu, H. Xiong, S. Papadimitriou, Y.J. Fu, Z.J. Yao, A general geographical probabilistic factor
[15]J.D. Zhang, C.Y. Chow, Point-of-interest recommendations in location-based social networks, Sigspatial Special, 7(3) (2016) 26-33.
[16]J. Zhang, C. Chow, Spatiotemporal sequential influence modeling for location
recommendations: A gravity-based approach, ACM Transactions on Intelligent Systems & Technology, 7(1) (2015) 1-25.
[17]M. Debnath, P.K. Tripathi, R. Elmasri, Preference-aware POI recommendation with temporal