2017 2nd International Conference on Advances in Management Engineering and Information Technology (AMEIT 2017) ISBN: 978-1-60595-457-8
Research of Information Quantization Based on the Quantum Theory
Mei-ling JIN
and Feng-ming LIU
*School of Management Science and Engineering, Shandong Normal University, Ji’nan 250014, China
*
Corresponding author
Keywords: Quantum mechanics, Information wave, The wave-particle duality, Bessel function.
Abstract. Based on the quantum theory, the information was quantified from the information receiving aspect. First, several concepts were presented, such as the InfoBar, the Power of Information as well as the algorithm of the Power of Information. Then, according to the relationship between the InfoBar and the amount of Information, the wave equation was decided, meanwhile, the equation of wave function was defined as well. Finally, via the Bessel function, the received model results are basically matched. Thus, the validity of the model can be proved.
Introduction
People have various opinions even with the same event. It can be explained from the perspective of informatics. Different people received different information from a specific event. The quantitative research in current information area has become a research hotpot. In addition, the Quantum Mechanics plays an important role as cornerstone of the development of modern technology.
The quantification of information was put forward by Shannon[1-2]. Liu [3], quantified and restrained the noise problem suppressed by A/D convert. Tian [4], quantified compression perception of signal. Wang [5] and H. Cao[6] proposed the quantum artificial neural network. Then, Adenilton J. da Silva show that the CCWNN is in fact equivalent to a classical neural network[7]. Liu [8] quantified the signal had proved the validity of the formula. Alexey V. Melkikh proposed a model of partially directed evolution[9]. In biological science, Michael A. Taylor[10] and Li[11] further seek to introduce quantum physicists to some of the central challenges of optical measurements. According to quantum game, Łukasz Pawela[12] study the advantages of quantum strategies. However, all scholars above is based on the perspective of the sender to study it.
The information is using words, images or other data to suggest the content, so the information is defined as a substance. we thought that information is spreading in the form of wave. But different information shows different states. From above, information is wave-particle duality. First, the article gave some definitions; Then, it puts forward the calculation model of Information Can, and constructs the wave equation of information, gets the information wave function equation, and the corresponding simulation experiment verifies the validity of the model.
The Differential Model of Information Content and the Number of InfoBar
Related to the definition
InfoBar.
Definition 1. InfoBar, which is contained in the characteristics of the entry, is to point to a particular information.
Hypothesis 1. A information has n characteristic items.
Information Content. The different receivers can gain different degree of information. One particular receiver will gain a different level of understand of the same event in different time period.
Hypothesis 3. The degree that different receivers receiving the same information at the same time is equivalent to the degree that the same receivers receiving the same information at different time.
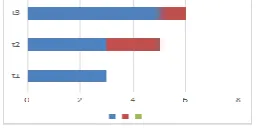
[image:2.612.242.370.155.220.2]Because that the degree that the receivers receive the same information at different time is different and receive different, the degree of receiving information at time t1,t2,t3is shown below:
Figure 1. The total length of horizontal column above at the time t1,t2,t3is the knowledge value for the receiver at that time. And the
orange part is the poor of the knowledge value with the last moment.
As shown, the knowledge poor not necessarily present the single increase or decrease state, but the volatility state. For the convenience of calculation, we make the following assumptions:
Hypothesis 4. The knowledge poor that the receivers receive between this moment and the last moment is never negative.
Definition 2. Information content is the poor of knowledge between moment iand moment i−1,
namely,
1
− − =
i i
i K K
I (1)
Among them, Kis the knowledge value. Suppose that a message hasnInfoBar, so in natural
systems, there are informationMrelated tonInfoBar, and the receivers can receive informationmfrom
informationMrelated tonInfoBar, then,
i i
p I = log 1
(2),
Is the information content that the i receiver receives, among them, M m
p i
i =
.
Information Can. We can easily know that the information can of each recipient is not only related with the received information content, but also its InfoBar, so we define that information can is the product of the number of InfoBar and information content, namely
i i i i i
p q I q
E = ⋅ = ⋅log 1
(3),
Is the information can which the i receiver gets, among them, qiis the number of InfoBar that the i
receiver gets. It is known by the formula 3 that the information can be discrete, which can only be integer times of a minimum energy, so the minimum energy is the quantum information can.
The Wave Equation of the Information
We can see the process of receiving information as the process of quantum fluctuations. Assuming that p is the transaction price, v is the volume corresponding to the price, and, we can get the wave equation:
( )] 0
[ )
( 2 0
2
= −
− +
+ ψ ψ
ψ
p p A E dp d dp d p
(4) the boundary conditions is
0 ) ( , )
( , 0 ) 0
( = ψ 0 < ∞ ψ +∞ →
ψ p
Among that,Eis the trading energy,pis the transaction price,p0is the equilibrium price,Vis the
sum of volume,Ais the coefficient of trading.
0 )] (
[ )
( 2 0
2 = Ψ − − + Ψ + Ψ q q A E dq d dq d q (6) the boundary conditions are
0 ) ( , ) ( , 0 ) 0
( = Ψ 0 < ∞ Ψ +∞ →
Ψ q
. (7) Among that,Eis the information can; qis the number of the InfoBar which the receivers receive,
which corresponding to the transaction price in the formula 4; q0is the average number of the InfoBar,
Mis the sum of the number of the InfoBar; Ais the receiving coefficient, and Iis the information
content that the receivers receive, which corresponding to the number of the InfoBar q.
Because that information can is E q I q p
1 log ⋅ = ⋅ =
, so the analytical solution is
) 2 , 1 , 0 ( )], ( [ )
( = 0 − 0 =
Ψ q C J q q m
m m
m ϖ (8)
Among that,J0[ϖm(q−q0)]is the zero order Bessel characteristics function,Cmis the normalized
constant,ϖm(ϖ>0) is the eigenvalue, and which meets
) 2 , 1 , 0 ( ,
2 = − = =
m const A I ϖ (9)
The Function of the Information Wave
Because of the Bessel characteristic function is
α α α + ∞ =
∑
Γ −+ += m m m m m m z J 2 0 ) 2 ( ) 1 ( ! ) 1 ( ) (
, (10) The wave function can express as
k k k q q k C
q 0 2
0 ] 2 ) ( [ ! ) 1 ( ) ( = − − Ψ ∑ ∞ = ϖ (11) The probability density function is
) ( ) ( * q q
f =Ψ Ψ
(12)
Parameter estimation and simulation results
This article assumes that the same data information that the receiver will receive is the literature. The total number of the InfoBar of the message isn; We randomly select eight groups, each group has 20 recipients. For the convenience of calculation, we simply assume that the receiver's information content in each group exists the following pattern (Please see the details at appendix 1):
i
i
I
I
=
+
+1
1
(13)Sample distribution
Definition 1. Make the number of the InfoBar that different receivers know be classified into 10
independent range according to the following rules. To be first, find the highestqmaxand lowest
numberqminfrom the 20 recipients, ordered 10
min
max q
q
q= −
∆
p
p
p
p
p
p
p
p
p
p
p
=
,
=
+
∆
,
=
+
2
∆
,
,
=
+
9
∆
0 9 0 2 0 1 min
0
(14)so, sample interval is
) , [ ), , [ , ), , [ ), ,
[p0 p1 p1 p2 p8 p9 p9 p10 (15)
therefore,
∑
∑
= ∈ − = n i i q q q i i I IQ i i i
1 ) ,
[ 1
(16)
Among that,Iiis the information content which corresponding to the number of InfoBarqi.
Therefore, we callQias the probability which the sample fall into the i(i=1,,10)interval, denoted
q Q q i i ∆ = Ψ( )
(17) )
(qi
Ψ
is the probability density of the sample.
Parameter Estimation
Through the sample data, we can calculate the average value in each group, q0=3, according to
quantum mechanics,
1 ) ( 2 = Ψ
∫
+∞ ∞− q dx , (18)
Combined the formula 11 with the formula 18, we can get that
1 ) ) 2 ) ( ( ) ! ! ( ) 1 (
( 0 2( ) 2
0 0 2
2 − − =
∫ ∑∑
+∞ ∞ − + +∞ = +∞ = + dq q q n mC m n
m n
n m ϖ
, (19) Because that the number of the InfoBar in a specific information is limited, which can be written as
] ,
[qmin qmax , so the formula 19 can be written to
1 ) 2 ) ( ( ) ! ! ( ) 1 ( max min 2 0 0 ) ( 2 0 2 2 = − −
∫
∑∑
+∞ = ∞ + = + + dq q q n m C q q m n n m n m ϖ. (20) Another will also be determined, therefore, the above formula can be rewritten as
2 1 2 0 0 ) ( 2 0
2 ) )
2 ) ( ( ) ! ! ( ) 1 ( ( ) ( max min − ∞ + = ∞ + = + + − −
=
∫
∑∑
q q dqn m C q q m n n m n m ϖ ϖ
, (21)
So, theϖ and theC(ϖ)which make theψ(q)and the Ψ(q)has the minimum difference estimated by using the sample date.After calculated, theCand theϖ in each group are shown in the table below:
Table 1. Parameter Statistics.
group1 group2 group3 group5 group6 group7 group8
C 2.176 3.887 7.269 2.551 4.146 3.988 8.154
ϖ 231 421 55 170 307 102 83
The Experimental Simulation
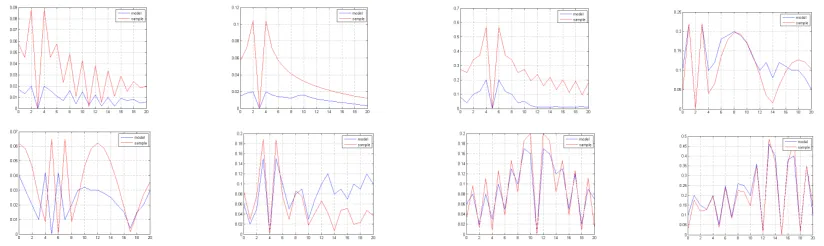
data, and then the contrast graphic integration of statistical results gotten through the MATLAB are as follows:
[image:5.612.94.506.100.223.2]
Figure 2. The red curve in the table and the blue curve respectively express the wave behavior of the model and the information of sample data. We take the parameters in table 1 into the formula 11, then we can get the red curve in figure 2.
In order to make the experiment be more accuracy, we took the experiments many times and choose the except 8 groups, which shown in Figure (a), Figure (b),..., Figure (h). This shows that the structure of the wave function equation is the basic reasonable. We can have the further study for information quantization based on which, and which has certain theoretical significance.
Conclusions
Based on the knowledge of quantum mechanics, this paper puts forward some new concepts and studies the information quantization in terms of receiving information. And, this paper builds the differential model of receiving information, and give the information wave function combined with Bessel function equation, finally proves the rationality of the model by numerical simulation. It will reflect the volatility when different receivers receive the same information more accurately.
Appendix
Assuming that the received information is an article to be published in the literature, there are totalMpaper. When the number of InfoBar that the receivers receive isi, there aremafter typed
theiInfoBar in the China web search box, so the information content of the receiver is
M m p
p
I i
i
i log log
1
log = − = −
=
.
Assuming that when the number of InfoBar of the receiver isi+1, there are total m
2 1
as a result, so,
i i
i
i I
M m M
m p
p
I = = − + = − = − − = −
+
+ log 1
2 1 log 2
1 log log
1
log 1
1 1
Acknowledgment
This work was supported in part by the National Natural Science Foundation of China (No. 61170038, 61472231), the National Social Science Foundation of China (No. 14BTQ049), and a project of International Cooperation in Training of Excellent Backbone Teachers for Advanced University in Shandong Province.
References
[2] Petr Jizba, Jacob A. Dunningham, Jaewoo Joo, Role of information theoretic uncertainty relations in quantum theory, Annals of Physics, 2015(355):87-114.
[3] Liu Ming-Feng, Ni Guo-Qiang, Bai Yan-Zhu, Tao Ran, A Novel Method for Suppressing the Quantization Noise Based on Fractional Fourier Transform, Transaction of Beijing Institute of Technology, 2015,35(12):1285-1290.[in Chinese]
[4] Tian Cai-Li, Fang Yong, Quantization of Compressive Sensing Based on Trellis Coded Quantization, Bulletin of Science and Technology, 2015, 31(8):265-267. [in Chinese]
[5] Wang Yue-Qing, Wang Jian, Wang Fan, Zhang Xiu-Qiang, Li Zheng, Liu Ya-Nan, A Method for Quantification Analysis for Complex Electromagnetic Environment, Chinese Journal of Radio Science, 2013, 28(4):744-753. [in Chinese]
[6] H. Cao, F. Cao, D. Wang, Quantum artificial neural networks with applications, Inf. Sci. 2015 (290):1–6.
[7] Adenilton J. da Silva, Wilson R. de Oliveira, Comments on “quantum artificial neural networks with applications”, Information Sciences, 2016(370-371):120-122.
[8] Liu Xiao-Hui, Huang Long, Xie Jin-Shi, Analysis of Quantization of Gaussian Signals, Journal of National University of Defense Technology, 2011, 33(5):145-149.
[9] Alexey V. Melkikh, Quantum information and the problem of mechanisms of biological evolution, BioSystems, 2014(115):33-45.
[10] Michael A. Taylor, Warwick P. Bowen, Quantum metrology and its application in biology, Physics Reports, 2016(615):1-59.
[11] Jingfei Li, Peng Zhang, Dawei Song, Yuexian Hou, An adaptive contextual quantum language model, Physica A, 2016(456):51-67.