Anzalee Khan 1, 2,4 §Charles Lewis 1, 6* Jean-Pierre Lindenmayer 3, 4, 5*
1
Fordham University, Department of Psychometrics, Bronx, NY, United States of America
2
ProPhase, LLC, New York, NY, United States of America
3
New York University, School of Medicine, New York, NY, United States of America
4
Nathan S. Kline Institute for Psychiatric Research, Orangeburg, NY, United States of America
5
Manahttan Psychiatric Center, Wards Island, NY, United States of America
6
Educational Testing Services, ETS, Princeton, NJ, United States of America
*These authors contributed equally to this work
§
Corresponding author: Anzalee Khan
Email addresses:
JPL: [email protected]
Use of NON-PARAMETRIC Item Response Theory
to develop a shortened version of the Positive
and Negative Syndrome Scale (PANSS)
Khan
et al
.
R E S E A R C H A R T I C L E
Open Access
Use of NON-PARAMETRIC Item Response Theory
to develop a shortened version of the Positive
and Negative Syndrome Scale (PANSS)
Anzalee Khan
1,2,4*, Charles Lewis
1,6†and Jean-Pierre Lindenmayer
3,4,5†Abstract
Background:Nonparametric item response theory (IRT) was used to examine (a) the performance of the 30 Positive and Negative Syndrome Scale (PANSS) items and their options ((levels of severity), (b) the effectiveness of various subscales to discriminate among differences in symptom severity, and (c) the development of an
abbreviated PANSS (Mini-PANSS) based on IRT and a method to link scores to the original PANSS.
Methods:Baseline PANSS scores from 7,187 patients with Schizophrenia or Schizoaffective disorder who were enrolled between 1995 and 2005 in psychopharmacology trials were obtained. Option characteristic curves (OCCs) and Item Characteristic Curves (ICCs) were constructed to examine the probability of rating each of seven options within each of 30 PANSS items as a function of subscale severity, and summed-score linking was applied to items selected for the Mini-PANSS.
Results:The majority of items forming the Positive and Negative subscales (i.e. 19 items) performed very well and discriminate better along symptom severity compared to the General Psychopathology subscale. Six of the seven Positive Symptom items, six of the seven Negative Symptom items, and seven out of the 16 General
Psychopathology items were retained for inclusion in the Mini-PANSS. Summed score linking and linear interpolation was able to produce a translation table for comparing total subscale scores of the Mini-PANSS to total subscale scores on the original PANSS. Results show scores on the subscales of the Mini-PANSS can be linked to scores on the original PANSS subscales, with very little bias.
Conclusions:The study demonstrated the utility of non-parametric IRT in examining the item properties of the PANSS and to allow selection of items for an abbreviated PANSS scale. The comparisons between the 30-item PANSS and the Mini-PANSS revealed that the shorter version is comparable to the 30-item PANSS, but when applying IRT, the Mini-PANSS is also a good indicator of illness severity.
Background
One of the most widely used measures of psychopathol-ogy of schizophrenia in clinical research is the Positive and Negative Syndrome Scale (PANSS) [1,2]. The 30-item PANSS was developed originally for typological and dimensional assessment of patients with schizophrenia [1] and was conceived as an operationalized, change-sen-sitive instrument that offers balanced representation of positive and negative symptoms and estimates their rela-tionship to one another and to global psychopathology.
It consists of three subscales measuring the severity of (a) Positive Symptoms (seven items), (b) Negative Symptoms (seven items), and (c) General Psychopathology (16 items). The PANSS is typically administered by trained clinicians who evaluate patients’current severity level on each item by rating one of seven options (scores) repre-senting increasing levels of severity. The administration generally takes 30 to 60 minutes [1,3], depending on the patient’s level of cooperation and severity of symptoms. The PANSS has demonstrated high internal reliability [4,5], good construct validity [4], and excellent sensitivity to change in both short term [6] and long term trials [7]. However, despite extensive psychometric research on the PANSS, until a recent Item Response Analysis [IRT; [8]],
* Correspondence: [email protected]
†Contributed equally
1Fordham University, Department of Psychometrics, Bronx, NY, USA
Full list of author information is available at the end of the article
it was unclear how individual PANSS items differ in their usefulness in assessing the total severity of symptoms.
Studies examining the psychometric properties of the PANSS have focused on estimates of scale reliability, validity, and factor analysis using methods from Classi-cal Test Theory [CTT; [9]]. These methods rely primar-ily on omnibus statistics that average across levels of individual variation. Commonly used reliability statistics (e.g., coefficient alpha) may obscure the fact that scale reliability is likely to vary across different levels of sever-ity being measured [10]. Most important, CTT methods cannot weigh the quality of a scale as a function of dif-ferent levels of psychopathology in the measured disorder.
For unidimensional scales consisting of two or more items with ordered categorical response choices, IRT is a very efficient statistical technique for item selection and score estimation [[11,12] and [13]]. Methods based on IRT provide significant improvements over CTT, as they model the relation between item responses and symptom severity directly, quantifying how the performance of indi-vidual items and options (e.g., for PANSS, severity levels range from one to seven) change as a function of overall symptom severity. As schizophrenia is a multidimensional disorder consisting of various symptoms clusters, IRT can be used to test each unidimensional subscale of the PANSS (i.e., Positive Symptoms, Negative Symptoms, and General Psychopathology). IRT analyses can provide unique and relevant information on (a) how well a set of item options assess the entire continuum of symptom severity, (b) whether scores assigned to individual item options are appropriate for measuring a particular trait or symptom, and (c) how well individual items or subscales are connected to the underlying construct and discrimi-nate among individual differences in symptom severity (see Santor and Ramsay [14] for an overview).
IRT can be used to select the most useful items for a shortened scale, and to develop a scoring algorithm that predicts the total score on the full scale [15,16]. Alterna-tively, previous IRT analysis of the PANSS [8] identified some items that might be further improved for measur-ing individual severity differences. The analyses showed that 18 of the 30 PANSS items performed well and iden-tified key areas for improvement in items and options within specific subscales. These findings [8] also suggest that the Positive and Negative Symptoms subscales were more sensitive to change than the overall PANSS total score and, thus, may constitute a “Mini-PANSS”that may be more reliable, require shorter time to administer, and possibly reduce sample sizes needed for future research. Additionally, a more recent IRT by Levine and colleagues [17] showed that the PANSS item ratings dis-criminated symptom severity best for the negative symp-toms, have an excess of“Severe”and“Extremely severe”
rating options, and assessments are more reliable at med-ium than very low or high levels of symptom severity.
The present study used IRT to evaluate the PANSS for use in assessing psychopathology in schizophrenia by (a) examining and characterizing the performance of individual items from the PANSS at both the option (severity) and item (symptom) levels and identified areas for improvement of the PANSS scale, by (b) examining the ability of the three PANSS subscales to discriminate among individual difference in illness severity, by (c) selecting the best performing items to be included in a briefer version of the PANSS and by (d) constructing scoring algorithms using a summed score linking techni-que to directly compare results obtained with the shor-tened scale to those of the original PANSS scale.
Methods Data
Data was provided for 7,348 patients who met DSM-IV criteria for schizophrenia or schizoaffective disorder, who were enrolled between 1995 and 2005 in one of 16 randomized, double-blind clinical trials comparing ris-peridone, risperidone depot or paliperidone to other antipsychotic drugs (e.g., haloperidol, olanzapine) or pla-cebo. All studies were carried out in accordance with the latest version of the Declaration of Helsinki. Study procedures were reviewed by the respective ethics com-mittees and informed consent obtained after the proce-dures was fully explained.
Data analysis included baseline PANSS item scores from 7,187 patients. Table 1 shows the total of number of patients who were removed from the analyses due to diagnoses (other than schizophrenia or schizoaffective disorder (0.04% - 1.09%)) and missing PANSS item scores (0.03%); the mean age, the gender and mean PANSS total score of patients who were removed from each diagnoses group is also presented. The low number of patients excluded assures that analyses would not be compromised by excluding these patients.
Data source
Model Choice
Several key factors are involved in determining which model to use: (1) the number of item response cate-gories, (2) the construct being measured, (3) the purpose of the study and, (4) the sample size [18]. Additionally, the nature of the construct being measured will affect the choice of the model.
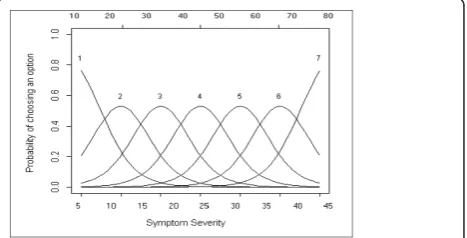
To investigate the usefulness of each item, the rela-tionship between scores assigned to an item (i.e., the score ‘’option’’ chosen for a given patient at a given point in time, such as 1to 7) and the overall severity of the illness (total subscale score) was assessed. For each item a set of Option Characteristic Curves (OCCs) is generated in which the probability of choosing a parti-cular response is plotted against the range of psycho-pathology severity. OCCs are graphical representations of the probability of rating the different options for a given item across the range of severity. Using OCCs, the behaviour of particular items across a range of severity can be determined. If the probability of rating an option changes as a function of psychopathological severity, the option is useful; that is, it discriminates differences in illness severity. To illustrate, Figure 1 depicts a hypothe-tical “ideal” item from an item response perspective, which is characterized by a clear identification of the range of severity scores over which an option is most likely to be rated by a clinician (e.g., Figure 1 shows, option 1 is most likely to be rated from a score of 7 to a score of 20 on the Positive or Negative Symptoms sub-scale), rapid changes in the curves that correspond to changes in severity, and an orderly relationship between the weight assigned to the option and the region of severity over which an item is likely to be rated. An OCC, therefore, provides a graphical representation of how informative an item (or symptom) is as an indicator of the illness that is being measured, by expressing the
probability of a particular option being rated by a clini-cian, at different levels of severity.
For the dataset used in this analysis, the total Positive and Negative Subscale scores ranged from 7 to 45 and the General Psychopathology subscale score ranged from 16 to 80. OCCs were generated in TestGraf [19].
Nonparametric IRT models [[20,21] and [22]] provide a broad-spectrum and flexible data analysis framework for investigating a set of polytomously scored items and determining ordinal scales for measurement that include items that have changeable locations and sufficient dis-crimination power [23].
[image:4.595.57.538.100.266.2]IRT models are appropriate for the analysis of ques-tionnaire data with multiple items [23] such as the PANSS. The data are discrete scores characterizing the ratings of Npatients to J items (items are keyed j; j= 1,...J). Many measurement instruments, like the PANSS, use items that have three or more ordered answer
Table 1 Data Removed from Final Dataset (n = 7,348)
Reason for Removal Number of cases removed
Percent of cases removed
Mean age (years)
Gender Mean PANSS total
score
Depressive Disorder 80 1.09% 26.87 (9.37) Male (48.75%)
Female (51.25%)
68.76 (17.96)
Bipolar Disorder 76 1.03% 25.05 (10.00) Male (53.95%)
Female (46.05%)
67.39 (16.17)
No Diagnoses provided 3 0.04% Data unavailable Male (66.67%)
Female (33.33%)
79.00 (28.00)
PANSS Item Score missing
2 0.03% Data
Unavailable
Male (100.00%) 28.00 (1.41)
Total 161 2.19% 25.97 (9.57) Male (52.17%)
Female (47.83%)
68.30 (17.52)*
Note. N = 7,348; *n = 159, does not include two patients with missing PANSS item scores.
Note: The OCC shows the probability (y-axis) of selecting a particular option for the item at different levels of the trait (y-axis) for Positive and Negative subscales (total scores 7 to 49) and for General Psychopathology subscale (total scores 16 to 112). For the dataset used in this analysis, the total Positive and Negative Subscale scores ranged from 7 to 45 and the General Psychopathology subscale score ranged from 16 to 80. OCC generated in TestGraf (Ramsay, 2000).
[image:4.595.306.540.535.654.2]categories characterized by three or more ordered scores, also called polytomous item scores.
Nonparametric IRT
A nonparametric Kernel Smoothing approach [24] to modelling responses for the PANSS would allow for no a priori expectation about the form of rating distribu-tions, and items with nonmonotonic item response functions can be identified. Parametric and nonpara-metric approaches often lead to similar item selection [25]. Using a nonparametric approach, an ICC can be constructed that relate the likelihood of rating scores on each item to latent scores of psychopathology prior to examining the performance of individual options, and OCCs relate the likelihood of rating each option on each item to latent levels of psychopathology. Items’ OCCs and ICCs can then be examined, and items with
weak discrimination can be identified and can be con-sidered for further item revision, or dropped from further analysis.
Approaches Used to Shorten Scales
Statistical methodologies used to shorten scales include simple correlations and adjusted correlations between long and short forms, Cronbach’saper dimension, item total correlation and item remainder correlation for item and composite scores, and factor analysis (see Coste et al [26] for review of methods used to shorten scales). A lim-itation of all these approaches is that the scores on the shortened scales are not comparable to the scores from the original scales, because they are not on the same metric.
Linking
Linking is a general term that refers to both equating and calibration. Whereas the requirements for equating are stringent, calibrating two assessments of different lengths is less so, and can easily be achieved using an IRT approach [27]. IRT is said to have a built-in linking mechanism [10]. Once item parameters are estimated for a population with an IRT model, one can calculate com-parable scores on a given construct for patients from that population who were not rated on the same items, without intermediate equating steps. Previous examples of linking have been done with the PANSS supporting the extrapola-tion between PANSS and global clinical improvement and severity measures [28].
Instruments
Positive and Negative Symptoms Scale
The PANSS [1] is a 30-item rating instrument evaluating the presence/absence and severity of Positive, Negative and General Psychopathology of Schizophrenia. All 30 items are rated on a 7-point scale (1 = absent; 7 = extreme). There are 3 subscales of the PANSS, the Positive Symptom subscale, the Negative Symptom subscale and the General Psychopathology subscale. The PANSS was
developed with a comprehensive anchor system to improve the reliability of ratings. The 30 items are arranged as seven Positive subscale items (P1 - P7), seven Negative subscale items (N1 - N7), and 16 General Psy-chopathology items (G1 - G16). Each item has a definition and a basis for rating.
Rater Training
For the data being presented in this study, each PANSS rater, was required to obtain rater certification through Ortho-McNeil Janssen Pharmaceuticals, Incorporated, and to achieve interrater reliability with an intraclass cor-relation coefficient (95%CI) = 0.80 with the“Expert con-sensus PANSS”scores.
TestGraf
TestGraf software [19,24] was developed to estimate para-meters in IRT [29]. TestGraf was used to estimate OCCs for nonparametric (Gaussian) smoothing kernels. This is a program for data analysis from tests, scales and question-naires. In particular, it displays the performance of items and options within items, as well as other test diagnostics and utilizes nonparametric IRT techniques. Additionally, TestGraf provides a graphical analysis of test items and/or rated responses using Ramsay’s “kernel smoothing” approach to IRT. The software, manual, and documenta-tion are available from http://www.psych.mcgill.ca/faculty/ ramsay/TestGraf.html[19].
Procedure
TestGraf was used to fit the model. The highest expected total score produced by TestGraf is 45 for the Negative subscale, 40 for the Positive subscale. The General Psycho-pathology subscale had the highest expected total score of 80, at which the values of the OCCs were estimated. The estimation of the OCCs of the expected total score of the three PANSS subscales was made using a nonparametric (Gaussian) kernel smoothing technique [19,24] illustrated above. Examination of an item’s OCC is expected to show how each response option contributed differently to the performance of that item [30]. The Item Characteristic Curves (ICCs) provides a graphical illustration of the expected score on a particular PANSS item as a function of overall psychopathology severity. ICCs were calculated in a similar manner as described above for OCCs. Items were characterized as“Very Good”, “Good”, or“Weak“
based on the criteria presented in Table 2.
Operational Criteria for Item Selection
Using the ideal item illustrated in Figure 1, and follow-ing Santor and colleagues [8] operational criteria for item selection (numbers one to three presented below), items were judged on five criteria (see Table 2).
Statistical Analyses
(n = 3593) and the Validation subsample (n = 3594). All data were generated for this random sampling using SAS®9.3.1 [31]. The Evaluation subsample and the Vali-dation subsample were compared for similarities using t-tests for continuous variables and Chi-Square t-tests for categorical variables. The Evaluation subsample was used for the initial 30-item IRT.
A Principal Components Analysis (PCA) without rota-tion was conducted to assess unidimensionality as follows. A PCA without rotation was used as in general, an
[image:6.595.62.541.101.568.2]unrotated PCA is the best single summarizer of the linear relationship among all the variables, since rotated loadings may reflect an arbitrary decision to maximize some vari-ables on a component while dramatically reducing others [32].: (1) a PCA was conducted on the seven Positive Symptom items, (2) the eigenvalues for the first and sec-ond component produced by the PCA were compared, (3) if the first eigenvalue is about three times larger than the second one, dimensionality was assumed. Suitability of the data for factor analysis was tested by Bartlett’s Test of
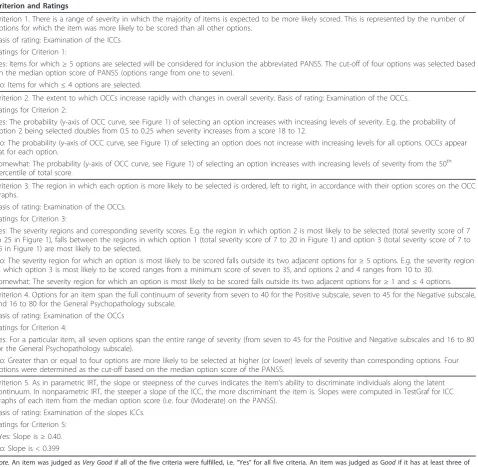
Table 2 Operational Criteria for Item Selection
Criterion and Ratings
Criterion 1. There is a range of severity in which the majority of items is expected to be more likely scored. This is represented by the number of options for which the item was more likely to be scored than all other options.
Basis of rating: Examination of the ICCs Ratings for Criterion 1:
Yes: Items for which≥5 options are selected will be considered for inclusion the abbreviated PANSS. The cut-off of four options was selected based on the median option score of PANSS (options range from one to seven).
No: Items for which≤4 options are selected.
Criterion 2. The extent to which OCCs increase rapidly with changes in overall severity. Basis of rating: Examination of the OCCs. Ratings for Criterion 2:
Yes: The probability (y-axis of OCC curve, see Figure 1) of selecting an option increases with increasing levels of severity. E.g. the probability of option 2 being selected doubles from 0.5 to 0.25 when severity increases from a score 18 to 12.
No: The probability (y-axis of OCC curve, see Figure 1) of selecting an option does not increase with increasing levels for all options. OCCs appear flat for each option.
Somewhat: The probability (y-axis of OCC curve, see Figure 1) of selecting an option increases with increasing levels of severity from the 50th
percentile of total score.
Criterion 3. The region in which each option is more likely to be selected is ordered, left to right, in accordance with their option scores on the OCC graphs.
Basis of rating: Examination of the OCCs. Ratings for Criterion 3:
Yes: The severity regions and corresponding severity scores. E.g. the region in which option 2 is most likely to be selected (total severity score of 7 to 25 in Figure 1), falls between the regions in which option 1 (total severity score of 7 to 20 in Figure 1) and option 3 (total severity score of 7 to 35 in Figure 1) are most likely to be selected.
No: The severity region for which an option is most likely to be scored falls outside its two adjacent options for≥5 options. E.g. the severity region in which option 3 is most likely to be scored ranges from a minimum score of seven to 35, and options 2 and 4 ranges from 10 to 30.
Somewhat: The severity region for which an option is most likely to be scored falls outside its two adjacent options for≥1 and≤4 options.
Criterion 4. Options for an item span the full continuum of severity from seven to 40 for the Positive subscale, seven to 45 for the Negative subscale, and 16 to 80 for the General Psychopathology subscale.
Basis of rating: Examination of the OCCs Ratings for Criterion 4:
Yes: For a particular item, all seven options span the entire range of severity (from seven to 45 for the Positive and Negative subscales and 16 to 80 for the General Psychopathology subscale).
No: Greater than or equal to four options are more likely to be selected at higher (or lower) levels of severity than corresponding options. Four options were determined as the cut-off based on the median option score of the PANSS.
Criterion 5. As in parametric IRT, the slope or steepness of the curves indicates the item’s ability to discriminate individuals along the latent continuum. In nonparametric IRT, the steeper a slope of the ICC, the more discriminant the item is. Slopes were computed in TestGraf for ICC graphs of each item from the median option score (i.e. four (Moderate) on the PANSS).
Basis of rating: Examination of the slopes ICCs. Ratings for Criterion 5:
SYes: Slope is≥0.40. No: Slope is < 0.399
Sphericity [33] which should be significant, and the Kaiser-Meyer-Olkin (KMO) measure of sampling adequacy, which should be >0.6 [34,35].
Second, the criteria presented in Table 2 were exam-ined. OCCs were used to examine Criteria 2, 3, and 4 presented in Table 2. For example, for Criteria 4, the options for an item are expected to span the full conti-nuum of severity. Some options are expected to only be scored at high levels of severity (e.g., item G6 (Depres-sion): options 6 and 7), whereas others are expected to be scored at low levels of severity (e.g., options 1 and 2). If the majority of options on an item are scored at only low levels of severity or only high levels of severity, that item was described asWeak. These items are considered
Weakbecause they are difficult to score or do not con-tribute to the overall outcome and largely insensitive to individual differences in the lower or moderate range of symptom severity and produce floor effects. Scales com-prised primarily ofWeakitems are also largely insensi-tive to individual differences in the high range of symptom severity and produce ceiling effects. Additional description of item selection is presented in Table 2.
Third, to confirm that most PANSS items are either
Very Good or Good at assessing the overall severity,
TestGraf program was used to produce the ICCs. The ICCs provided a graphical illustration of the expected total subscale score on a particular PANSS item as a function of overall psychopathology. ICCs were exam-ined to assess Criteria 1 and 5 in Table 2. Finally, as in parametric IRT models, the slope or steepness of the curves indicate the item’s ability to discriminate indivi-duals along the latent continuum. Steeply increasing curves will indicate that the likelihood of higher item scores increases in close relation to increasing levels of psychopathology (Very Goodor Good discrimination). Relatively flat curves or curves that do not show a con-sistent increasing linear trend indicate that the likeli-hood of higher item scores does not increase consistently as the level of psychopathology increases (Weak discrimination). The slope of the ICC was used to assess Criteria 5 presented in Table 2.
In nonparametric IRT, the steeper a slope, the more discriminant the item is. However, there are no specific statistical criteria to determine whether a slope is signifi-cantly steeper than another. The selection of a slope of 0.40 would allow for greater discrimination among items. In addition to the slopes, an item biserial correla-tion of items to expected total subscale scores was also produced for each item of the PANSS. TestGraf soft-ware produces slopes and item biserial correlations. It is expected that most items (i.e., > 60%) obtain a rating of
Very Good or Good after examination of the OCCs,
ICCs and item slopes for the operational criteria pre-sented in Table 2.
Three graphs were used to determine the sensitivity to change for each subscale: (1) the average item informa-tion funcinforma-tion graph, (2) the probability density funcinforma-tion graph, and (3) the estimated standard error graph.
The average item information function was used to determine the amount of information in the test about severity, denoted byI(θ) This is produced in TestGraf and is a sum of item information functions [18,24].
A plot of the probability density function indicating the relative probability that various scores will occur was plotted to assess the score distribution of each sub-scale. The probability density function specifies how probable scores are by the height of the function, and the best-known example of a density function is the famous normal density, the“bell” curve.
Finally, for assessment of subscale performance, one of the most important applications ofI(θ)was to estimate the standard error of an efficient estimate of θ, an effi-cient estimate being one which makes best use of the information in the PANSS subscales. also produced by TestGraf [18,24].
Mini-PANSS
Using the IRT based methodology, an abbreviated ver-sion of the PANSS was created and scores were linked from the Mini-PANSS to the 30-item PANSS using an IRT summed score approach [16] and linear interpola-tion. Obtaining an IRT score, θ, corresponding to a summed score, rather than to a particular pattern of responses, requires finding the average of a posterior distribution.
Before linking the two scales, the unidimensionality of the Mini-PANSS was assessed using PCA without rota-tion, similar to the PCA conducted for the 30-item PANSS. Additionally, using the Validation subsample, Pearson correlation coefficients between total subscale scores on the 30-item scale and total subscale scores on the Mini- PANSS were computed. If the relationship between items (the item with item correlation is expected to be 1.0 as the items are rated by the same rater on the same patients) and subscales of the two instruments produce significant correlations (as identi-fied byp≤0.001) given the overlap of items, this would suggest that the 30-item scale measures psychopathol-ogy similarly to the Mini-PANSS scale. A Cronbacha≥ 0.80 for each subscale and the total scale, are expected to show similarities between the PANSS and the Mini-PANSS.
the three subscales and total score, and that the differ-ences in the 30-Item PANSS and interpolated scores on the Mini-PANSS have a small range of differences (≤ 5 points) with a mean error differences≤1.
Results
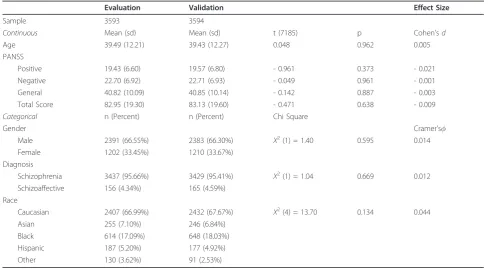
Subsample Comparison
Comparison of the two sub-samples (Evaluation and Validation sample) by t-test for continuous variables and Chi-Square test,c2for categorical variables across a range of characteristics, revealed no significant differ-ences (Table 3).
Assessment of Unidimensionality
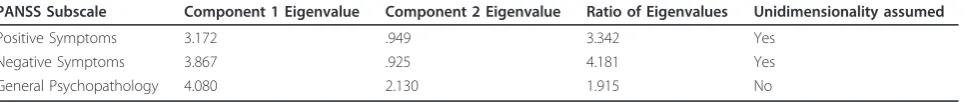
PCA without rotation revealed one component with an eigenvalue greater than one for the Positive Symptoms subscale, one component with an eigenvalue greater than one for the Negative Symptoms subscale and four components with an eigenvalue greater than one for the General Psychopathology subscale. Bartlett’s Test of Sphericity was significant (p< .001) for all three sub-scales and the Kaiser-Meyer-Olkin (KMO) measure of sampling adequacy produced values of 0.789, 0.875, and 0.817 for the Positive, Negative and General Psycho-pathology subscales, respectively. Using the criteria to assess unidimensionality the Positive and Negative Symptoms subscales indicate unidimensionality while the General Psychopathology subscale shows an
eigenvalue on the second component of only 1.915 times larger than the first component (see Table 4).
Positive Symptoms Subscale
Examining Option Characteristic Curves
Figure 2 shows OCCs for items of the Positive Symptom subscale. The OCC for option 1 (absent) was less likely to be rated than other options for patients with higher severity scores. Option 7 (extreme) was rated infre-quently, and the range of discrimination typically was above the 95th percentile (see Figure 2) indicating option 7 is most often rated for higher levels of severity. OCCs illustrated in Figure 2 were used to rate Criteria 2, 3, and 4 presented in Table 2.
For Criterion 2, the extent to which OCCs increase rapidly with change in overall severity was rated“Yes,”
“No”or “Somewhat”based on the probability (y-axis of Figure 2) of each option increasing as a function of overall severity. For items, P1, P3 and P4 the probability of rating options 1 to 7 increased as severity (x-axis: expected total score) increased and was rated as “Yes” for Criteria 2. Items P2, P5 and P6 show the probability of ratings from options 1 to 7 to increase rapidly pri-marily after the 50thpercentile of expected total score (i.e., an expected total score of 20), and were rated as
[image:8.595.54.543.454.723.2]“Somewhat” for Criterion 2. In the case of P7 the OCCs are flatter, even after the 50th percentile. Therefore, based on Criterion 2 and examination of the OCCs, P7
Table 3 Comparison of Evaluation and Validation Subsample Characteristics
Evaluation Validation Effect Size
Sample 3593 3594
Continuous Mean (sd) Mean (sd) t (7185) p Cohen’sd
Age 39.49 (12.21) 39.43 (12.27) 0.048 0.962 0.005
PANSS
Positive 19.43 (6.60) 19.57 (6.80) - 0.961 0.373 - 0.021
Negative 22.70 (6.92) 22.71 (6.93) - 0.049 0.961 - 0.001
General 40.82 (10.09) 40.85 (10.14) - 0.142 0.887 - 0.003
Total Score 82.95 (19.30) 83.13 (19.60) - 0.471 0.638 - 0.009
Categorical n (Percent) n (Percent) Chi Square
Gender Cramer’s
Male 2391 (66.55%) 2383 (66.30%) Χ2(1) = 1.40 0.595 0.014
Female 1202 (33.45%) 1210 (33.67%)
Diagnosis
Schizophrenia 3437 (95.66%) 3429 (95.41%) Χ2(1) = 1.04 0.669 0.012
Schizoaffective 156 (4.34%) 165 (4.59%)
Race
Caucasian 2407 (66.99%) 2432 (67.67%) Χ2(4) = 13.70 0.134 0.044
Asian 255 (7.10%) 246 (6.84%)
Black 614 (17.09%) 648 (18.03%)
Hispanic 187 (5.20%) 177 (4.92%)
Other 130 (3.62%) 91 (2.53%)
(Hostility) does not increase rapidly with changes in overall severity, and was rated“No.”
For Criterion 3, the severity region in which each option is more likely to be rated is ordered from left to right; the region in which option 2 is most likely to be scored should be between the regions in which option 1 and option 3 were scored. For P1, P2, P3, P4 and P6, option 2 always falls between the regions of options 1 and option 3. Additionally, option 3 falls between options 2 and 4, and option 4 falls between options 3 and 5. OCCs for P5 and P7 were rated as“Somewhat”on Criter-ion 3, as a visual examinatCriter-ion of the curve shows that for P5, option 2 does not fall between options 1 and 3, and falls outside the curve of option 3 for lower severity
scores. For P7, option 2 (expected total score of 7 to 37) does not fall between the regions in which option 1 (expected total score of 7 to 35) and option 3 (expected total score of 7 to 35) were scored, thereby being rated
“Somewhat.”
Based on Criteria 4, the options should span the full continuum of severity from expected total scores of seven to 40 for the Positive Symptoms subscale. An examination of the x-axis for expected total score shows all items were rated from a minimum total score of seven to the maxi-mum total score for the Positive Symptoms subscale, and were rated as“Yes”for Criterion 4.
From examination of Figure 2 in comparison to the ideal item presented in Figure 1, it can be observed that items P1, P3, P4 and P6 most closely resemble the ideal item. Examination of the ICCs was combined with the results obtained for the OCCs to determine item selec-tions for inclusion into the Mini-PANSS.
Examining Item Characteristic Curves (ICC)
For Criterion 1, items for which ≥5 options are scored would be rated “Yes.” For items P1, P3 and P5 of the Positive Symptoms subscale, at least six options were selected (see y-axis to the highest point on the ICC). For example, for item P1, P3 and P5, the average item score climbs consistently as the total subscale score increases, approaching a maximum value of six out of the seven options. For P2, P4, P6 and P7, at least five options were selected. Therefore, for Criterion 1, a rat-ing of “Yes” was given for all items. The cross-hatching or bars on the ICC indicates an estimated 95% confi-dence region for the true curve.
[image:9.595.59.543.101.152.2]Criterion 5 of the operational criteria for item selec-tion was identified in TestGraf by computing the slopes for each item from the median option choice of the PANSS (i.e. option 4). For further examination, items of the Positive Symptom subscale were ranked according to their numeric slope; the item with the largest slope was ranked Number 1, the item with the second largest slope was ranked Number 2, and so on. This rank ordering procedure was applied within the Evaluation subsample. For example, as shown in Table 5, item P3 was ranked first. Therefore, the item that was the most effective in discriminating individuals on the PANSS positive subscale was item P3, representing perceptions which are not generated by external stimuli. The last
Table 4 Eigenvalues of PANSS subscale (without rotation)
PANSS Subscale Component 1 Eigenvalue Component 2 Eigenvalue Ratio of Eigenvalues Unidimensionality assumed
Positive Symptoms 3.172 .949 3.342 Yes
Negative Symptoms 3.867 .925 4.181 Yes
General Psychopathology 4.080 2.130 1.915 No
Note. Ratio of Eigenvalues is computed by dividing the eigenvalue for the first component by the eigenvalue for the second component for each subscale. Unidimensionality assumed is based on the eigenvalue of Component 1 being at least three times larger than the eigenvalue for Component 2.
[image:9.595.57.291.387.697.2]step in evaluating Criterion 5 was to determine the number of items for which the slope was≥0.40. Slopes for P1 to P6 of the PANSS Positive Symptoms subscale were ≥ 0.40 and were rated “Yes” (see Table 5 for slopes).
Table 5 also includes the biserial correlation for each item, or the correlation between a patient’s score on an item (option 1 to option 7) and his or her expected total score on Positive Symptoms subscale. Although examination of the item biserial correlation is explora-tory and not part of the operational criteria for item selection, the item biserial correlations show that item P7 has the lowest correlation compared to the other items of the Positive Symptoms subscale. The biserial correlations for the PANSS items ranged from 0.553 for item P7 to 0.760 for item P3.
Item Selection
Global ratings of Very Good, Good and Weak, along with ratings of each of the five criteria for the seven items of the Positive Symptoms subscale are presented in Table 6 and were summarized above. Criterion 1 and
5 were based on examination of the ICCs presented in Figure 3. Criterion 2 to Criteria 4 was based on exami-nation of the OCCs presented in Figure 2.
Negative Symptoms Subscale
Examining Option Characteristic Curves
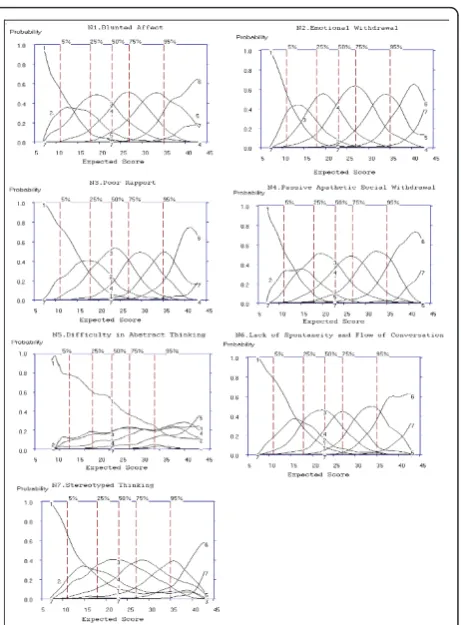
Figure 4 shows OCCs for items on the Negative Symp-tom subscale. Option 7 (extreme) was used infrequently; the range of discrimination was above the 95th percen-tile for all items, and only rated 0.1% of the time for N5 Difficulty in Abstract Thinking (Figure 4).
For Criterion 2, the extent to which OCCs increase rapidly with change in overall severity was rated“Yes,”
“No”or “Somewhat”based on the probability (y-axis of Figure 4) of each option increasing as a function of overall severity. For items, N1, N2, N3, N4, N6 and N7 the probability of rating options 1 to 7 increased as severity (x-axis: expected total score) increased and was rated as “Yes” for Criteria 2. In the case of N5 the OCCs are flatter, even after the 50thpercentile. There-fore, based on Criterion 2, N5 does not increase rapidly with changes in overall severity, and was rated“No.”
For Criterion 3, the severity region in which each option is more likely to be rated is ordered from left to right; the region in which option 2 is most likely to be scored should be between the regions in which option 1 and option 3 were scored. For N1, N2, N3, N4, N6 and N7, option 2 always falls between the regions of options 1 and option 3, thereby attaining a rating of “Yes” for Criteria 3. Options for N5 were rated as“No” on Criter-ion 3, as a visual examinatCriter-ion of the curve shows that for N5, option 2 does not fall between options 1 and 3, and follows the same pattern as option 3 from the 25th percentile of the expected total score.
[image:10.595.57.291.110.247.2]Based on Criteria 4, the options should span the full continuum of severity from expected total scores of seven to 45 for the Negative Symptoms subscale. An examination of the x-axis for expected total score shows that N1, N2, N3, N4, N5 and N7 were scored from a minimum total score of seven to the maximum total
Table 5 Slopes and Item Biserial Correlation for Each Item of the PANSS
Items Slopes Rank of
Slopes
Item biserial correlation
P3. Hallucinatory behaviour
0.510 1 0.760
P5. Grandiosity 0.495 2 0.673
P1. Delusions 0.495 3 0.686
P4. Excitement 0.467 4 0.617
P2. Conceptual Disorganization
0.455 5 0.670
P6. Suspiciousness/ Persecution
0.410 6 0.650
P7. Hostility 0.382 7 0.553
Note. Slopes were extracted from TestGraf output and were rounded to three decimal
places. Similarities in the values of slopes are due to rounding (e.g. slope of P1 is
[image:10.595.56.539.595.722.2]0.495090, slope of P5 is 0.495447).
Table 6 Discrimination of the Positive Symptoms Items
Criterion 1 2 3 4 5 Rating
P1. Delusions 6 (Yes) Yes Yes Yes Yes Very Good
P2. Conceptual Disorganization
5 (Yes) Somewhat Yes Yes Yes Very Good
P3. Hallucinatory Behaviour
6 (Yes) Yes Yes Yes Yes Very good
P4. Excitement 5 (Yes) Yes Yes Yes Yes Very Good
P5. Grandiosity 6 (Yes) Somewhat Somewhat Yes Yes Good
P6. Suspiciousness/ Persecution
5 (Yes) Somewhat Yes Yes Yes Very Good
P7. Hostility 5 (Yes) No Somewhat Yes No Weak
score for the Negative Symptoms subscale, and were rated as“Yes” for Criterion 4. An examination of the x-axis for the expected total score of N5 shows scoring started from a minimum expected total score of 10 and options 6 and 7 were only scored from an expected total score of 27 to 38. Additionally, Figure 4 shows that the probability of the OCC for item N5 is≤ 0.3 for all options regardless of the level of severity.
Examining Item Characteristic Curves (ICC)
For Criterion 1, items for which ≥5 options are scored would be rated “Yes.” For all items of the Negative Symptoms subscale, at least six options were selected (see y-axis to the highest point on the ICC). For exam-ple, for item N1, the average item score climbs consis-tently as the total subscale score increases, approaching a maximum value of six out of the seven options. Simi-lar results are observed for all items of the Negative Symptoms subscale. Criterion 5 of the operational cri-teria for item selection was identified in TestGraf by computing the slopes for each item from the median option choice of the PANSS (i.e. option 4). For further examination, items of the Negative Symptom subscale were ranked according to their numeric slope; the item
with the largest slope was ranked Number 1, the item with the second largest slope was ranked Number 2, and so on. The most effective in discriminating indivi-duals on the PANSS was item N6, representing a reduc-tion in normal flow of communicareduc-tion. The last step was to determine the number of items for which the slope was ≥ 0.40. Slopes for N1 to N6 of the PANSS Negative Symptoms subscale were ≥ 0.40 and were rated“Yes.”Table 7 also includes the biserial correlation for each item and his or her expected total score on Negative Symptoms subscale. The item biserial correla-tions show the lowest correlacorrela-tions for item N5 (r = 0.599) and N7 (r= 0.596) compared to the other items of the Negative Symptoms subscale. The biserial correla-tions for the PANSS items ranged from 0.809 for item N2 to 0.596 for item N7.
Item Selection
[image:11.595.309.540.86.399.2]Global ratings of Very Good, Good and Weak items, along with ratings of each of the five criteria for the 7 items of the Negative Symptoms subscale were sum-marized above. Criterion 1 and 5 were based on exami-nation of the ICCs presented in Figure 5. Criterion 2 to Criteria 4 was based on examination of the OCCs presented in Figure 4. Criterion 5 was based on
Figure 4Option Characteristic Curves (OCCs) for all 7 Negative Subscale Items of the PANSS.
[image:11.595.56.289.88.404.2]examination of slopes (see Table 8 for item selections for the Negative Symptoms subscale).
General Psychopathology Subscale Examining Option Characteristic Curves
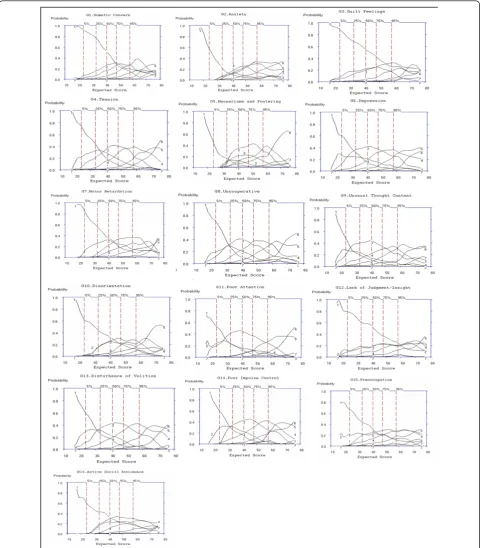
As observed with the Positive and Negative Symptoms subscales, the OCC for option 1 (absent) also were less likely to be rated than were other for patients with higher severity scores. Option 7 (extreme) was used
infrequently; the range of discrimination was above the 95th percentile for all items.
For Criterion 2, the extent to which OCCs increase rapidly with change in overall severity was rated“Yes,”
[image:12.595.57.539.99.209.2]“No”or “Somewhat”based on the probability (y-axis of Figure 6) of each option increasing as a function of overall severity. For items, G4, G6, G7, G8, G9, G13 and G14 the probability of rating options 1 to 7 increased as severity (x-axis: expected total score) increased and was rated as “Yes”for Criteria 2. In the case of G1, G2, G3, G11, G12, G15 and G16, the OCCs are flatter, with G1, G2, and G3 showing increases only after the 75th per-centile. Therefore, based on Criterion 2, G1, G2, G3, G11, G12, G15 and G16, does not increase rapidly with changes in overall severity, and was rated“No” for these items. A rating of“Somewhat”was given to G5 and G10 as these items show an increase in OCCs after the 50th percentile. For example, an examination of item G12 shows that for options 1 to 7, the probability is≤0.3 for the entire severity range, indicating this item does not discriminate between different levels of symptom sever-ity. Similar probabilities (≤ 0.3 for across levels of sever-ity) are seen for items G3, G15 and to a lesser extent G16.
Table 7 Slopes, Item Biserial Correlation for the Negative Symptoms subscale
Items Slopes Rank of Slopes Item biserial correlation
N6. Lack of spontaneity and Flow of conversation 0.461 1 0.796
N1. Blunted Affect 0.447 2 0.771
N2. Emotional Withdrawal 0.447 3 0.809
N4. Passive Apathetic Social Withdrawal
0.447 4 0.773
N3. Poor Rapport 0.401 5 0.796
N5. Difficulty in Abstract Thinking 0.401 6 0.599
N7. Stereotyped Thinking 0.372 7 0.596
Note. Slopes were extracted from TestGraf output and were rounded to three decimal places. Similarities in the values of slopes are due to rounding (e.g. slope of N1 is
[image:12.595.57.291.391.698.2]0.447427, slope of N2 is 0.447313, slope of N4 is 0.447182, slope of N3 is 0.400801, and slope for N5 is 0.400560).
[image:12.595.305.538.582.722.2]Figure 5Item Characteristic Curves (ICCs) for all 7 Items of the Negative Subscale of the PANSS.
Table 8 Discrimination of the PANSS Negative Symptoms Items
Criterion 1 2 3 4 5 Rating
Negative Symptoms
N1. Blunted Affect 6 (Yes) Yes Yes Yes Yes Very Good N2. Emotional Withdrawal 6 (Yes) Yes Yes Yes Yes Very Good N3. Poor Rapport 6 (Yes) Yes Yes Yes Yes Very Good N4. Passive Apathetic Social
Withdrawal
6 (Yes) Yes Yes Yes Yes Very Good
N5. Difficulty in Abstract Thinking
6 (Yes) No No No Yes Weak
N6. Lack of spontaneity/ Flow of conversation
6 (Yes) Yes Yes Yes Yes Very Good
N7. Stereotyped Thinking 6 (Yes) Yes Yes Yes No Very Good
For Criterion 3, the severity region in which each option is more likely to rated is ordered from left to right; the region in which option 2 is most likely to be scored should be between the regions in which option 1
and option 3 were scored. For G4, G6, G7, G8, G9, and G13, option 2 always falls between the regions of options 1 and option 3, thereby obtaining a rating of
[image:13.595.58.539.89.638.2]“Yes”for Criteria 3. Options for G3, G5, G10, G12, G15
and G16 were rated as “No”on Criterion 3, as a visual examination of the curve shows that for these items, option 2 does not fall between options 1 and 3, and in some cases (e.g. G10 and G12) follows the same pattern as option 3 from the 25th percentile of the expected total score. OCCs for G1, G2, G11 and G14 were rated as“Somewhat” on Criterion 3, as a visual examination of the curve shows that for these items, option 2 does not fall between options 1 and 3, and falls outside the curve of option 3 for higher severity scores, however, for at least four other options, the severity region is ordered left to right, thereby being rated“Somewhat.”
Based on Criteria 4, the options should span the full continuum of severity from expected total scores of 16 to 80 for the General Psychopathology subscale. An examination of the x-axis for expected total score shows that G4, G6, G8, G9, G10, G12, G13, G14, and G15 were scored from a minimum total score of 16 to the maximum total score for the General Psychopathology subscale, and were therefore rated as“Yes”for Criterion 4. An examination of the x-axis for the expected total score of G1, G2, G3, G5, G7, G11 and G16, shows scor-ing started from a minimum expected total score of 20 and for G3, options 4 to 7 were only scored from an expected total score of 36 to 76. For example, OCCs for Items G2, G5, and G16 do not span the continuum of possible total scores as scoring options 2 to 7 begin between the 5th to 25th percentiles. As a result, these items were rated“No” for Criterion 4. Results indicate that these items are only rated at higher levels of sever-ity. It should be noted that seven out of the 16 General Psychopathology subscale items (43.75%) rated“Yes”on Criterion 2 (i.e., G4, G6, G7, G8, G9, G13 and G14), six out of the 16 subscale items (37.50%) rated “Yes” on Criterion 3 (i.e., G4, G6, G7, G8, G9, and G13), and nine out of the 16 subscale items (56.25%) rated “Yes” on Criterion 4 (i.e., G4, G6, G8, G9, G10, G12, G13, G14, and G15) based on examination of the OCCs.
Examining Item Characteristic Curves
For Criterion 1, items for which≥5 options are scored would be rated“Yes.”For items G2, G4, G6, G7, G8, G9, G10, G14, and G15 of the General Psychopathology sub-scale,≥5 options were selected (see y-axis to the highest point on the ICC, Figure 7); a rating of“Yes”was given for these items. Criterion 5 of the operational criteria for item selection identified nine items with slopes < 0.399; these items included G1, G7, G10, G3, G11, G15, G16, G5 and G12 in order of ranking of slopes and were rated
“No”for Criterion 5. The item that was the most effective in discriminating individuals on the PANSS General Psy-chopathology was item G2, representing physical mani-festations of nervousness, worry, apprehension or restlessness. The item least effective in discriminating individuals on the PANSS General Psychopathology
subscale is G12, representing impaired understanding of one’s psychiatric condition or illness (see Table 9 for slopes).
Table 9 shows item biserial correlations with the low-est correlations for item G16 (r = 0.366) and G12 (r = 0.381) compared to the other items of the General Psy-chopathology subscale. The largest biserial correlations was for item G8 (r= 0.617).
Item Selection
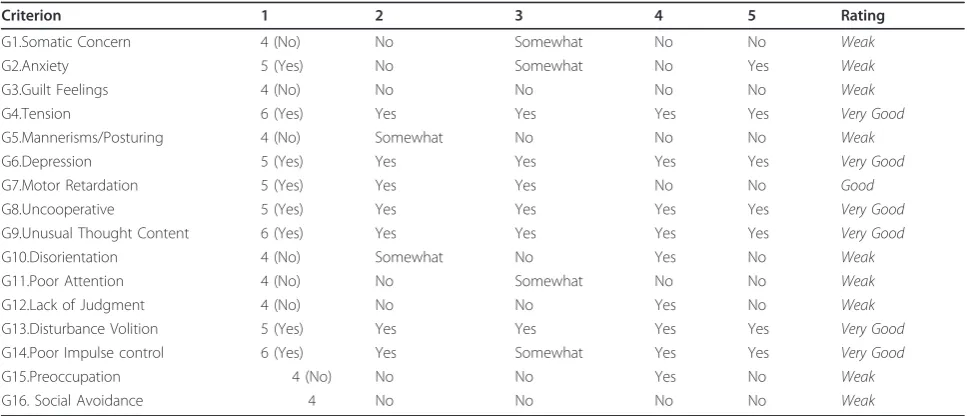
Global ratings of Very Good, Good and Weak items, along with ratings of each of the five criteria for the 16 items of the General Psychopathology subscale are pre-sented in Table 10. Although the slope and item biserial correlation for G7 Motor Retardation is low, this item was retained for the Mini-PANSS as ≥ 3 criteria were scored“Yes” (see Table 10).
Table 11 provides a summary of PANSS items which were rated Very Good, Good or Weak based on the operational criteria in Table 2. Nineteen items (63.33%) were rated asVery GoodorGood.
PANSS Positive Symptoms Subscale Performance
Figure 8 shows the average item information function for the Positive subscale as a function of the total sub-scale score. For the positive subsub-scale, the curve has one peak, around total score subscale scores of 8 to12, indi-cating that the scale is more informative for patients with lower scores, however the information function increases again after a total subscale score of 30, indicat-ing the subscale contains discriminatindicat-ing items for patients with higher scores. Despite the peaks, the item information function is above 0.11 and below 0.20 with a difference of only 0.09 in information function.
Figure 9 shows the distribution of Positive symptom scores and that this distribution is slightly skewed to the right, indicating that patients with very high Positive Symptoms subscale scores are rarer than patients with low subscale scores. The lowest score, a score of 7 (ver-tical line), and the scores in the 15 to 24 range are most probable.
Finally, Figure 10 shows that the standard error for a total subscale score of 17 to 34 is approximately 3.0, which includes 70% of patients. The standard error falls below 3.0 for patients scoring below 17 and above 34 possibly due to the poor quality of information in this subscale for patients with scores at the extremes of this subscale total score.
PANSS Negative Symptoms Subscale Performance
36 to 42, indicating that the subscale is more informa-tive for patients with lower scores (9 to13) and higher scores (36 to 42). An item information function of greater than 0.14 and less than 0.29 on the theta scale is observed for scores on the Negative Symptom subscale.
[image:15.595.56.540.88.640.2]The probability density function for the Negative Symptom subscale shows the highest peak around scores in the 18 to 27 range indicating these score are the most probable, and that the probability trails off more gradually above this region than below, indicating
positive skewness, and is a consequence of the rating relatively more higher scores than lower scores for this subscale (see Figure 12).
Figure 13 shows the estimated standard error or sam-pling standard deviation of the total score as a function of severity. The standard error is approximately 2.4 for patients scoring in the range 15 to 37, which includes 80% of the patient scores. The standard error falls below 2.4 for patients scoring below 15 and above 37 possibly due to the poor quality of information in this subscale for patients with scores at the extremes.
General Psychopathology Subscale Performance
Figure 14 shows the average item information function for the General Psychopathology subscale as a function of the total subscale score. For this subscale, the curve has one peak, around the scores ranging from 22 to 32, indicating that the scale is more informative for patients with lower scores, however the test information function increases again from a total score of 60, indicating the subscale contains many discriminating items for patients with higher scores. Compared to the range of informa-tion funcinforma-tion for the Positive (0.20 to 0.09) and Negative (0.29 to 0.14) subscales, the information function for the General Psychopathology subscale shows a smaller range from approximately 0.04 to 0.09.
[image:16.595.57.290.111.372.2]Figure 15 shows the distribution of General Psycho-pathology subscale scores, which is slightly skewed to the right, indicating that patients with very high General Psychopathology subscale scores are rarer than patients
Table 9 Slopes and Item Biserial Correlation for General Psychopathology Subscale
Items Slopes Rank of
Slopes
Item biserial correlation
G2.Anxiety 0.481 1 0.565
G14.Poor Impulse control 0.442 2 0.604
G4.Tension 0.437 3 0.630
G6.Depression 0.437 4 0.600
G9.Unusual Thought Content
0.437 5 0.605
G8.Uncooperative 0.431 6 0.617
G13.Disturbance of Volition
0.426 7 0.601
G1.Somatic Concern 0.395 8 0.541
G7.Motor Retardation 0.382 9 0.606
G10.Disorientation 0.382 10 0.441
G3.Guilt Feelings 0.377 11 0.431
G11.Poor Attention 0.377 12 0.567
G15.Preoccupation 0.377 13 0.438
G16.Active Social Avoidance
0.377 14 0.366
G5. Mannerisms and Posturing
0.373 15 0.463
G12.Lack of Judgment/ Insight
0.350 16 0.381
Note. Slopes were extracted from TestGraf output and were rounded to three decimal
places. Similarities in the values of slopes are due to rounding (e.g. slope of G4 is
[image:16.595.56.540.493.701.2]0.436681, slope of G6 is 0.436586, slope of G9 is 0.436546; slope of G7 is 0.381679, and slope for G10 is 0.381534; slopes for G3, G11, G15 and G16 are 0.377358, 0.377287, 0.377145, and 0.377003, respectively).
Table 10 Discrimination of the PANSS Items for General Psychopathology Subscale
Criterion 1 2 3 4 5 Rating
G1.Somatic Concern 4 (No) No Somewhat No No Weak
G2.Anxiety 5 (Yes) No Somewhat No Yes Weak
G3.Guilt Feelings 4 (No) No No No No Weak
G4.Tension 6 (Yes) Yes Yes Yes Yes Very Good
G5.Mannerisms/Posturing 4 (No) Somewhat No No No Weak
G6.Depression 5 (Yes) Yes Yes Yes Yes Very Good
G7.Motor Retardation 5 (Yes) Yes Yes No No Good
G8.Uncooperative 5 (Yes) Yes Yes Yes Yes Very Good
G9.Unusual Thought Content 6 (Yes) Yes Yes Yes Yes Very Good
G10.Disorientation 4 (No) Somewhat No Yes No Weak
G11.Poor Attention 4 (No) No Somewhat No No Weak
G12.Lack of Judgment 4 (No) No No Yes No Weak
G13.Disturbance Volition 5 (Yes) Yes Yes Yes Yes Very Good
G14.Poor Impulse control 6 (Yes) Yes Somewhat Yes Yes Very Good
G15.Preoccupation 4 (No) No No Yes No Weak
G16. Social Avoidance 4 No No No No Weak
with mid to low subscale total scores. The scores in the 32 to 48 range are most probable.
Figure 16 shows that the standard error for a total subscale score ranges from 1.0 to 5.0, and is above 3.0 for 95% of the sample. Smaller ranges of the standard error were observed for the Positive (< 0.01 to 3.0) and Negative subscales (0.2 to 2.4).
Examination of the item information function, prob-ability density function and standard error of the PANSS subscales indicate that Positive and Negative subscales operate in a similar manner and are more dis-criminating than the General Psychopathology subscale
scores, and may be more sensitive to change than the PANSS General Psychopathology subscale scores.
Mini-PANSS
Based on the results of the nonparametric IRT pre-sented above, 19 items were selected for inclusion in the Mini-PANSS. Only items selected, which were either
Very GoodorGooditems (see Table 11). The Validation
[image:17.595.56.538.98.336.2]subsample (n = 3,494) was used to examine some of the psychometric characteristics of the 19 items selected for the Mini-PANSS. As a first step, a PCA without rotation
Table 11 Summary of Items from the PANSS Identified as“Very Good,” “Good,”and“Weak.”
Very Good Items Good Items Weak Items
P1. Delusions P5. Grandiosity P7. Hostility
P2. Conceptual Disorganization
G7. Motor Retardation N5. Difficulty in Abstract Thinking
P3. Hallucinatory Behaviour G1.Somatic Concern
P4. Excitement G2.Anxiety
P6. Suspiciousness/Persecution G3.Guilt Feelings
N1. Blunted Affect G5.Mannerisms/Posturing
N2. Emotional Withdrawal G10.Disorientation
N3. Poor Rapport G11.Poor Attention
N4. Passive Apathetic Social Withdrawal
G12.Lack of Judgment
N6. Lack of Spontaneity G15.Preoccupation
N7. Stereotyped Thinking G16. Social Avoidance
G4.Tension G6.Depression G8.Uncooperative
[image:17.595.304.540.505.699.2]G9.Unusual Thought Content G13.Disturbance Volition G14.Poor Impulse control
[image:17.595.56.292.524.698.2]Figure 8Average Item Information Function for the Positive Symptom Subscale.
similar to the PCA performed for the 30-item scale was conducted on the abbreviated 19-item PANSS to assess unidimensionality. Second, similarities between the two scales were examined by Pearson correlation coefficients between the 30-item scale and Mini-PANSS scale using the Validation subsample.
The mean PANSS scores of the Validation subsample for the 19-item PANSS are as follows, Positive subscale 17.52 (SD = 6.08) (6 to 36 score range), Negative sub-scale 19.01 (SD= 6.17) (6 to 39 score range), General Psychopathology subscale, 17.54 (SD = 4.85) (7 to 33 score range), and total PANSS 54.07 (SD= 13.27) (19 to 98 score range). Using the Validation subsample (n = 3,594), Bartlett’s Test of Sphericity was significant (p < .001) for the six items of the Positive subscale, the six items of the Negative subscale, and the seven items of the General Psychopathology subscale. The Kaiser-Meyer-Olkin (KMO) measure of sampling adequacy produced values of 0.808, 0.858, and 0.804, for the Posi-tive, Negative and General Psychopathology subscales,
respectively. Using the criteria to assess unidimensional-ity of the eigenvalue for the first component being three times larger than the second component, the Positive, Negative and General Psychopathology subscales all indicate unidimensionality (see Table 12). The General Psychopathology subscale for the Mini-PANSS shows unidimensionality, compared to the assessment of unidi-mensionality for the 30-item PANSS (see Table 4) which did not show unidimensionality.
[image:18.595.54.293.88.246.2]Correlations were computed for the Positive, Negative, and General Psychopathology subscale scores, along with total PANSS scores for the 30 item PANSS and the Mini-PANSS. Significant correlations were observed between the respective subscale scores and the total scores of the two scales. Cronbach alphaa, between the 30-item PANSS and Mini-PANSS, ranged from .830 for the General Psychopathology subscale, .938 for the Posi-tive Symptoms subscale, and .991 for the NegaPosi-tive Symptoms subscale suggesting that the subscales of the
[image:18.595.304.540.88.229.2]Figure 10Estimated Standard Error of the Positive Symptoms Subscale.
[image:18.595.303.539.524.697.2]Figure 11Average Item Information Function for the Negative Symptom Subscale.
Figure 12The Probability Density Function for the Negative Symptoms Subscale.
[image:18.595.57.291.548.700.2]30-item PANSS compared to the subscales of the Mini-PANSS all have high internal consistency as indicated by Cronbach’sa≥0.80.
Summed Score Linking
The item parameters from the 30-item scale and the item parameters from the 19-item scale were produced by TestGraf (expressed as,θ or IRT Score, ranging from - 3 to 3) and were used to estimate the IRT score corre-sponding to each summed score for each of the three subscales for the Validation subsample. After applying linear interpolation methods, Table 13, Table 14 and Table 15 display summed-score translation tables for the Positive Symptoms, Negative Symptoms and General Psychopathology subscales, respectively. IRT Score (θ) corresponding was converted to each expected total scores (summed score) for each subscale of the PANSS to the Mini-PANSS subscales prior to the application of linear interpolation (see Additional file 1, Table S1, Additional file 1, Table S2, Additional file 1, Table S3 for Conversion Table).
As a final measure of comparison between the inter-polation scores of the Mini-PANSS to the 30-item PANSS, the differences between the interpolated value from the Mini-PANSS and the actual score on the 30-item PANSS using the Validation subsample, was com-puted. For Positive Symptoms subscale, the mean differ-ence between the interpolated score from the Mini-PANSS and the 30-item Mini-PANSS was -0.382 (- 4 to 3 range of scores). For the Negative Symptoms subscale, the mean difference between the interpolated score from the Mini-PANSS and the 30-item PANSS was -0.398 (- 4 to 4 range of scores). For the General Psy-chopathology subscale, the mean difference between the interpolated score from the Mini-PANSS and the 30-item PANSS was -0.407 (- 4 to 5 range of scores). For the PANSS total score, the mean difference between the interpolated score from the Mini-PANSS and the 30-item PANSS was -0.428 (-4 to 5 range of scores). The small mean differences and range of scores from the interpolated values support the similarities with the ori-ginal scale.
Discussion
The primary purpose of this study was to demonstrate that most of the items of the PANSS are Very Goodor
Good at assessing overall illness severity throughout the spectrum of increasing levels of severity. A second pur-pose was to create an abbreviated version of the PANSS using a nonparametric IRT in the TestGraf software. Shortened versions of this standardized and widely dis-seminated scale provide an interesting avenue, which could be more fully explored before investing resources in the development of completely new instruments.
[image:19.595.56.293.89.243.2]Our results confirmed that a majority of PANSS items (63.33%; 19 out of 30 items) are either Very Goodor
[image:19.595.57.291.560.700.2]Figure 14Average Item Information Function for the General Psychopathology Subscale.
Figure 15The Probability Density Function for the General Psychopathology Subscale.
Goodat assessing the overall illness severity. Our results agree with the ones found by Santor and colleagues [8] who conducted the first IRT analysis of the PANSS. Not surprisingly our present nonparametric IRT showed that the Negative Symptom items (particularly, N1, N2, N3, N4, N6, and N7) showed good discriminative properties across almost the entire range of severity (i.e. increases in symptom intensity correspond to increases in illness severity), and it is these items that most closely approxi-mates the“ideal” item illustrated in Figure 1. In addi-tion, items of the Positive Symptoms subscale, P1, P3, P5, and to a lesser degree, P2, P4 and P6, also showed good approximation to the“ideal”item presented in Fig-ure 1. For these items, the probability of rating a parti-cular option (level of severity) corresponded to a relatively well defined and narrow range of severity.
In contrast, as demonstrated by Santor and colleagues [8] many items (P7, N5, N7, G1, G5, G6, G9, G10, G11, G12, G13, and G15) demonstrate problematic features and some fundamental issues remain with regard to the use of the PANSS total score as a measure of overall level of psychopathological severity in schizophrenia. Several items from the General Psychopathology
[image:20.595.59.542.100.152.2]subscale failed to show good discriminative properties across the range of severity assessed in the present study. Of the 16 items of the General psychopathology Subscale, only seven (43.75%) were found to be either Very Good or Good and were retained in the Mini-PANSS. For example, for item G3 (Guilt Feelings), OCCs were flat (not peaked) across almost the entire severity range, and was dominated by a single response option throughout most of the distribution of scores. One may argue that this is a result of the severity of the patient population used for this study, however, the levels of psychopathology in this study ranged from the lowest levels of severity (a total PANSS score of 32) to very high levels of severity (a total PANSS score of 161). A consistent observation across all items was that very extreme symptomatology (option 7) was rarely rated. Additionally, Santor and colleagues [8] and Obermeier and colleagues [36] recommended rescaling the PANSS
Table 12 Eigenvalues of Mini-PANSS subscales (without rotation)
PANSS Subscale Component 1 Eigenvalue Component 2 Eigenvalue Ratio of Eigenvalues Unidimensionality assumed
Positive Symptoms 2.920 .798 3.659 Yes
Negative Symptoms 3.628 .784 4.628 Yes
General Psychopathology 3.332 1.109 3.005 Yes
Note. Ratio of Eigenvalues is computed by dividing the eigenvalues for the first component by the eigenvalues for the second component. Unidimensionality assumed, is based on the eigenvalue of Component 1 being at least three times larger than the eigenvalue for Component 2 (as presented in the column titled
‘Ratio of Eigenvalues’)
Table 13 Summed-Score Conversion Table for the Mini-PANSS and 30-item Positive Symptoms Mini-PANSS subscale based on expected total score
6 Item Positive Mini-PANSS
7 Item Positive Original PANSS
6 Item Positive Mini-PANSS
7 Item Positive Original PANSS
6 7 19 22
7 8 20 23
8 9 21 24
9 10 22 25
10 11 23 26
11 13 24 28
12 14 25 29
13 15 26 30
14 16 27 32
15 17 28 33
16 18 29 34
17 20 30 35
18 21 31 37
[image:20.595.305.538.462.688.2]Note. Total scores on the Positive subscale for the 19-item Mini-PANSS are not presented for total scores > 32 based on expected total score ranges of the dataset used.
Table 14 Summed-Score Conversion Table for the 19-item and 30-19-item Negative Symptoms PANSS subscale based on expected total score.
6 Item Negative Mini-PANSS
7 Item Negative Original PANSS
6 Item Negative Mini-PANSS
7 Item Negative Original PANSS
6 7 22 26
7 8 23 27
8 9 24 28
9 10 25 29
10 12 26 30
11 13 27 32
12 14 28 33
13 15 29 34
14 16 30 35
15 18 31 36
16 19 32 37
17 20 33 38
18 21 34 39
19 22 35 40
20 24 36 42
21 25 37 43
[image:20.595.56.289.524.705.2]options as option 7 is rarely endorsed and some options present ambiguous definitions. For example, on item P1, patients scoring at the highest range of Positive Symp-toms total score were far more likely to score a 5 or 6 on this item, suggesting that option 7 was underutilized. Additionally, a large number of items showed an overlap in OCCs for options 3 and 4 (some examples include G2, G3, G12). These result were not unexpected, because the definition of option 3 includes“little inter-ference with patient’s daily functioning,’whereas option 4“represents a serious problem but occurs occasionally” (Kay et al., 1987). This phrasing appears to create greater overlap as the terms “little interference” and can be difficult to differentiate from“occurs occasionally.” Results also demonstrate overlap between a number of adjacent OCCs. In particular, items P7, N5, G1, G3, G10, G11, and G12 display significant overlap between most options suggesting these levels of severity are poorly differentiated. Also, results show that some items are predominantly rated at higher levels of severity and do not span the entire continuum of expected scores. For example, G2, G5, and G16, have OCCs starting from expected scores on the General Psychopathology subscale of approximately 25.
It is noteworthy that results of the current investiga-tion offered a high degree of agreement with other psy-chometric research of psychopathology in schizophrenia. Specifically, like the present IRT, previous psychometric investigations have indicated that PANSS items P7, N5, G1, G5, G10, G11, G12, G15 either do not discriminate well in terms of assessing overall severity or do not
reflect dimensional individual differences between patients with schizophrenia [2,8,37]. Also, like the pre-sent IRT, previous psychometric investigations have indicated that PANSS items of N1, N2, N3, and N4 dis-criminate well and reflect dimensional individual differ-ences [19,37,38]. The present results have implications for psychopathology measurement and clinical assess-ment. Researchers and clinicians evaluating psycho-pathology in schizophrenia using the 30-item PANSS may choose to focus only on items that performed well in IRT analyses.
The effectiveness of item options has a direct bearing on the effectiveness of their respective item and, there-fore, on the effectiveness of the Positive, Negative, and General Psychopathology subscales. In this case, the Negative Symptom subscale was found to provide maxi-mum information at the low and high ends of the con-struct. The low standard error of estimate supports the conclusion that these items form a well-defined sub-scale. Similar observations are noted for the Positive Symptom subscale with test information functions 0.10, and better for the lower 10% and upper 5% of the sever-ity. The General Psychopathology subscale had the least test information function of the three subscales, ranging from 0.04 to 0.09 of the severity level. Additionally, standard error of estimate for the General Psychopathol-ogy subscale increased progressively from 1.0 at the lower end of the trait level up to 6.0 at the higher end of the severity level, thus indicating increased errors of measurement along higher levels of the severity conti-nuum. These subscale performance results are similar to those found by Santor and colleagues [8], who observed better subscale performance for the Positive and Nega-tive subscales over the General Psychopathology sub-scale. It appears then that the two subscale scores reflect the overall severity spectrum more appropriately than the total PANSS score. The use of the two Positive and Negative subscales independently from the rest of the scale is seen at times in clinical trials considering that these two symptom domains are key components of the disease [2] and which are primarily targeted in drug development.
[image:21.595.55.290.123.302.2]Although the PANSS was originally designed with three subscales (Positive, Negative, and General Psycho-pathology), studies examining the internal structure of the scale [39] have all identified the same two underly-ing factors, a positive and negative factor. Other factors have varied and included Disorganized, Excitement, Hostility, Dysphoric, Catatonic and many more [2]. Given that OCCs depend on how symptom severity is defined, the appropriateness of modelling of items via their subscale scores, rather than a total PANSS score was confirmed by conducting PCA on each subscale to assess unidimensionality. The PCA of the General
Table 15 Summed-Score Conversion Table for the 19-item and 30-19-item General Psychopathology Symptoms PANSS based on expected total score.
7 Item General Mini-PANSS
16 Item General Original PANSS
7 Item General Mini-PANSS
16 Item General Original PANSS
7 19 20 45
8 23 21 47
9 25 22 49
10 27 23 51
11 29 24 52
12 30 25 54
13 33 26 56
14 34 27 58
15 36 28 60
16 38 29 62
17 40 30 64
18 41 31 66
19 43 32 67