EFFICIENCY AND PRODUCTIVITY CHANGE IN THE ENGLISH HIGHER EDUCATION SECTOR FROM 1996/97 TO 2004/05
Jill Johnes
Department of Economics
Lancaster University Management School Lancaster University
Lancaster LA1 4YX United Kingdom
Tel: +44 (0)1524 594224 Fax: +44 (0)1524 594244 Email: j.johnes@lancaster.ac.uk
January 2007
Final version December 2007 Abstract
This study uses data envelopment analysis (DEA) and a distance function approach to derive Malmquist productivity indexes for 112 English higher education institutions (HEIs) over the period 1996/97 to 2004/05, a period of rapid expansion in the sector. The analysis finds that over the period of the study HEIs have experienced an annual average increase in Malmquist productivity of around 1%. On investigating the components of this productivity change, however, it becomes apparent that HEIs have enjoyed an annual average increase in technology of 6% combined with a decrease in technical efficiency of 5%. Thus rapid changes in the higher education sector appear to have had a positive effect on the technology of production but this has been achieved at the cost of lower technical efficiency.
JEL Classification: I21, C14, D24, O3
1. Introduction
Since the early 1990s, the UK higher education sector has experienced some significant changes in its structure and funding. In1992, the higher education sector expanded to encompass more than 170 institutions (compared with under 60 before that date). Not surprisingly, there is therefore a huge diversity to be seen in the UK higher education sector. UK higher education institutions (HEIs) can be divided into three broad groups on the basis of their historical background. Pre-1992 universities had the status of a university before the provisions of the Further and Higher
Education Act of 1992 came into force. Prior to 1992, they were largely funded by the Universities Funding Council. Post-1992 universities are mostly former polytechnics which, prior to 1992, were funded by the Polytechnics and Colleges Funding
Councils. The Further and Higher Education Act of 1992 allowed these HEIs to award their own degrees and to use the title of university. The third group of institutions are the colleges which belong to the Standing Conference of Principals Ltd (SCOP). These colleges are part of the higher education sector, but differ from other HEIs in that they are often specialist institutions concentrating on a particular discipline such as teacher training, music, drama, performing arts, education or agriculture. In 2003, it was announced that these specialist institutions will be allowed to apply for university status, and this will be granted on the basis of adequate student numbers and good teaching.
The diversity between these groups of HEIs, is matched by diversity within the groups. The pre-1992 group, for example, includes old universities, such as Oxford and Cambridge, together with the redbricks founded in the nineteenth and early twentieth century, the former colleges of advanced technology, and the new universities created in the 1960s. The post-1992 group is somewhat less
heterogeneous, most having been founded in the early twentieth century. Historically, post-1992 HEIs have emphasised their teaching activity, but, while this is still true for some, over recent years many have successfully established and expanded areas of research. The SCOP colleges primarily engage in teaching, and their diversity derives from the area in which they specialise.
commitment to expand student numbers up to 50% of the age 18-30 group (DFES 2003) suggests that this rise in numbers will continue.
The expansion in student numbers has necessarily been accompanied by an overhaul of the student funding process. Student loans were first introduced in 1990. In 1998, students were required to pay up-front fixed rate tuition fees (with some means-testing) and loans were available to cover both fees and living expenses, repaid after graduation and contingent upon income. Since September 2006, up-front fees have been replaced by top-up fees: universities in England are allowed to charge up to £3000 per year (this is fixed until 2010) and loans at favourable interest rates are available to pay the cost of fees and living, repayment being contingent upon income after graduation.
The UK higher education sector also receives substantial government funding. Since 1994/95, funding council grants to the sector have risen in real terms by 29% up to 2005/06 (HESA, 1994/95 and 2005/06). The £7544 million received by the sector in funding council grants in 2005/06, moreover, represents nearly 40% of its total income (HESA, 2005/06).
The amount of public money received by the sector, and the Government's stated aims for the sector, make it essential to monitor regularly the performance and productivity of the institutions comprising the higher education sector. Flegg et al (2004) have examined the change in productivity in the British universities sector over the period 1980/81 to 1992/93 using a sample of 45 HEIs. It is therefore no longer representative of the higher education sector which prevails in the UK today. A more recent study by Flegg & Allen (2007) uses a more up to date sample (1994-2004) but is restricted only to the pre-1992 universities. An analysis of the performance and productivity of the entire higher education sector is therefore overdue, and this is the gap in the literature which this study aims to fill.
Measuring the efficiency of institutions in the higher education sector is problematic, however, because the higher education sector has characteristics (some or all of which may also occur in other sectors of the economy) which make it difficult to measure efficiency: it is non-profit making; there is an absence of output and input prices; and HEIs produce multiple outputs from multiple inputs. The
consideration, such as cost minimization or profit or revenue maximization (Coelli et al 1998). When a panel of data is available, moreover, changes in productivity growth
over the period under consideration can also be calculated using the Malmquist productivity change index. This index is composed of distance functions, and is therefore superior to alternative indexes of productivity growth (such as the Törnqvist index and the Fisher Ideal index) because it is based only on quantity data and makes no assumptions regarding the firm’s behaviour (Grifell-Tatjé & Lovell 1996). The Malmquist productivity index can provide additional insights since it can be decomposed into two additional components, one which measures changes in technical efficiency (i.e. whether firms are getting closer to the production frontier over time), and one which measures changes in technology (i.e. whether the production frontier is moving outwards over time).
There is now a considerable literature on efficiency measurement in the higher education sector, a full survey of which can be found in Worthington (2001) and Johnes (2004). Recent studies of efficiency measurement of UK HEIs include Athanassopoulos & Shale (1997); Glass et al (2006); Johnes (2006); Flegg & Allen (2007). Despite the differences between the studies with regard to the time period and HEIs included in the analysis, these studies suggest that the UK higher education sector is remarkably efficient with average efficiency levels of between 85% and 95%. Two additional studies of efficiency in higher education are of particular interest because they analyse productivity changes as well as technical efficiency within higher education. Worthington & Lee (2007) examine the change in productivity in the Australian universities sector between 1998 and 2003, while Flegg et al (2004) examine the change in productivity in the British universities sector over the period 1980/81 to 1992/93. Both studies find an annual average increase in productivity of more than 3% over the period, and, in both cases, the positive productivity change is found to have been caused largely by positive technological change (i.e. an outwardly shifting production frontier) rather than by changes in technical efficiency.
technical efficiency, technology and productivity change of the sector as a whole, and the subgroups separately, to be assessed over this period.
The paper is in five sections of which this is the first. Section 2 describes how distance functions can be used to measure the various types of efficiency and
discusses the estimation methods. The data set and model are described in section 3 while section 4 presents the results of the analysis. Finally, conclusions are drawn in section 5.
2. Efficiency and productivity growth and their estimation
Technical efficiency is defined using Farrell’s (1957) approach whereby a firm’s actual production point is compared with the point which might have been achieved had it operated on the frontier. In figure 1, Ft represents the constant returns to scale production frontier showing the efficient levels of output, y, which can be produced, in time t, from a given level of input, x. Similarly, Ft+1 represents the constant returns to scale production frontier showing the efficient levels of output, y, which can be produced, in time t+1, from a given level of input, x. University P produces at point Pt in time period t and at Pt+1 in time period t+1, and so technical efficiency is measured as the ratio of 0yt 0ytt in time period t and by 0yt+1 0ytt++11in time period
t+1. This measure is in fact the output distance function which, for the general case,
can be denoted by DOt (xt,yt) for time t, and DOt+1(xt+1,yt+1) for time t+1 (Coelli et al
1998).
Figure 1
The time dimension allows an analysis of productivity change which can be measured using the Malmquist productivity index. The approach is standard (and is detailed in Coelli et al 1998, chapter 10) and therefore only a short description is provided here. On the assumption that the university seeks to maximise output for a given level of input (i.e. an output-oriented approach), productivity change might be evaluated by comparing the efficiencies of observations Pt and Pt+1 calculated relative
to the frontier in period t (i.e. t
t t
t t t
y y
y y
0 0
0 0 +1 +1
in figure 1) or by comparing the
efficiencies of Pt and Pt+1 calculated relative to the frontier in period t+1 (i.e.
1 1 1 1
0 0
0 0
+ + + +
t t t
t t t
y y
y y
of the two measures and the general formula for the Malmquist productivity change index is (Coelli et al 1998):
2 1 1 1 1 1 1 1 1 1 ) , ( ) , ( ) , ( ) , ( ) , , , ( = + + ++ + + + + t t t O t t t O t t t O t t t O t t t t O y x D y x D y x D y x D y x y x M
where DOt (xt+1,yt+1) denotes the distance of the period t+1 observation from the
period t frontier. If the Malmquist productivity change index exceeds unity, there has been an improvement in productivity between periods t and t+1. Values less than 1 suggest the converse.
It can be seen from figure 1 that the change in the production position of university P over the two time periods has two underlying determinants: first, the university can produce more because the sector’s production frontier has moved outwards, and therefore the potential for production is expanded; second, the
university’s position relative to the time-relevant frontier can change. The Malmquist productivity index conceals these two effects. However, it is possible to decompose it into the two components as follows (Färe et al 1989, 1992):
2 1 1 1 1 1 1 1 1 1 1 1 1 ) , ( ) , ( ) , ( ) , ( ) , ( ) , ( ) , , , ( = + + + + + + + + + + + t t t O t t t O t t t O t t t O t t t O t t t O t t t t O y x D y x D y x D y x D y x D y x D y x y x M
The first component, E =
+ + + ) , ( ) ,
( 1 1
1 t t t O t t t O y x D y x D
, measures the change in technical
efficiency over the two periods (i.e. whether or not the unit is getting closer to its efficiency frontier over time), and the second component, T =
2 1 1 1 1 1 1 1 ) , ( ) , ( ) , ( ) , ( + + + + + + t t t O t t t O t t t O t t t O y x D y x D y x D y x D
, measures the change in technology over the two
time periods (i.e. whether or not the frontier is shifting out over time). Values of either of these components of greater than unity suggest improvement, while values of less than 1 suggest the opposite.
In the exposition so far, constant returns to scale (CRS) have been assumed. We can relax the CRS assumption and assume variable returns to scale (VRS). The ratio of the CRS to VRS technical efficiency measures (i.e. Ot VRS
t CRS O t D D
SE = , , , where the
With regard to returns to scale and productivity change, Färe et al (1994; 1997) propose a further decomposition of the Malmquist index such that E = PE x S where: E is the efficiency change calculated on the assumption of CRS (defined above); PE
=
) , (
) , (
,
1 1 1 ,
t t t
VRS O
t t t
VRS O
y x D
y x
D + + +
and is the pure technical efficiency change index; and S =
t t
SE
SE +1 for periods t and t+1 (where SEt is defined above), and S measures the degree to which a unit gets closer to its most productive scale size over the periods under examination. Any empirical estimation of this decomposition of the Malmquist productivity change index should be treated with caution, however, since it mixes VRS and CRS efficiencies in the estimation of its components (Ray & Desli 1997).
The distance functions required to evaluate these various measures of efficiency and productivity can be estimated using parametric or nonparametric techniques. The most common methods are stochastic frontier analysis (SFA) and data envelopment analysis (DEA). Both of these estimate a production frontier, but in the former case the frontier is parametric, while in the latter it is a non-parametric piece-wise linear frontier which envelops the data. SFA requires assumptions to be made regarding the distribution of efficiencies, the distribution of the stochastic errors, and the functional form of the production technology. The advantage of these assumptions is that it allows statistical inferences to be drawn from the results. The disadvantages derive from the fact that the assumptions are often made in an arbitrary fashion, or for reasons of analytical tractability, rather than from a knowledge of the true distributions or functional form.
requires additional distributional assumptions and imposes considerable strain on the data). The wide diversity of units included in this analysis, along with the multiple input, multiple output nature of production in higher education make DEA the technique of choice in the ensuing analysis.
The CRS distance functions required to estimate the Malmquist productivity index ( t
O
M ) are calculated using linear programming (see Coelli et al 1998, p227, for
details). The linear programs are easily adapted to allow estimation of the VRS
distance functions required to provide estimates of pure technical and scale efficiency. There are two approaches to calculating the Malmquist productivity change index (Grifell-Tatjé & Lovell 1996). First, it can be calculated for each pair of adjacent years from t, t+1to T-1, T (for t=1,…,T). Alternatively, it can be calculated for each year relative to the same fixed base (i.e. for t relative to s, t+1 relative to s, and so on to T relative to s). The value of the Malmquist productivity change index can vary according to method used, particularly if production frontiers in adjacent periods overlap (Grifell-Tatjé & Lovell 1996). Both methods will therefore be applied in the ensuing analysis.
3. Data and Model
Taking a production approach, universities can be seen as using raw materials, capital and labour inputs to produce teaching, research and social outputs. The difficulties of creating variables to measure these broad categories of inputs to and outputs from the higher education production process are, by now, well known (a summary of these can be found in Johnes 2004). As has already been observed, there is a wide diversity of HEIs included in the analysis, and any attempt to identify a uniform set of inputs and outputs for such a diverse set is bound to be open to
criticism. While this problem should be borne in mind when interpreting the results, it is also important to remember that the estimation technique also plays a part in
reducing this problem because it allows each unit to impose its own set of input and output weights to reflect it in its best possible light. The inputs and outputs defined in the present study are constructed from detailed annual statistics for all HEIs in
Five measures of inputs are constructed from the data and detailed definitions can be found in table 1. Raw materials are the student inputs as measured by the number of full-time equivalent (FTE) first degree and other undergraduates (UG) and the number of FTE postgraduate students (PG). Capital input is measured using the variable ACSERV which is expenditure on centralised academic services such as the library and computing services. Labour input is measured by the number of FTE academic staff (STAFF). It should be noted that non-academic labour inputs are not directly incorporated. The data published by HESA do not provide a breakdown of staff type over the entire time period of the study. For 2004/05 where a breakdown is available, the correlation between academic and non-academic staff numbers is 0.97 and so the non-academic staff input may actually be reflected, to some extent, by the academic staff numbers. In addition, another input variable is included in an attempt to capture the non-academic input into the university production process. This
additional variable is ADMIN which is expenditure on total administration and central services. As in previous studies (Abbot & Doucouliagos 2003; Flegg et al 2004; Worthington & Lee 2007; Flegg & Allen 2007), no attempt is made to take into account inter-institution differences in quality of inputs (quality may vary substantially by institution in the context of the raw material and labour inputs), mainly because of a lack of published data in this area, and this should be borne in mind when interpreting the results.
Table 1
Three measures of output are constructed, and detailed definitions can be found in Table 1. The number of first degree and other undergraduate degree qualifications (UGOUTPUT) and the number of higher and other postgraduate degree qualifications (PGOUTPUT) measure the teaching output of HEIs, and these tie in with the
Research output might be measured using income received for research purposes or by using the ratings of university departments’ research produced by the Research Assessment Exercise (RAE). The latter might be considered a more appropriate measure of research output, incorporating both quality and, if weighted by appropriate staff numbers, quantity (Glass et al 2006). The RAE ratings, however, are available only at intervals (1996 and 2001 over the study period) whereas the analysis is based on annual data. Hence income received for research purposes is used as the measure of research output (RESEARCH). This approach is now firmly rooted in the literature because of its ease of availability and because it provides an up-to-date measure of both the quality and quantity of research (Abbott & Doucouliagos 2003; Flegg et al 2004; Worthington & Lee 2007; Flegg & Allen 2007).
After teaching and research, universities are also considered to produce ‘third mission’ or social output. Included in this are the storage and preservation of
knowledge and skills; the provision of advice and other services to business; and the provision of a source of independent comment on public issues. No attempt is made to construct a separate measure of the social outputs of HEIs, and there may therefore be bias in the results as a consequence of this omission.
It was possible to collect the data required and to construct these variables for nine years (1996/97 to 2004/05), and for a total of 112 HEIs in England. This figure is less than the total number of institutions in the sector in England for a number of reasons: data for HEIs which merged during the study period are amalgamated for years prior to the merger; HEIs which entered the sector during the study period are not included; HEIs for which a full set of data was not available, or which produced zero of any output (thereby being outliers and affecting the DEA results) have been removed; Open University has also been removed because of its large size and its unique nature of teaching provision. It should also be noted that any variables
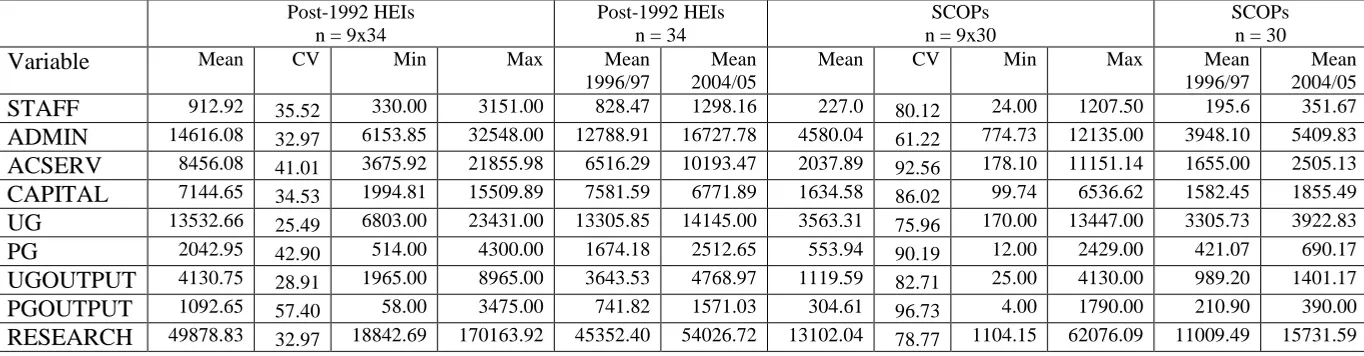
measured in monetary terms have been standardised to January 2003 values (see table 1). Descriptive statistics are presented for all measures (amalgamated across all years), and for each subgroup separately, in table 2. It is clear that the post-1992 group of HEIs have the largest average number of undergraduates, and also display the least diversity in terms of the coefficient of variation (CV) of the respective input and output measures. Pre-1992 HEIs have the largest average number of
The trend over time for all measures (not shown in the table) is generally upward, and this is particularly marked for the last four years of the series i.e. since 2001/02.
Table 2
4. Results
4.1 Technical and Scale Efficiency
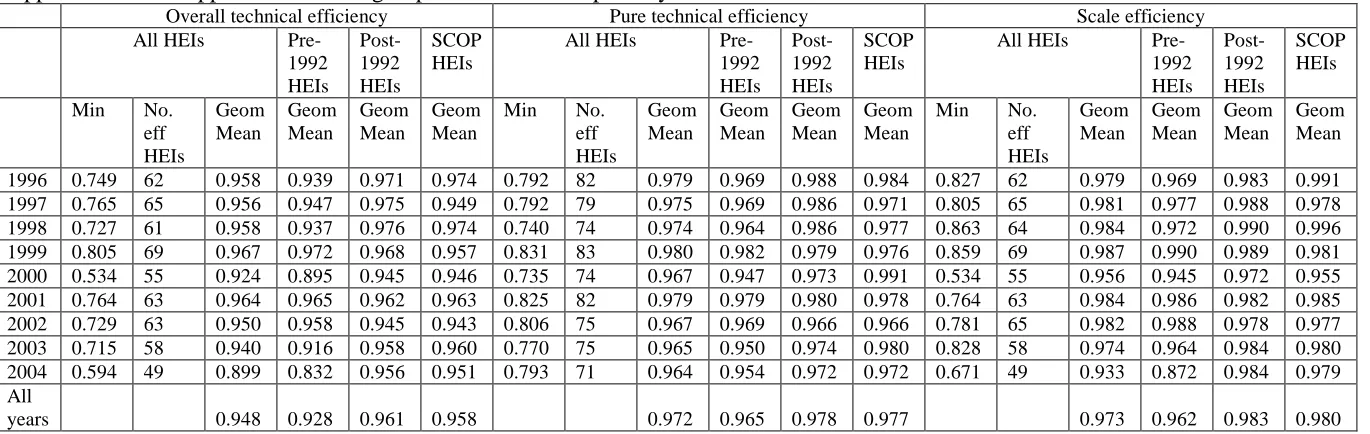
All efficiency and productivity measures have been calculated using the software PIM –DEAsoft V1. Two alternative approaches are taken to the estimation of efficiencies because of the considerable diversity between the different types of HEIs in terms of their input and output structure. First, because it has previously been found that the efficiency with which these inputs are converted into outputs does not differ significantly across the subgroups of HEIs (Johnes 2006), DEA is applied across the entire sample of HEIs. Second, to provide results for comparison, and to reduce the possible problem of outliers in such a diverse data set, DEA is applied to each subgroup separately, thereby allowing a member of a subgroup only to have members of the same subgroup in its efficient reference set. The resulting efficiency scores derived from the two alternative approaches are summarised in table 3. It is no surprise that the efficiency scores derived from the second approach are, on average, higher (by about 6 percentage points) than those derived from the first approach.
Average overall technical efficiency over the period for the sector as a whole is high (88% or 95%, depending on the approach taken). The efficiencies from the second approach are in line with previous studies which are comparable in terms of either time period or sample of HEIs included (for example, Johnes 2006; Flegg & Allen 2007). The lower efficiencies from the first approach are more comparable with efficiency levels found for alternative samples covering earlier periods (Flegg et al 2004; Glass et al 2006).
While average efficiency over all years is high, there is wide variation between HEIs and over time. The minimum efficiency score for an individual HEI (around 50%) is observed in 2000/01, a year in which average efficiency dips noticeably (relative to the years either side). Since 2001/02, technical efficiency appears to have been on a downward trend. Scale and, to a lesser extent, pure technical efficiency scores display a similar pattern. These general patterns are observed in the results of both estimation approaches.
The figures for the overall sector conceal some differences between the
subgroups. SCOP and SCOP type colleges, for example, have higher average overall technical efficiency and higher scale efficiency than pre-1992 HEIs. There appears to be little difference between the subgroups, however, in terms of pure technical efficiency. A Kruskall-Wallis test was applied to each of the sets of efficiencies (i.e. overall, pure and scale) by year and averaged across all years. The results indicate that the overall technical and scale efficiency distributions of the three subgroups are, on average, significantly different at the 5% significance level. These findings are observed regardless of the approach taken to estimate the efficiencies.
It is well known that DEA results can be sensitive to the specification of the inputs and outputs. As a consequence several alternative models were defined and efficiencies evaluated. First STAFF in the original model was replaced by two separate variables measuring part-time academic staff and full-time academic staff; second, an alternative measure of capital (namely depreciation costs and interest payable) replaced TOTACSERV and ADMIN in the original model; finally this alternative measure of capital was included as an additional input in the original model. In all cases, the pattern of efficiencies was similar to those reported.
The high levels of technical efficiency derived in this and other studies of the English higher education sector warrant further examination, particularly since this is a sector without a profit motivation. One obvious possible reason for the results derives from a shortcoming of the DEA technique: efficiency is measured relative to an observed production frontier (i.e. one determined by the observations in the sample), and this may differ from the true frontier for an efficient higher education sector. Even if this is the case and efficiency is therefore overestimated, the rankings and interrelationships between the HEIs are still likely to be valid. A second point to consider is that, over the decade covered by this study, competitive forces have increasingly entered the English higher education sector. HEIs must increasingly compete for the best students and for resources with which to conduct research. The incentive to be efficient is therefore present, even though the profit motivation is not. This begs the question of why efficiency levels appear to have been falling in the most recent years of the study (since 2001/02), a period which has also experienced the most rapid expansion. This will be considered in further detail in the context of the productivity indexes discussed below.
Changes in productivity over the period of study are calculated using both an adjacent year and base year approach (see section 2). The results are consistent across both approaches and so only the results of the base year approach are reported. In addition, productivity changes are assessed using both across sample and within-subgroup estimation approaches (as with the efficiencies in section 4.1). The results of these two approaches are reported in tables 4a and 4b. The results are broadly similar. The following text refers to the results reported in table 4a. Over the period as a whole, the annual average Malmquist productivity change, relative to 1996/97, is around only 1%. Productivity has fluctuated widely, however, from around -4% in 2004/05 (relative to 1996/97) to 7% in 2003/04 (relative to 1996/97).
From an examination of the components of the Malmquist productivity index, it emerges that technology change has averaged around 6% per annum, and that the Malmquist index has been brought down by a negative annual average technical efficiency change of -5%. The small average annual increase in productivity in English higher education over the period is therefore largely a consequence of
technology change rather than technical efficiency change, and this is consistent with previous studies (Flegg et al 2004; Worthington & Lee 2007). These findings are also confirmed when the second approach to the estimation of the indexes is taken.
This broad pattern of positive technology change outweighing negative technical efficiency change (when averaged across all years) is also observed for each subgroup separately. There are some small differences between the subgroups in the size of the indexes: technology change, for example, has been slightly higher, on average, for the post-1992 and SCOP and SCOP type colleges than for pre-1992 HEIs (7% compared with 5%). A Kruskall-Wallis test was applied to each of the sets of indexes (i.e. technical efficiency change, technology change and Malmquist productivity change) by year and averaged across all years. The results indicate that the technology change distributions of the three subgroups are significantly different, on average, at the 5% significance level. There is no significant difference between subgroups in the distributions of technical efficiency change and Malmquist productivity change. These findings are observed regardless of the approach taken to estimate the indexes.
Tables 4a and 4b
in section 2, and second, because they are calculated on the assumption that there is no congestion in the higher education production process (Flegg & Allen 2007). Broadly speaking, both scale and pure technical efficiency changes contribute equally to the annual average technology change.
The most obvious source of change in production activity in HEIs is the increased use of information technology and e-learning. The Department for
Education and Skills has highlighted the improvements introduced by increased use of technology: information is more accessible to users, causing changes in teaching, and increasing the efficiency of administrators (DFES 2005). Improved communications have also increased the ease with which collaborative research can be undertaken. Thus all aspects of a university’s activities are affected by increasing use and application of technology.
What reasons can then be offered for the observed negative changes in technical efficiency over the period? It is clear from table 4a that influences in the period around 2000/01 had severe effects on productivity: there was a relatively large increase in technology but this was accompanied by a severe drop in technical
efficiency. This is observed, moreover, in all sub-sectors of the higher education sector. Thus, factors pushing out the production frontier (such as the introduction of information technology and e-learning into universities) may have a detrimental effect on, or may be accompanied by a fall in, technical efficiency. For example, increased use of e-technology in teaching may allow class sizes to increase, or might have been adopted in response to class sizes. Yet an increasing ratio of students to staff may have an adverse effect on technical efficiency (for example, student achievement rates and research levels may be affected). The annual index of change (relative to
In order to assess the limitations of the analysis of the sector as a whole provided so far, an examination of the pattern of performance for two HEIs
performing at the extremes is reported in table 5. The ‘poor performer’ (i.e. an HEI with average Malmquist productivity change index in the lower quartile) which is above average in size (based on its inputs and outputs) has falling Malmquist productivity, and this is mainly a consequence of falling technical efficiency. The student-staff ratio change index and technology change index are at similar levels and follow a broadly similar pattern, as is the case for the sector as a whole. The pattern is different, however, for the ‘good performer’ (i.e. an HEI with an average Malmquist productivity change index in the upper quartile). Malmquist productivity for this HEI, which is a little below average size (based on its inputs and outputs) is a consequence of general increases in both technical efficiency and technology, and the student-staff ratio change index is less closely related to the technology change index, particularly since 2001/02, than is the case for the sector as a whole. Clearly the changing student-staff ratio in the English higher education sector can only offer a partial explanation for the observed increase in the technology change index (and decrease in the technical efficiency change index), and further research is necessary to examine this issue at the level of individual HEIs.
Table 5
5. Conclusion
This study has used DEA and distance functions to derive Malmquist
productivity change indexes for the English higher education sector over the period 1996/97 to 2004/05. The Malmquist productivity change indexes have been
decomposed into technical efficiency change indexes (which reveal whether HEIs are getting closer to the production frontier) and technology change indexes (which reveal whether the production frontier is moving outwards).
expansion in the higher education sector by changing their technology, they are doing so at the price of technical efficiency.
There have been some differences in performance across the subgroups of HEIs. SCOP and SCOP-type colleges have higher overall and scale efficiency, on average, than pre-1992 HEIs, and this difference is significant. All three subgroups have experienced negative technical efficiency change and positive technology change. But post-1992 HEIs and SCOP and SCOP-type colleges have experienced higher
technology change indexes than pre-1992 HEIs. Once more, this difference is significant.
A further examination of the productivity indexes reveals that, with the
exception of 2001/02, the technology change index has generally moved in a similar pattern to the index of change in the student-staff ratio for the sector as a whole. This is also the case for pre- and post-1992 HEIs, but is not so for the SCOP colleges. So, while changes in teaching practices to accommodate increasing student numbers in the pre- and post-1992 HEIs may partially account for the increase in technology change (i.e. the pushing out of the production frontier), this is clearly not the case for all institutions. Moreover, the decrease in technical efficiency occurring
simultaneously with the increasing technology is a worrying observation, and suggests that institutions need time to adapt to the changing technology.
References
Abbott, M. & Doucouliagos, C. (2003). “The efficiency of Australian universities: a data envelopment analysis” Economics of Education Review, Vol. 22, No. 1, pp89-97.
Athanassopoulos, A. D. & Shale, E. (1997). “Assessing the comparative efficiency of higher education institutions in the UK by means of data envelopment analysis” Education Economics, Vol. 5, No. 2, pp117-134.
Casu, B., Girardone, C. & Molyneux, P. (2004). “Productivity change in European banking: a comparison of parametric and non-parametric approaches” Essex Finance Centre Discussion Paper 04-01.
Coelli, T., Rao, D. S. P. & Battese, G. E. (1998). An Introduction to Efficiency and Productivity Analysis, Kluwer Academic, Norwell, MA.
Department for Education and Science (2003), The Future of Higher Education, White Paper. http://www.dfes.gov.uk/hegateway/strategy/hestrategy/pdfs/DfES-HigherEducation.pdf.
Department for Education and Science (2005). Harnessing Technology: Transforming Learning and Children’s Services.
Färe, R., Grosskopf, S. & Norris, M. (1997). “Productivity growth, technical progress and efficiency change in industrialized countries: reply” American Economic Review Vol. 87, No. 5, pp1040-1043.
Färe, R., Grosskopf, S., Norris, M. & Zhang, Z. (1994). “Productivity growth, technical progress and efficiency change in industrialized countries” American Economic Review Vol. 84, No. 1, pp66-83.
Färe, R., Grosskopf, S. & Weber, W. L. (1989). “Measuring school district performance” Public Finance Quarterly, Vol. 17, No. 4, pp409-428.
Farrell, M. (1957). “The measurement of productive efficiency” Journal of the Royal Statistical Society Series A, Vol. 120, pp253-281.
Flegg, A. T. & Allen, D. O. (2007) “Does expansion cause congestion? the case of the older British universities, 1994-2004” Education Economics, Vol. 15, No. 1m pp75-102.
Flegg, A. T., Allen, D. O., Field, K. & Thurlow, T. W. (2004). “Measuring the efficiency of British universities: a multi-period data envelopment analysis” Education Economics Vol. 12, No. 3, pp231-249.
Glass, J.C., McCallion, G., McKillop, D.G., Rasaratnam, S. & Stringer, K.S. (2006) “Implications of variant efficient measures for policy evaluations in UK higher education” Socio-Economic Planning Sciences, Vol. 40, pp119-142.
Grifell-Tatjé, E. & Lovell, C. A. K. (1995). “A note on the Malmquist productivity index” Economics Letters, Vol. 47, pp169-175.
Grifell-Tatjé, E. & Lovell, C. A. K. (1996). “Deregulation and productivity decline: the case of Spanish savings banks”, European Economic Review, Vol. 40, pp1281-1303.
Higher Education Statistics Agency (1994/95-2005/06). Resources of Higher Education Institutions, Cheltenham.
http://www.hesa.ac.uk/index.php?option=com_datatables&Itemid=121&task=sh ow_category&catdex=1.
Higher Education Statistics Agency (1994/95-2005/06). Students in Higher Education Institutions, Cheltenham.
http://www.hesa.ac.uk/index.php?option=com_datatables&Itemid=121&task=sh ow_category&catdex=3.
Johnes, G. & Johnes, J. (2005) “Higher education institutions’ costs and efficiency: taking the decomposition a further step” Lancaster University Working Paper, 2005/064. http://www.lums.lancs.ac.uk/publications/viewpdf/003052/.
Johnes, J. (2004). “Efficiency measurement” in G. Johnes and J. Johnes (eds). The International Handbook on the Economics of Education, Edward Elgar, Cheltenham.
Johnes, J. (2006). “Data envelopment analysis and its application to the measurement of efficiency in higher education” Economics of Education Review, Vol. 25, No. 3, pp273-288.
Ray, S. C. & Desli, E. (1997). “Productivity growth, technical progress and efficiency change in industrialized countries: comment” American Economic Review Vol. 87, No. 5, pp1033-1039.
Worthington, A.C. (2001). “An empirical survey of frontier efficiency measurement techniques in education” Education Economics, Vol. 9, No. 3, pp245-268. Worthington, A. C. & Lee, B. L. (2007). “Efficiency, technology and productivity
Figure 1: An illustration of the distance function approach to measuring efficiency and productivity
y
Ft+1
Ft
x Pt
Pt+1
xt xt+1
yt
yt+1
t t
y 1
+
t t y
0
1 1
+ +
t t y
t t
Table 1: Definitions of inputs and outputs
Variable name Definition Inputs:
STAFF The number of full-time academic staff plus 0.5 times the number of part-time academic staff
ADMIN1 Expenditure on total administration and central services including expenditure on staff and student facilities (including, for example, Careers Advisory Service, all grants to student societies,
emoluments to wardens of halls of residence, accommodation office, athletic and sporting facilities, excluding maintenance, and the institution’s health service) and general educational expenditure.
ACSERV1 Expenditure incurred on centralised academic services such as the library and learning resource centres, central computer and
computer networks, centrally run museums, galleries and observatories, and any other general academic services.
UG The total number of FTE first degree and other undergraduates. The ‘other undergraduates’ category includes qualification aims below degree level such as Foundation Degrees and Higher National Diploma (HND)2
PG The total number of FTE postgraduate students (i.e. students on programmes of study leading to higher degrees, diplomas and certificates, including Postgraduate Certificate of Education (PGCE) and professional qualifications)
Outputs
UGOUTPUT The number of first degree and other undergraduate qualifications awarded (see definition of UG)
PGOUTPUT The number of higher degree qualifications plus total other postgraduate qualifications awarded (including doctorate, other higher degrees, PGCEs and other postgraduate qualifications)
RESEARCH1 Income received in funding council grants plus income received in research grants and contracts (in thousands)
Note:
1. These variables are deflated to January 2003 values using the higher education pay and prices index (http://www.universitiesuk.ac.uk/statistics/heppi/default.asp). 2. A full description of students included in these categories can be found in the HESA data documentation.
Table 2: Descriptive statistics for the inputs and outputs (All years) ALL
n = 9x112
ALL n = 112
Pre-1992 HEIs n = 9x48
Pre-1992 HEIs n = 48
Variable Mean CV Min Max Mean
1996/97
Mean 2004/05
Mean CV Min Max Mean
1996/97
Mean 2004/05 STAFF 941.82 99.68 24.00 7634.00 845.05 1325.67 1409.00 84.71 37.50 7634.00 1262.71 1953.91 ADMIN 12421.41 71.75 466.89 64352.47 10437.45 14928.07 15767.72 66.84 466.89 64352.47 12827.67 19602.18 ACSERV 7256.23 86.60 124.15 41588.13 5926.74 8667.88 9667.79 78.52 124.15 41588.13 8178.99 11438.97 CAPITAL 6270.63 90.84 99.74 35869.90 5630.19 7171.94 8549.06 83.59 251.71 35869.90 6777.78 10778.09 UG 8510.70 65.79 170.00 24600.00 8052.85 9203.08 8045.59 64.33 205.00 24600.00 7298.92 9002.71 PG 1868.35 77.58 12.00 7930.00 1597.86 2198.30 2566.18 63.04 114.00 7930.00 2279.29 2918.23 UGOUTPUT 2514.86 68.74 20.00 8965.00 2215.33 2988.88 2242.32 67.50 20.00 7770.00 1970.02 2720.31 PGOUTPUT 1005.87 82.24 4.00 4645.00 719.57 1350.58 1382.68 65.12 20.00 4645.00 1021.73 1794.79 RESEARCH 55552.04 106.64 1104.15 322057.00 49530.50 62203.74 86101.82 88.87 3305.48 322057.80 76565.61 97040.89
Continued:
Post-1992 HEIs n = 9x34
Post-1992 HEIs n = 34
SCOPs n = 9x30
SCOPs n = 30
Variable Mean CV Min Max Mean
1996/97
Mean 2004/05
Mean CV Min Max Mean
1996/97
Mean 2004/05
STAFF 912.92 35.52 330.00 3151.00 828.47 1298.16 227.0 80.12 24.00 1207.50 195.6 351.67
Table 3: Efficiency over time
Approach 1: DEA applied to all HEIs
Overall technical efficiency Pure technical efficiency Scale efficiency All HEIs
Pre-1992 HEIs Post-1992 HEIs SCOP HEIs
All HEIs Pre-1992 HEIs Post-1992 HEIs SCOP HEIs
All HEIs Pre-1992 HEIs Post-1992 HEIs SCOP HEIs
Min No. eff HEIs Geom Mean Geom Mean Geom Mean Geom Mean
Min No. eff HEIs Geom Mean Geom Mean Geom Mean Geom Mean
Min No. eff HEIs Geom Mean Geom Mean Geom Mean Geom Mean
1996 0.666 46 0.923 0.904 0.915 0.960 0.723 62 0.953 0.951 0.942 0.970 0.802 47 0.968 0.951 0.971 0.993 1997 0.695 38 0.902 0.879 0.917 0.918 0.711 54 0.937 0.928 0.946 0.942 0.763 38 0.963 0.948 0.969 0.980 1998 0.677 43 0.915 0.892 0.910 0.958 0.688 60 0.950 0.936 0.958 0.964 0.807 43 0.963 0.953 0.950 0.996 1999 0.698 32 0.898 0.901 0.865 0.929 0.771 50 0.937 0.932 0.928 0.956 0.805 32 0.959 0.966 0.932 0.977 2000 0.479 30 0.866 0.849 0.866 0.889 0.696 51 0.927 0.922 0.912 0.953 0.479 30 0.934 0.921 0.950 0.937 2001 0.702 35 0.914 0.916 0.893 0.934 0.735 57 0.951 0.950 0.943 0.962 0.790 36 0.961 0.964 0.947 0.973 2002 0.652 28 0.876 0.875 0.848 0.910 0.710 49 0.923 0.933 0.898 0.935 0.830 28 0.949 0.937 0.944 0.974 2003 0.611 29 0.856 0.844 0.851 0.877 0.638 47 0.906 0.903 0.914 0.904 0.765 29 0.945 0.934 0.931 0.978 2004 0.547 23 0.815 0.772 0.831 0.863 0.714 48 0.911 0.908 0.920 0.907 0.690 24 0.894 0.849 0.904 0.960 All
years 0.884 0.869 0.877 0.919 0.933 0.929 0.929 0.943 0.948 0.935 0.944 0.974
Approach 2: DEA applied to each subgroup of institutions separately
Overall technical efficiency Pure technical efficiency Scale efficiency All HEIs
Pre-1992 HEIs Post-1992 HEIs SCOP HEIs
All HEIs Pre-1992 HEIs Post-1992 HEIs SCOP HEIs
All HEIs Pre-1992 HEIs Post-1992 HEIs SCOP HEIs
Min No. eff HEIs Geom Mean Geom Mean Geom Mean Geom Mean
Min No. eff HEIs Geom Mean Geom Mean Geom Mean Geom Mean
Min No. eff HEIs Geom Mean Geom Mean Geom Mean Geom Mean
1996 0.749 62 0.958 0.939 0.971 0.974 0.792 82 0.979 0.969 0.988 0.984 0.827 62 0.979 0.969 0.983 0.991 1997 0.765 65 0.956 0.947 0.975 0.949 0.792 79 0.975 0.969 0.986 0.971 0.805 65 0.981 0.977 0.988 0.978 1998 0.727 61 0.958 0.937 0.976 0.974 0.740 74 0.974 0.964 0.986 0.977 0.863 64 0.984 0.972 0.990 0.996 1999 0.805 69 0.967 0.972 0.968 0.957 0.831 83 0.980 0.982 0.979 0.976 0.859 69 0.987 0.990 0.989 0.981 2000 0.534 55 0.924 0.895 0.945 0.946 0.735 74 0.967 0.947 0.973 0.991 0.534 55 0.956 0.945 0.972 0.955 2001 0.764 63 0.964 0.965 0.962 0.963 0.825 82 0.979 0.979 0.980 0.978 0.764 63 0.984 0.986 0.982 0.985 2002 0.729 63 0.950 0.958 0.945 0.943 0.806 75 0.967 0.969 0.966 0.966 0.781 65 0.982 0.988 0.978 0.977 2003 0.715 58 0.940 0.916 0.958 0.960 0.770 75 0.965 0.950 0.974 0.980 0.828 58 0.974 0.964 0.984 0.980 2004 0.594 49 0.899 0.832 0.956 0.951 0.793 71 0.964 0.954 0.972 0.972 0.671 49 0.933 0.872 0.984 0.979 All
Table 4a: Geometric mean changes in technical efficiency, technology, Malmquist productivity, pure efficiency and scale efficiency relative to the base year (1996/97), across sample estimation
Malmquist productivity change index
Technology change index
Technical efficiency change index
Pure efficiency change index
Scale efficiency change index
Student-staff ratio change index ALL HEIs
1997/98 versus 1996/97 1.001 1.023 0.978 0.983 0.994 1.036
1998/99 versus 1996/97 1.007 1.015 0.992 0.997 0.995 1.010
1999/00 versus 1996/97 0.987 1.014 0.974 0.983 0.990 1.011
2000/01 versus 1996/97 1.017 1.084 0.937 0.973 0.965 0.955
2001/02 versus 1996/97 1.019 1.028 0.991 0.998 0.993 0.996
2002/03 versus 1996/97 1.039 1.095 0.949 0.968 0.980 1.023
2003/04 versus 1996/97 1.066 1.148 0.928 0.951 0.976 1.105
2004/05 versus 1996/97 0.958 1.085 0.884 0.958 0.924 1.092
All years 1.011 1.060 0.954 0.976 0.977 1.028
Pre-1992 HEIs
1997/98 versus 1996/97 0.992 1.020 0.972 0.976 0.996 1.047
1998/99 versus 1996/97 1.019 1.033 0.987 0.984 1.002 1.026
1999/00 versus 1996/97 1.004 1.009 0.996 0.980 1.016 1.022
2000/01 versus 1996/97 1.040 1.107 0.938 0.970 0.968 0.952
2001/02 versus 1996/97 1.014 1.001 1.013 0.999 1.014 0.991
2002/03 versus 1996/97 1.018 1.052 0.967 0.982 0.985 1.015
2003/04 versus 1996/97 1.026 1.100 0.933 0.950 0.982 1.169
2004/05 versus 1996/97 0.938 1.099 0.854 0.956 0.893 1.165
All years 1.006 1.052 0.956 0.974 0.981 1.046
Post-1992 HEIs
1997/98 versus 1996/97 1.019 1.016 1.004 1.004 0.999 1.063
1998/99 versus 1996/97 0.993 0.998 0.996 1.016 0.979 1.008
1999/00 versus 1996/97 0.968 1.023 0.947 0.985 0.960 1.000
2000/01 versus 1996/97 1.011 1.067 0.946 0.968 0.979 0.970
2001/02 versus 1996/97 1.018 1.043 0.976 1.000 0.976 0.973
2002/03 versus 1996/97 1.042 1.125 0.930 0.953 0.972 1.031
2003/04 versus 1996/97 1.106 1.188 0.930 0.970 0.959 1.130
2004/05 versus 1996/97 0.985 1.084 0.909 0.976 0.931 1.107
All years 1.017 1.066 0.954 0.984 0.969 1.034
SCOP and SCOP type colleges
1997/98 versus 1996/97 0.994 1.037 0.960 0.972 0.987 0.988
1998/99 versus 1996/97 1.003 1.006 0.997 0.995 1.003 0.990
1999/00 versus 1996/97 0.983 1.013 0.971 0.986 0.984 1.009
2000/01 versus 1996/97 0.988 1.065 0.927 0.983 0.944 0.944
2001/02 versus 1996/97 1.027 1.055 0.974 0.992 0.980 1.033
2002/03 versus 1996/97 1.069 1.130 0.945 0.964 0.981 1.026
2003/04 versus 1996/97 1.085 1.182 0.918 0.932 0.985 0.985
2004/05 versus 1996/97 0.960 1.062 0.905 0.936 0.967 0.971
Table 4b: Geometric mean changes in technical efficiency, technology, Malmquist productivity, pure efficiency and scale efficiency relative to the base year (1996/97), within-subgroup estimation
Malmquist productivity change index
Technology change index
Technical efficiency change index
Pure efficiency change index
Scale efficiency change index ALL HEIs
1997/98 versus 1996/97 1.002 1.004 0.998 0.996 1.002
1998/99 versus 1996/97 1.012 1.011 1.001 0.996 1.005
1999/00 versus 1996/97 0.993 0.983 1.009 1.001 1.008
2000/01 versus 1996/97 1.020 1.058 0.964 0.988 0.976
2001/02 versus 1996/97 1.019 1.013 1.006 1.000 1.005
2002/03 versus 1996/97 1.035 1.044 0.992 0.989 1.003
2003/04 versus 1996/97 1.071 1.091 0.981 0.986 0.995
2004/05 versus 1996/97 0.982 1.047 0.939 0.985 0.953
All years 1.016 1.031 0.986 0.993 0.993
Pre-1992 HEIs
1997/98 versus 1996/97 0.992 0.983 1.009 1.000 1.008
1998/99 versus 1996/97 1.021 1.023 0.998 0.995 1.003
1999/00 versus 1996/97 0.998 0.964 1.035 1.014 1.021
2000/01 versus 1996/97 1.040 1.091 0.953 0.978 0.975
2001/02 versus 1996/97 1.005 0.979 1.027 1.010 1.017
2002/03 versus 1996/97 1.017 0.997 1.020 1.000 1.020
2003/04 versus 1996/97 1.023 1.049 0.975 0.981 0.994
2004/05 versus 1996/97 0.935 1.056 0.886 0.984 0.900
All years 1.003 1.017 0.987 0.995 0.991
Post-1992 HEIs
1997/98 versus 1996/97 1.010 1.006 1.004 0.998 1.005
1998/99 versus 1996/97 1.010 1.004 1.005 0.998 1.007
1999/00 versus 1996/97 0.976 0.978 0.997 0.991 1.006
2000/01 versus 1996/97 0.998 1.025 0.974 0.985 0.989
2001/02 versus 1996/97 1.011 1.020 0.991 0.991 1.000
2002/03 versus 1996/97 1.026 1.054 0.973 0.978 0.995
2003/04 versus 1996/97 1.107 1.122 0.986 0.985 1.001
2004/05 versus 1996/97 1.015 1.032 0.984 0.983 1.001
All years 1.018 1.029 0.989 0.989 0.995
SCOP and SCOP type colleges
1997/98 versus 1996/97 1.009 1.037 0.974 0.987 0.987
1998/99 versus 1996/97 0.999 0.999 1.000 0.994 1.006
1999/00 versus 1996/97 1.004 1.022 0.983 0.992 0.990
2000/01 versus 1996/97 1.014 1.044 0.971 1.007 0.964
2001/02 versus 1996/97 1.050 1.062 0.989 0.995 0.994
2002/03 versus 1996/97 1.075 1.111 0.968 0.982 0.986
2003/04 versus 1996/97 1.112 1.127 0.985 0.997 0.989
2004/05 versus 1996/97 1.024 1.050 0.976 0.988 0.988
Table 5: Geometric mean changes in technical efficiency, technology and student-staff ratio relative to the base year (1996/97) – two HEIs performing at the extremes
Malmquist productivity change index
Technology change index
Technical efficiency change index
Student-staff ratio change index HEI with poor productivity performance
1997/98 versus 1996/97 0.980 1.020 0.970 1.049
1998/99 versus 1996/97 0.860 0.990 0.870 1.111
1999/00 versus 1996/97 0.730 0.980 0.750 1.082
2000/01 versus 1996/97 0.780 1.010 0.780 1.022
2001/02 versus 1996/97 0.770 1.010 0.760 1.033
2002/03 versus 1996/97 0.730 1.050 0.700 0.957
2003/04 versus 1996/97 0.770 1.080 0.710 1.097
2004/05 versus 1996/97 0.700 1.100 0.640 1.065
HEI with good productivity performance
1997/98 versus 1996/97 1.040 1.010 1.030 0.992
1998/99 versus 1996/97 1.030 1.010 1.020 0.905
1999/00 versus 1996/97 1.110 1.080 1.030 1.023
2000/01 versus 1996/97 1.330 1.090 1.220 1.050
2001/02 versus 1996/97 1.320 1.080 1.220 1.079
2002/03 versus 1996/97 1.540 1.260 1.220 1.017
2003/04 versus 1996/97 1.520 1.250 1.220 1.129