http://dx.doi.org/10.4236/cs.2016.77094
Optimization and Design of PV-Wind Hybrid
System for DC Micro Grid Using NSGA II
R. Sathishkumar, V. Malathi, V. Premka
Department of Electrical and Electronics Engineering, Anna University Regional Campus Madurai, Madurai, India
Received 21 March 2016; accepted 24 May 2016; published 27 May 2016
Copyright © 2016 by authors and Scientific Research Publishing Inc.
This work is licensed under the Creative Commons Attribution International License (CC BY).
http://creativecommons.org/licenses/by/4.0/
Abstract
The world is heading towards renewable energy, but the two key disputes that stop its well-known adoption are the power production level and the price of the production. Distributed generation (DG), and hybrid systems with battery backup are the solution for uninterrupted power supply. It is obtained using the Multi-Objective Genetic Algorithm (NSGA II). Techno-economic methodology is used in this proposed system for the size optimization. The result is based on the system cost, in order to meet the load requirements. The effect of temporal sampling is optimized using low-rate temporal data. It is compared with hybrid DC microgrid, which has been optimized using high temporal resolution data.
Keywords
Microgrid, Optimization, Photovoltaic, Wind Turbine, Storage System, Genetic Algorithm, NSGA II
1. Introduction
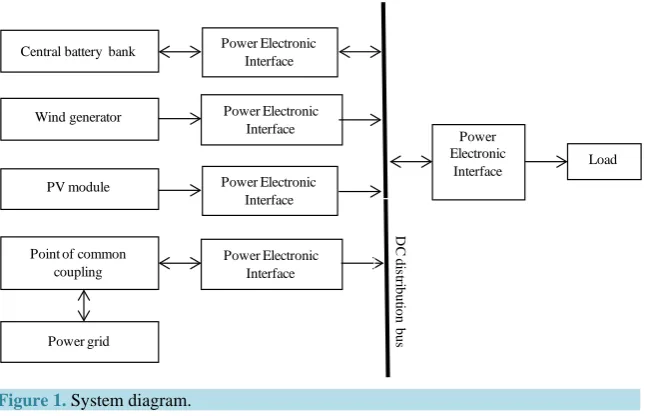
DC distribution systems have been making popularity owing to the high efficiency of power supply and high re-liability in operation. The renewable energy sources interconnect with utility grid due to improved energy de-mand and decreasing fossil energies. Very random and intermittent power is generated using RES. Renewable energy sources along with storage system gives a continuous power supply. PV, wind generation and battery storage system in a DC microgrid system are illustrated in Figure 1. To avoid integration problems present in the hybrid energy systems, DC distribution system is the one way of solution [1][2]. Usage of renewable energy improves because conventional sources are depleting rapidly. Anyway, two main limits exist: power production and cost of apparatus. DC schemes are becoming more and more important due to the high effectiveness, com-pared to AC systems [3][4].
Figure 1. System diagram.
surplus power and provide beneath varied in operational conditions. The considered analysis has been formerly used for evaluating standalone distributed photovoltaic systems [5]. Zonal DC microgrids along with solid state transformer (SST) integrate with microgrids. The solid-state transformer using the dc and ac links which pro-vides the coordinate power management is discussed in [6]. The islanded hybrid scheme is implemented in [7] [8], suitable to the chance actions of the solar insolation and wind energy; sizing of the renewable sources is the worldly resolution of composed data to pay for satisfactory results [9], especially on gloomy times. Multi- Objective Genetic Algorithm (MOGA) [10]-[12] is capable to take benefit for renewable sources alternatively of trusting only on numerical models. Microgrid is the solution for electrifying the remote areas and rural areas. Generation and storage blocks for each system which are sized in a proper way to meet the yearly load and mi-nimize the overall cost for the systems have been proposed in [13]-[15]. In [16], a hybrid WG/ PV/FC system is planned for a 20-year period of process. A hydrogen tank is used as the storage system. Particle Swarm Optimi-zation (PSO) is applied for this optimiOptimi-zation. In [17] a potential solution has been examined to alter PV power plants to get in the electricity markets, when reducing the extra costs deduced from the launching of an energy storage system.
The main improvement of this paper is to regulate the sizing and cost of the system; the overall system is shown in Figure 1.
The problem is initially conceived based on MOGA technique. Pareto front is used for the function of engi-neering tradeoff. Effectiveness function is to solve problems of the multi-objective difficulty, insecurity study, unpredictable nature of the wind speed and insolation. Applying MOGA as the optimization technique, studying elevated temporal resolution insolation data indicates that the system convenience is increased for buck potential price balancing to formal hybrid system sizing [18]. The system is employed to minimize the excess capacity to use high resolution insolation data for PV system. Techno-economic principle also used to ensure a reliable energy supply with lowest investment has been proposed in [19][20]. In this paper mathematical modeling of the various system components will be discussed. Then, the model becomes more realistic, when the system re-gards the financial aspects such as price increases, interest, and growth will be added.
2. Mathematical Model
The objectives of the system are mathematically expressed for optimization. The highest priority to feed the DC bus has the output power of PV and wind generator. If the inadequate power generation, the storage system can be discharged to a certain amount of power to feed the DC bus. Then, a certain quantity of power obtained from grid to supply the load, if there is still lacking power. Hence, the lowest priority is the imported power from grid. In this research purpose, two objective functions are viewed, one is for system cost and another one is for power availability and these are considered as two separate single objectives. The minimization of system cost incor-porates initial cost and operational & maintenance cost are used as the first objective. This is given by Equation. (1),
Central battery bank
Wind generator
PV module
Power Electronic Interface
Point of common coupling
Power grid
Power Electronic Interface
Power Electronic Interface
Power Electronic Interface
Power Electronic
Interface Load
D
C di
st
ri
but
ion
(
PV, Wind, Cap ,)
minimi e
a z
B tt
A A P
Cost Ψ (1)
Maximization of power availability is considered as second objective. This given by Equation (2),
(
PV, Wind, ,)
maximi Ca z at e pB t
A A P
A Ψ (2)
where,
APV is the PV surface area.
AWind is the wind footprint area.
PCapBatt is the battery capacity.
Ѱ is the ratio of power imported from grid.
2.1. Cost
The system price comprises of the price of PV panels, battery bank and wind turbines. The total system price ($/year) admits initial price and operational & maintenance price, developed as,
(
)
, , i i
i PV Wind Batt Grid
I OM
Cost C
N
= +
= +
∑
(3)where,
CGrid is price of power from grid;
N is the life cycle of the scheme;
Ii is the initial price of the scheme;
OMi is the operational & maintenance price.
2.2. Availability
The facility of the system to provide power to the load called as availability. The availability can be developed for duration under condition T as,
1
A DNM
D
= − (4)
( )
( )
(
( )
( )
( )
( )
)
( )
(
)
1 * MIN SOC TBatt Batt PV wind Grid D
t
DNM P t P t P t P t P t P t u t
=
=
∑
− − + + − (5)where,
A is the index of availability;
DNM is the demand not met (kWh/year);
PBattMIN is the minimum allowable storage level at time;
PBattSOC is the state of charge of battery bank at time t.
2.3. System Constraints
The chance of getting accurate results from of any optimization problem is depending upon the consideration of all influencing parameters as constraints. The constraints available in this problem are identified and listed as follows.
The available area for PV panels and wind generators installation limit,
PVMin PV PVMax
A <A <A (6)
windMin wind windMax
A <A <A (7)
The imported power from the grid limit,
GridMin Grid GridMax
P <P <P (8)
0< Ψ <1
( )
( )
( )
( )
( )
PV Wind Batt Grid D
P t +P t +P t +P t ≤P t (9)
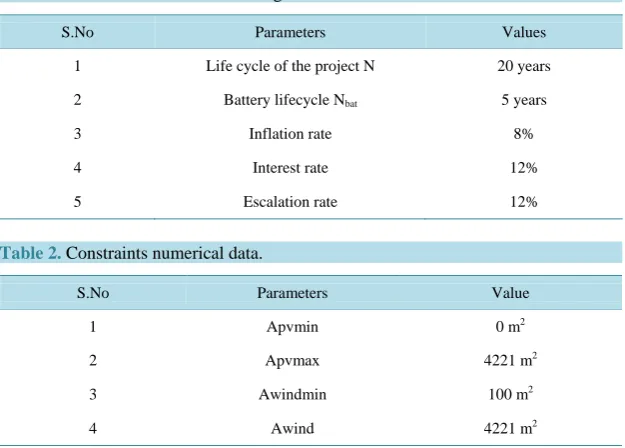
To improve system performance insecurity analysis must be zero, the lower limit for wind turbines is selected to be about 100 m2. The numerical values of design constraints are taken from Table 1.
The wind parameters and numerical values are shown in Table 2.
The total generated power must be less than the demand in order to dodge high sizing the system and totaling exorbitant cost.
3. NSGA II Optimization for the Proposed System
The Genetic algorithm is an evolutionary artificial intellect method that adopted as a soft computing tool in var-ious applications, incorporating engineering, science and commerce. It having the following steps: the codifica-tion of individuals, populacodifica-tion creacodifica-tion, estimacodifica-tion, crossover, mutacodifica-tion and seleccodifica-tion. A key element of NSGA-II is the concept of domination, according to which a solution P1 is said to dominate another solution P2 in an M objective functions problem, if both of the following conditions are true:
i) The solution P1 is not worse than solution P2 in all objectives, or
ii) The solution P1 is strictly better than solution P2 in at least one objective or
If either of these conditions is not true, the solution P1 does not dominate the solution P2, or P2 is non- dominated by P1. If both of the conditions are true, solution P1 does dominate solution P2, or P2 is dominated by P1.
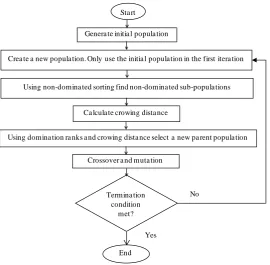
The consequences of optimization explain as a pair of non-dominated results, known as Pareto front. MOGA treats GA as its two crucial novel techniques in order to attain good multi-objective optimization. These two new developments are crowding distance and non-dominated sorting. By applying pair of methodologies GA and MOGA algorithm has made, known as Non-dominated Sorting Genetic Algorithm-II. A process is executed with the smallest rank and then results with the next smallest rank and this process will continue up to get op-timal solution. This procedure extends until the number of results in the parent population advances N. To find the next offspring population crossover and mutation operators are executed. The design procedure, the latitude and the meteorological conditions are the most important conditions are the geographical location. Hence, the design procedure in the first step is to determine the geographical location.
[image:4.595.157.470.492.716.2]Based on the location, to find the evaluations for the wind generator and PV array conditions such as weather data and usable wind and solar resources are used. For the objective functions the available roof area, desired lifetime, and desired availability of power and maximum imported power from the grid limits are considered as design constraints. Finally, by using the optimization procedure illustrated in Figure 2, the Pareto Front is found
Table 1. The numerical values of design constraints.
S.No Parameters Values
1 Life cycle of the project N 20 years
2 Battery lifecycle Nbat 5 years
3 Inflation rate 8%
4 Interest rate 12%
5 Escalation rate 12%
Table 2. Constraints numerical data.
S.No Parameters Value
1 Apvmin 0 m2
2 Apvmax 4221 m2
3 Awindmin 100 m2
Figure 2.Optimization procedure for proposed system using NSGA II.
using a pair of similarly good results that increase the accessibility of power production and reduces the overall cost of the hybrid system. Thus, the Pareto Front to desire the exclusive plan from the set of viable designs based on particular tendency that enables engineering tradeoff analysis. Unpredictable nature of solar and wind, the uncertainty analysis is added.
4. Results and Discussion
In this paper the system analysis is done for two sections: Not Considering uncertainty and considering uncer-tainty. The case “value function” means the under certainty and the condition “utility function” means a under uncertainty. Objectives and attributes are used as methods for designing the utility function, also permanent al-lotment will completed. The availability and cost are the attributes in this paper. Attribute space to a utility value an n-dimensional as follow,
( )
U=u z (10)
[
]
Z = cost A (11)
Which allow the ranking of alternatives, then modify all parameters to same size, often called “pricing out”. The hybrid system optimization, general form of value function is given by,
(
,)
1(
(
)
(
(
)
)
)
2( )
(
( )
( )
)
Cost Min Cost A Min A
u Cost A
Max Cost Min Cost Max A Min A
λ − λ −
= −
− − (12)
where the weighing factors are λ1 and λ2 this done by the developer. For the DC distribution systems the
developer are indifferent from the accessibility and price, where λ1=λ2.
The two cases are shown in Table 3; in case 1, λ1 is accepted to be equal to λ2, here the cost and
availabil-ity are an indifferent. In case 2, additional weight is added to the price than availabilavailabil-ity u Cost A
(
,)
in the utili-ty. As required review of the optimal solutions of the Pareto Front of the system Figure 3, exposes that the of the system cost increased significantly. This section resembles the proposed modeling strategy of the DC micro-grid with decision data to standard sizing strategy based on hourly National Solar Radiation Database (NSRDB). The unmet demand can be further decreased in the utility function by adjusting the weighting factor of avail-Sta rt
Genera te initia l popula tion
Crea te a new popula tion. Only use the initia l popula tion in the first itera tion
Using non-domina ted sorting find non-domina ted sub-popula tions
Ca lcula te crowing dista nce
Crossover a nd muta tion
Termina tion condition
met?
Using domina tion ra nks a nd crowing dista nce select a new pa rent popula tion
Yes
No
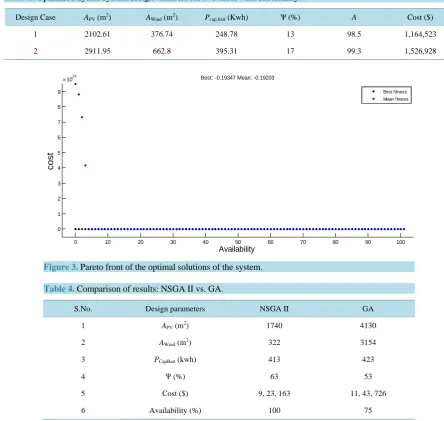
Table 3. Optimized hybrid system design variables for two cases with uncertainty.
Design Case APV (m2) AWind (m2) Pcap,batt (Kwh) Ѱ (%) A Cost ($)
1 2102.61 376.74 248.78 13 98.5 1,164,523
2 2911.95 662.8 395.31 17 99.3 1,526,928
Figure 3.Pareto front of the optimal solutions of the system.
Table 4. Comparison of results: NSGA II vs. GA.
S.No. Design parameters NSGA II GA
1 APV (m2) 1740 4130
2 AWind (m2) 322 3154
3 PCapBatt (kwh) 413 423
4 Ѱ (%) 63 53
5 Cost ($) 9, 23, 163 11, 43, 726
6 Availability (%) 100 75
ability and cost. The proposed modeling increases availability of DC microgrid as load so it reduces the overall system price. Operationally, this intends the system enhances comfortable to transmit and control. Cram the ability of a smart grid communication system, the surplus power produced, which is “exporting” added to the utility grid. The Table 4 gives the information about various design parameters and results from NSGA II.
Comparison of NSGA II vs. GA
NSGA II results are matched to the GA results and it’s shown in Table 4. The design parameters are optimized applying the NSGA II. These results are compared to the GA. From the result, the sizing of the system parame-ters cost was decreased and the same time power availability will increase than the GA.
5. Conclusion
The proposed system considers over sizing the system for an eminent percentage of availability by applying ac-curate and raised high temporal resolution data. The main goal is to attain a common representation that meas-ures the availability and cost of renewable energy systems for DC microgrid. High temporal data are achieved in the proposed system, which is utilized to improve the hybrid system based on Multi-Objective Genetic Algorithm
0 10 20 30 40 50 60 70 80 90 100
0 1 2 3 4 5 6 7 8 9
x 1024
Availability
co
st
Best: -0.19347 Mean: -0.19203
Best fitness Mean fitness
(NSGA II). The results of NSGA II are compared with GA results; cost is reduced rapidly in NSGA II method. The Pareto Front is used for better results in MOGA. Final optimal solution is achieved by availability and cost function. The optimization is made for the case without uncertainty on an available resource. This proposed anal-ysis gives a reliable energy supply with the lowest investment.
References
[1] Xu, L. and Chen, D. (2011) Control and Operation of a DC Microgrid with Variable Generation and Energy Storage.
IEEE Transactions on Power Delivery, 26, 2513-2522. http://dx.doi.org/10.1109/TPWRD.2011.2158456
[2] Baochao, W., Sechilariu, M. and Locment, F. (2012) Intelligent DC Microgrid with Smart Grid Communications: Control Strategy Consideration and Design. IEEE Transaction on Smart Grid, 3, 2148-2156.
http://dx.doi.org/10.1109/TSG.2012.2217764
[3] Zhang, P., Wang, Y., Xiao, W.D. and Li, W.Y. (2012) Reliability Evaluation of Grid-Connected Photovoltaic Power Systems. IEEE Transactions on Sustainable Energy, 3, 1949-3029. http://dx.doi.org/10.1109/tste.2012.2186644
[4] Majumder, R. (2014) A Hybrid Microgrid with DC Connection at Back to Back Converters. IEEE Transaction on Smart Grid, 5, 251-259. http://dx.doi.org/10.1109/TSG.2013.2263847
[5] Kimball, J.W., Kuhn, B.T. and Balog, R.S. (2009) A System Design Approach for Unattended Solar Energy Harvest-ing Supply. IEEE Transactions on Power Electronics, 24, 952-962. http://dx.doi.org/10.1109/TPEL.2008.2009056
[6] Xu, S., Huang, A.Q., Lukic, S. and Baran, M.E. (2012) On Integration of Solid-State Transformer with Zonal DC Mi-crogrid. IEEE Transaction on Smart Grid, 3, 975-985. http://dx.doi.org/10.1109/TSG.2012.2187317
[7] Bidram, A. and Davoudi, A. (2012) Hierarchical Structure of Microgrids Control System. IEEE Transaction on Smart Grid, 3, 1963-1976. http://dx.doi.org/10.1109/TSG.2012.2197425
[8] Heydt, T. (2010) The Next Generation Of Power Distribution Systems. IEEE Transactions on Smart Grid, 1, 225-235.
http://dx.doi.org/10.1109/TSG.2010.2080328
[9] Balog, R., Shadmand, M.B. and Pasupuleti, M. (2011) Photovoltaic-Wind Hybrid System with Battery Back-Up Opti-mized for Apartment Complexes and Other Community Living Environments. IEEE Transaction on Energy Conver-sion Congress and Exposition (ECCE), 26, 3626-3632.
[10] Gao, Y., Shi, L. and Yao, P.J. (2000) Study on Multi-Objective Genetic Algorithm. Proceedings of the 3rd World Congress onIntelligent Control and Automation, 1, 646-650.
[11] Zitzler, E., Deb, K. and Thiele, L. (2000) Comparison of Multiobjective Evolutionary Algorithms: Empirical Results.
IEEE Transactions on Evoluationary Computation, 8, 173-195. http://dx.doi.org/10.1162/106365600568202
[12] Deb, K., Pratap, A., Agarwal, S. and Meyarivan, T. (2002) A Fast and Elitist Multiobjective Genetic Algorithm: NSGA-II. IEEE Transactions on Evoluationary Computation, 6, 182-197. http://dx.doi.org/10.1109/4235.996017
[13] Kellogg, W.D., Nehrir, M.H., Venkataramanan, G. and Gerez, V. (1998) Generation Unit Sizing and Cost Analysis for Stand-Alone Wind, Photovoltaic, and Hybrid Wind/PV Systems. IEEE Transaction on Energy Conversion, 13, 70-75.
http://dx.doi.org/10.1109/60.658206
[14] Sanchez, V., Ramirez, J.M. and Arriaga, G. (2005) Optimal Sizing of a Hybrid Renewable System. IEEE Transactions on Renewable Energy, 30, 493-517.
[15] Yang, H.X., Zhou, W. and Lou, C.Z. (2009) Optimal Design and Techno-Economic Analysis of a Hybrid Solar-Wind Power Generation System. IEEE Transactions on Applied Energy, 86, 163-169.
http://dx.doi.org/10.1016/j.apenergy.2008.03.008
[16] Kashefi Kaviani, A., Riahy, G.H. and Kouhsari, Sh.M. (2009) Optimal Design of a Reliable Hydrogen-Based Stand- Alone Wind/PV Generating System, Considering Component Outages. IEEE Transactions on Renewable Energy, 34, 2380-2390. http://dx.doi.org/10.1016/j.renene.2009.03.020
[17] Beltran, H., Perez, E., Aparicio, N. and Rodriguez, P. (2013) Daily Solar Energy Estimation for Minimizing Energy Storage Requirements in PV Power Plants. IEEE Transaction on Sustainable Energy, 4, 474-481.
http://dx.doi.org/10.1109/TSTE.2012.2206413
[18] Sa, X., Nchez, V., Ramirez, J.M. and Arriaga, G. (2010) Optimal Sizing of a Hybrid Renewable System. 2010 IEEE International Conference on Industrial Technology (ICIT), 14-17 March 2010, 949-954.
[19] Shadmand, M.B. and Balog, R.S. (2014) Predicting Variability of High-Penetration Photovoltaic Systems in a Com-munity Microgrid by Analyzing High-Temporal Rate Data. IEEE Transaction on Sustainable Energy, 17, 379-389. [20] Cheng, Y.H. (2012) Smart Micro-Grids Enable Seamless Interconnection and Disconnection for High Reliability and
Flexibility in Distributed Power Generation. IEEE Transaction on Smart Grid, 5, 418-427.