Munich Personal RePEc Archive
A Review of Turkish Natural Gas
Distribution Market
Erdogdu, Erkan
Cambridge University, UK, Energy Market Regulatory Authority,
Republic of Turkey
2009
A review of Turkish natural gas distribution market
Erkan Erdogdua,b,c,*
a
Energy Market Regulatory Authority, Ziyabey Cad. No:19 06520 Balgat/Ankara TURKEY
b
University of Cambridge, Judge Business School, Trumpington Street, Cambridge, CB2 1AG, UK
Abstract
In Turkey, natural gas consumption started at 0.5 bcm (billion cubic meters)
in 1987 and reached approximately 35 bcm in 2007. Turkish natural gas
usage is projected to further increase remarkably in coming years. In 2001, a
reform process was started to create and strengthen a competitive natural
gas market. However, the reform has not worked out as expected so far. The
present article discusses the application of auctions in Turkish natural gas
distribution zones. After presenting a short summary of current literature,
natural gas utilization and recent developments in Turkish natural gas
*Corresponding author. Tel.: +90-312-2872560 Fax: +90-506-3237325
E-mail:erkan@erdogdu.net
URL:http://erkan.erdogdu.net
c
The author works as an Energy Expert at Energy Market Regulatory Authority of the
Republic of Turkey. In October 2005, the author is awarded an “MSc with distinction” in
“Energy Economics and Policy” by the Department of Economics, University of Surrey (UK).
In October 2009, the author started his PhD studies at Judge Business School of Cambridge
University (UK). The views, findings and conclusions expressed in this article are entirely
market, we draw attention to our main focus, namely city natural gas tenders.
Having described the tenders, we present problems associated with them. In
the end, we touch upon some regulatory issues and provide some
suggestions for improvement.
Keywords:Natural gas distribution, auction, Turkey
1. Introduction
Prevalence of market failures requires a significant element of regulation in
natural gas networks. The main question for regulators is how to determine
optimal prices and investment levels. Information is asymmetric between
regulators and companies, and there are no obvious comparators. The
regulatory task is therefore to break this information monopoly to determine
the optimum. A novel and potentially rich source of such information is to use
auctions, and it has become fashionable to extend auctions into networks.
The literature on Turkey’s natural gas market in general and natural gas
distribution tenders in particular is very limited, with the exception of some
International Energy Agency (IEA) and Organization for Economic
Cooperation and Development (OECD) studies. To the best of our
knowledge, so far, there has been almost no study on either Turkish natural
gas market or city natural gas distribution tenders in Turkey, which are
usually discussed within the general context of energy markets. From a
practical point of view, the lack of extensive discussions of the issue is one of
the driving forces of this paper. In this context, one of our goals is to provide
problems associated with tenders for Turkish natural gas distribution regions.
Besides, from an academic perspective, this topic is also appealing because
the method (or auction model) developed to determine the tariffs of natural
gas distribution regions of Turkey is unique and never employed before
anywhere in the world. What is more is that the results of this specific model
is also exceptional as in some regions firms accepted to set up all natural gas
distribution infrastructure totally from their own sources and provide gas to
consumers without any profit, challenging the very basic assumption of the
science of economics, that is “firms are profit seeking agents”. Since it is
obvious that these tenders will have important implications for the future of
the country, the present paper will be an important contribution not only to the
existing literature but also to the energy policy formulation process in Turkey.
The paper begins with a presentation of recent natural gas market
developments in Turkey (Section 2). To see what role auctions might play, a
brief summary of economic fundamentals is provided (Section 3). A critical
analysis of natural gas distribution tenders is also presented (Section 4)
Following tentative guidelines for policy makers (Section 5), conclusions are
drawn (Section 6) in the final part.
2. Recent developments in Turkish natural gas market
In Turkey, natural gas began to be used for residential and commercial
purposes in Ankara in 1988, and continued with Istanbul and Bursa in 1992,
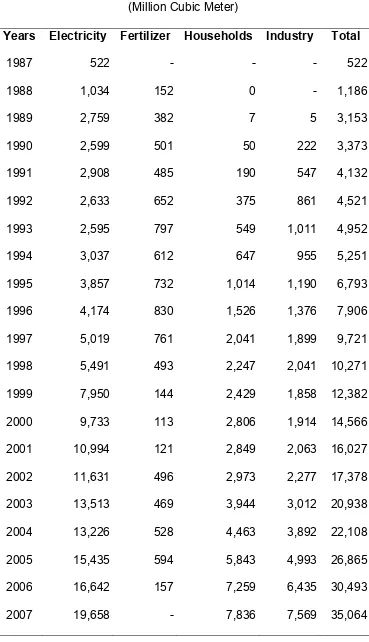
and then Eskisehir and Izmit in 1996. Turkey’s natural gas consumption has
use of natural gas in electricity, agriculture and households have kept
demand soaring. Turkey’s natural gas consumption has started with 0.5 bcm
in 1987 and rapidly reached 35 bcm, by increasing about 67 times, in 2007
(Table 1). The average annual percentage increase in natural gas
consumption is 14.93%. It is expected for this figure to reach 42 bcm in 2009,
45 bcm in 2010 and 67 bcm in 2020 (Table 2). In line with this trend, natural
gas’ share in total primary energy consumption increases as well. It was
5.4% in 1990, 9.4% in 1995 and 27.6% in 2005. It is predicted to become
25% in 2020 (BOTAS, 2008). However, gas production and distribution could
not keep up with the increasing demand. At present, Turkey’s gas production
covers only 2.85% of the consumption, because of very limited indigenous
resources (IEA, 2008b).
[ Table 1 goes here ]
[ Table 2 goes here ]
In Turkey, more than half of the gas is used for electricity generation and the
share of electricity generation in gas consumption was 56% in 2007 (Table
1). In the same year, industry sector and households consumed equally the
remaining part, about 22% each.
Public utilities were state enterprises in Turkey until 1990s. Fiscal crises,
inadequate investment, poor quality of service, negative effects of rent
decade. The same forces also played a crucial role in reforming the natural
gas market.
The Turkish natural gas industry was state owned and vertically integrated
through the 1980s and the 1990s. As a part of energy market restructuring,
the legal structure of the natural gas market was reformed in 2001 with a new
law, namely Natural Gas Market Law (NGML, Law no: 4646)1. The new law was a first step toward gradual liberalization and vertical separation in the
market. The law aims to ‘establish a legal framework for developing a fair,
transparent and competitive natural gas market through unbundling market
activities and eliminating the monopolistic structure in the market’. The new
legal environment is projected to encourage privatization, establish a more
competitive environment and prepare the ground for the integration to the EU
natural gas market by harmonizing regulations. NGML designates Energy
Market Regulatory Authority (EMRA) as the sole authority and describes the
procedures for regulations in the market.
The state-owned company BOTAS is the only gas transmission company in
Turkey. Its monopoly in natural gas imports, exports and wholesale trading
was demolished with the enactment of the NGML and its current de facto
dominating position in the import activities is subject to change in the course
of the gas market reforms. The law requires BOTAS to transfer at least 10%
of its total gas purchase quantity within the take-or-pay contracts every year
to reach the 20% market share by 2009. Furthermore, the law also stipulates
BOTAS to be legally unbundled after 2009 to form separate companies for
The law limits the amount an importer company can buy from abroad to 20%
of the national consumption. Similarly, importers, wholesalers and distributors
cannot have market shares more than 20% to ensure that competition will be
institutionalized. Distribution companies cannot buy more than half of their
gas from a single wholesaler or importer. The law gives discretion to EMRA
to change these ratios.
In Turkey, distribution is carried out by local distribution companies. For the
time being, the major distribution companies are EGO (renamed as
BASKENTGAZ) in Ankara, IGDAS in Istanbul, IZGAZ in Izmit, AGDAS in
Adapazari, BURSAGAZ in Bursa and ESGAZ in Eskisehir. IGDAS is owned
by the municipality. AGDAS, BURSAGAZ, ESGAZ, IZGAZ and
BASKENTGAS were privatized. Table 3 provides the list of distribution
regions as of October 2008. The data in Table 3 are collected from (BOTAS,
2008), (EMRA, 2008) and various web sites of regional natural gas
distribution companies in Turkey.
[ Table 3 goes here ]
NGML requires companies to obtain licenses from EMRA for transmission,
export, import, wholesale, distribution and storage activities. Licenses are
granted for a minimum of 10 and maximum of 30 years. As of October 2008,
EMRA issued a total of 168 licenses, of which 11 is for import, 1 is for export,
28 is for wholesale, 4 is for storage, 1 is for transmission, 15 is for LNG
As the gas infrastructure is being expanded, new consumers are joining the
networks. Tender procedures for distribution and customer connection lines
in 53 new regions have been completed. At present about 50 (out of 81)
cities are supplied with natural gas. All cities is expected to have access to
gas after the completion of the south pipeline stretching from Konya to Izmir
and the north-east pipeline stretching from Gumushane to Trabzon and from
Bayburt to Rize.
It is the task of EMRA to determine the principles and procedures for setting
the regulated prices and tariffs. At present, EMRA applies the price ceiling to
storage, wholesale and transmission tariffs. As for distribution in existing
(public and privatized) distribution zones, EMRA determines unit service and
depreciation charges for the supply of natural gas. EMRA is responsible for
organizing tenders for new natural gas distribution licenses in the cities.
Prequalification for tendering is based on the financial strength and
experience of the potential licensees. Evaluation of the tenders is based on
the unit service and depreciation charge (USDC) for supplying one kWh of
natural gas to consumers (¢/kwh). So, for distribution zones tendered by
EMRA, USDCs are determined as a result of tenders. Licenses are granted
for 30 years. So far (as of October 2008), the tender processes have been
carried out in 55 cities.
Consumers whose annual consumption is above the threshold set by EMRA
have the right to choose their own gas suppliers. At present, the gas market
their suppliers, this right cannot currently be exercised because of the de
factomonopolistic position of BOTAS in import and trade.
The main objective of Turkish energy policy is to respond the ever increasing
energy demand in a reliable, sufficient, prompt, economic and
environmentally sound manner so as to attain economic and social
development targets. In this context, the objectives of the Turkish
government in the domestic natural gas market are as follows:
Spreading the use of natural gas,
Expansion of gas transmission networks,
Construction of gas distribution networks in the cities,
Establishment of a liberal and competitive natural gas market.
3. A brief summary of economic fundamentals
Having provided a general picture of Turkey and her natural gas market, let
us turn to our main subject, namely, the application of auctions in the Turkish
natural gas distribution zones. Before presenting our critical analysis, we
want to pay some attention to the literature that justifies the application of
auctions in energy networks.
An industry is a natural monopoly if a single firm can produce more efficiently
than two or more firms. Gas distribution networks are regarded to be natural
monopolies. Left to the market, they will be undersupplied at prices which
exceed marginal costs. The regulatory approach to the natural monopoly
problem is based upon the establishment of agencies endowed with powers
group of industries. In principle, regulatory agencies could be set up to
monitor the behavior of public corporations, but we will focus here upon their
use in market environments characterized by private ownership.
All regulators are naturally skeptical of a utility’s initial bid to invest and
operate an energy network (or any network), given the incentives of the firms
to ‘game’ the periodic reviews. That is, one of the fundamental regulatory
questions has been how to enjoy the cost benefits of single-firm production
without suffering from monopolistic behaviour. Franchising provides an
answer to that question in the form of a competition for the market, where
several firms competing to be one that actually operates in the market. That
is to say, it provides a mechanism for regulators that enables them not to try
to adjudicate on the ‘right’ answer, but rather leave it to the market
mechanisms.
Franchising involves conferring rights in the supply of a good or service to a
sole producer for a specified period of time. It is regarded as an essential
mechanism for introducing competition for the market where competition
within the market is not feasible or desirable. Natural monopolies are,
therefore, obvious candidates for franchising.
The concept of “franchising” was first pronounced by Chadwick (Chadwick,
1859) and popularized by Demsetz (Demsetz, 1968). In a so-called
“Chadwick-Demsetz” auction, competition takes place through bidding for the
supply the good or service, or more generally, who offers the best
price-quality package.
At first sight, franchising appears to provide a very attractive way of
combining competition and efficiency without any heavy burden for
regulators. The competition for market appears to destroy the undesirable
monopoly of information that hinders conventional regulation, and price is set
by competition, not by bureaucrats. Provided bidding is competitive, a
Chadwick-Demsetz auction will reduce the profits to the normal competitive
level by inducing bid prices equal to unit costs of production.
Nevertheless, franchising is not without some difficulties. First of all, as
mentioned above, bidding must be competitive and cases of collusive bidding
need to be prevented. There exist mainly two reasons why bidding for the
franchise might fail to be competitive. First of all, there is a danger of
collusion between bidders, especially if they are few in number, or if the firms
are effectively in a repeated interaction (or, “game”) with one another via
frequent contracts. The second reason is that one firm might enjoy such
strategic advantages in the competition for the franchise that other firms
would be unwilling to compete with it. For instance, suppose that an
incumbent firm is the holder of a franchise that is now up for renewal. Since,
thanks to its past operation of the franchise, the incumbent has already
reduced its costs; other firms will be unwilling to compete with the incumbent
as they know that they are unlikely to win the competition. Also, another
source of incumbent advantage may originate from asymmetries of
likely superior to that of any other firm, which tends to deter others from
competing with it for the future franchise.
The merits of franchising are further reduced by the issues related with asset
handover. Unless sunk costs are zero (an extremely unlikely event),
efficiency requires that the new operator of the franchise takes over the
assets from the incumbent. Therefore, one needs to decide how the assets to
be valued for this purpose. In such a case, there is a problem of bilateral
monopoly. If incumbent has no alternative, it has to accept as little as the
scrap value of the assets. If the new operator firm has no alternative, it has to
pay as much as their replacement value. The gap between replacement
value and scrap value is likely to be large if the assets involve sunk costs.
The last difficulty with franchising is the question of specification,
administration and monitoring of franchise contract. The duration of franchise
contract must also be considered. The difficulties of contract specification
and administration perhaps suggest that short-term contracts have
advantages, because fewer future unforeseeable events then need to be
considered. Nevertheless, the organization of frequent contests for the
franchise also involves major costs: all the problems of asset valuation and
handover occur more often, and the industry would frequently be in a state of
turmoil.
Actually, The Chadwick-Demsetz proposal is an ingenious scheme if the
contract in question is simple (such as auctions for taxi license plates). There
attractive scheme. But we are concerned with industries (such as natural gas
distribution) in which the difficulties of contract specification and
administration would be immense. Therefore, regulation is an essential part
of franchising. Far from being an alternative to regulation, franchising
requires it.
In short, auctions are methods of revealing information in the context of the
network operators’ near-monopoly of information. They give some indications
of firms’ willingness to reduce their profit so as to invest in the specific
industry in question. Clever auction design filters out some imperfections
associated with auctions, and therefore the detail is extremely important.
But what is the focus of auctions? One clear role is to allocate network
operation in predefined areas. In principle, auctions should be good at this.
The property right is typically well defined—the bidders know what they are
buying (Helm, 2003). As long as auctions are confined in this way, there
should be little controversy. Their use depends on the costs of design and
implementation and the benefits of the information revealed, compared with
other methods.
If regulators seriously want also to rely on auctions for investment
determination, there is a great deal to do to create some of the necessary
conditions. Competition in the auctions is required, and a series of structural
measures would probably be necessary. In such a context, auctions require
the support of a planning approach. They cannot be relied upon to determine
therefore irrelevant. The information they create is not valueless. On the
contrary, auctions provide a method to discover whether there are firms
willing and able to invest in networks with as least profits as possible. That is,
designing an auction provides a plan. The actual auction process tests the
plan. However - and this is a crucial ‘however’ - the determination of the
investment level should rest with the regulator not the auction. The notion of
auctions as part of the planning process also raises the issue of the degree
of regulation that auctions might require. Not only do investors in natural
monopolies depend upon regulatory protection to finance their functions, but
auctions also require regulators to determine the property rights and prevent
the abuse of market power. Auctions are, therefore, likely to require intensive
regulation, as well as being placed within the planning context. Whether
these costs are worth the expected benefits is an empirical question.
4. A critical analysis of natural gas distribution tenders
Given the current natural gas market developments in Turkey and related
literature, let’s concentrate and analyze natural gas distribution tenders in
Turkey and their current and expected effects on consumers. For the sake of
simplicity and due to limited nature of the paper, we will regard only
households as consumers, ignoring industry and electricity generation
sectors.
As discussed before, in Turkey, EMRA is responsible for organizing tenders
were carried out. The main characteristics of these tenders may be
summarized as follows:
Distribution licenses are granted through a tender process for 30
years,
Prequalification to participate in the tenders is based on financial
strength and experience of the company,
Evaluation is based on the “unit service and depreciation charge”
(expressed as an US cent) (USDC) for supplying one KWh of natural
gas to consumers for the first 8 years,
The firm with lowest USDC bid wins the tender and is qualified to set
up all natural gas distribution infrastructure and supply gas to all
consumers in its predefined region,
The distribution companies may charge consumers a one-time
“connection fee” when they are connected to network for the first time.
The upper limit of this charge is determined by EMRA. Apart from this,
USDC is the sole source of winning firm for both profit and income to
recover its investments for the first 8 years,
After the first 8 years, the firm will submit a tariff proposal to EMRA
and new tariff will be determined by EMRA,
The firm is required to start investment within six months,
It is also required to start providing gas to consumers within eighteen
months and cover all consumers in five years.
BOTAS’ existing monopoly in the gas market does not allow distribution
companies to purchase gas from competitive producers, wholesalers or
So, in practice, all distribution companies purchase gas from BOTAS. The
main components of natural gas prices for households are presented in
Figure 1.
[ Figure 1 goes here ]
When we evaluate Figure 1 and Table 3, we may easily see that USDC is the
only source of the distribution company for both recovering its investments
and making a profit. Since they are commercially sensitive and not open to
public, Table 3 does not show the components of BOTAS' gas selling price to
distribution companies. If we analyze Table 3 in more detail, following striking
points can be highlighted:
The only price component that changes from one region to another is
USDC, all other components are the same in all distribution regions.
The share of USDC in total price fluctuates between 0% – 9.7%,
meaning that in some regions (those with USDC is 0%) consumers
pay about %10 less for natural gas than others living in other regions
(those with USDC is 9.7%).
Since USDC means investment recovery and profit for the distribution
company, it is extremely striking to see that as a result of tenders in 10
regions (highlighted in Table 3), the bid of the winning firm for USDC
was “0”, meaning that in the first 8 years these firms agree that they
will not recover their investment and will not make any profit!
Even more striking example is the tender for Edirne-Kirklareli-Tekirdag
distribution region. In this tender, after participating firms bid “0” for
that the firm with lowest connection fee proposal wins the tender.
However, firms again reduced their bids up to “0”. Then, the tender
continued based on how much to pay extra money to operate in the
region! At the end, the firm that accepted to pay 2,500,000 YTL (about
$2 million) won the tender. So, in this region, the winning firm
accepted that for the first 8 years it will invest into infrastructure and
connect consumers without any cost recovery, will not make any profit
and, most remarkably, will pay even extra money to operate!
The share of USDC in total price in tendered regions differs from that
in privatized and publicly owned regions. The share of USDC is
between 9.7% and 3.6% in privatized and public-owned regions while
it is just between 4.5% and 0% in tendered regions. So, it may easily
be concluded that consumers in tendered regions pay about 5% less
than those living in other areas.
A closer look to gas prices reveals that the main gas price
components are the cost of gas purchase from BOTAS (72.5%
-81.9%) and taxes (17.8% - 18.1%). So any effective means to reduce
gas prices should include a reduction in one of these, especially in gas
purchase costs.
This unique tender process based upon USDC seems at first sight a clear
success as it limits the profits of distribution companies and even in some
cases reduces them to zero! However, a deeper analysis may reveal that it is
actually not the case. Do we really expect firms to invest and operate without
any cost recovery and profit? Are they charity organizations? Of course,
four explanations to this extraordinary situation. First of all, it is argued that
although firms may incur a loss during the first 8 years, they expect a tariff
from EMRA that allows them to recover their losses and have a huge profit in
the second tariff period after the first 8 years. According to this explanation, in
spite of some losses in the first 8 years, firms still bid “0” just to keep this
region in their hands as they expect enormous returns in the following period.
Second explanation relates the connection fees. Supporters of this argument
point out that since almost all consumers will be connected for the first time in
these regions, the total income from connection fees is enough to cover all
investment cost and provide a reasonable return during the first 8 years.
Advocates of the third explanation state that large gas consumers in some
regions come together and bid “0” not to pay for USDC to any alternative
distribution company. This explanation assumes that the gain from not paying
USDC is more than the cost of setting up all natural gas distribution
infrastructure and supplying gas to consumers without any profit. Final
answer to the question focuses on the future market policies of the firms. It
states that firms bid “0” as they regard these distribution areas just as
“markets” for the gas they are to import from other countries. The adherents
of this view are in the opinion that when BOTAS’ de facto monopoly on
import is abolished in practice, current distribution firms will set up some
sister companies, get import licenses from EMRA, import gas from other
countries and sell it in their distribution zones with huge profits. This view
assumes that firms do not expect any profit from their distribution activities,
but they expect enormous gains from their future import businesses as there
distribution company proves that it purchases gas from the most
“economical” source.
The economic literature on auctions presumes tenders on a regular basis.
However, Turkish version differs from the mainstream literature in that only
one tender is projected for each distribution region in Turkey. The tariff
setting process for the period after the first 8 years is not clear. After the first
8 years, there may be a tariff structure based on a rate-of-return-regulation
(RoRR) or price cap (RPI-X) or there may be another tender-based system.
In short, in Turkey, there is what we call a “problem of regulatory
inconsistency”, meaning that while licenses are granted for 30 years, the
tenders determine USDCs just for 8 years. A logical solution to this problem
may be the following strategy. Before 8 year period expires, EMRA receives
proposals for second-term USDCs from distribution companies and approves
them if they are below the current USDC levels. If proposals are above the
previous levels, EMRA must organize new tenders for the distribution zones.
EMRA should not approve any USDC proposal above current levels as such
a policy may result in excessive profits. Because of information asymmetries,
like any other regulatory authority, EMRA could not determine optimum level
of USDC levels and it may also be a target for ‘regulatory capture’ if it tries to
do so. Besides, if EMRA employs such a strategy, the first answer to the
question “why do firms bid ‘0’ in tenders?” mentioned above may be falsified.
As for second question, it is not likely as it is very questionable whether or
not the total revenue from connection fees is able to cover all investment and
operation costs. In particular, this argument is totally displaced by the tender
fees turned out to be “0”. Third explanation is also not plausible as it is again
very questionable whether or not gains from not paying USDC is more than
the cost of setting up all natural gas distribution infrastructure and supplying
gas to consumers without any profit. Among four explanations, the final one
is the one that sounds most convincing. However, there is nothing wrong
with such a situation. If a distribution company sets up an importing
company, imports gas via it, purchases gas from its importing company by
proving that it is the most ‘economical’ source, and then distributes gas
without any profits and finally makes profits from its importing business; let it
do so.
5. Guidelines for policy makers
Having discussed and analyzed Turkish natural gas distribution market let
me provide some policy guidelines for those involved in policy making
process. First of all, EMRA should solve what we call “the problem of
regulatory inconsistency” by announcing that if the tariff proposals for second
term USDC levels exceed the current levels new tenders for these regions
will be arranged. What's more, a consistency between license and tender
periods should be established. That is, if USDC levels are determined in a
tender for 8 years, then licenses should be issued for the same period of
time. Therefore, distribution licenses should be granted for 8 years. It will be
a vital mistake for EMRA to try to determine second term USDC levels by
itself as EMRA is very unlikely to be able to set optimum levels due to
information asymmetries and in such a situation it will prone to ‘regulatory
Second policy suggestion relates to the principle of ‘transparency’. EMRA
should not only clarify the tariff determination process for the second tariff
period and announce it but also investigate any issue that violates this
principle. For the time being, it is surprising to see that there is no report or
any kind of document that is published by EMRA to investigate why firms bid
‘0’ in tenders. EMRA should examine such kind of unexpected behaviour of
market actors and publish the findings regularly to provide transparency in
market mechanism. However, it should not follow that EMRA should take
action against those firms bidding ‘0’ in tenders. Unless these bids damage
functioning of the market, there is no need for action on the part of EMRA.
Investment is the focus of the third policy proposal. The literature on auctions
and experience so far show that tenders do not guarantee optimal investment
levels. Even, firms are encouraged to reduce the level of investment as any
reduction in investment means profit for them. To illustrate our point, let’s
consider Turkish case. Assuming that USDC is determined as 10 units in a
tender and the winning firm allocates 6 units for recovering its investments
and 4 units as the return for its services, the firm is motivated to reduce its
investments as if it does so, say, only 3 units will be sufficient to recover its
investments and the remaining 3 units will be the pure profit. To prevent such
an outcome, the determination and supervision of investments should be
separated from service charges and tenders should be conducted just to
determine “unit service charge” (USC) while investment related issues are
Despite the fact that so far no problem has been observed in terms of
competitiveness of the tenders, EMRA should guarantee that its auctions are
competitive and there is no collusive bidding. Also, EMRA should project and
develop solutions to potential problems related with asset handover if the
distribution company in a region is required to be replaced as a result of a
tender.
Final two policy remarks are about general energy policy of Turkey. First of
all, it is easily seen in Table 3 that about 80% of the gas price for households
comes from the cost of gas purchase from BOTAS. So, any effective policy to
reduce gas prices should target this item. Unless distribution companies are
allowed in practice to purchase gas from importers and wholesale companies
other than BOTAS, it is almost impossible to have effective price reductions.
Besides, BOTAS’ current de facto monopoly power not only delays
competitive trading in the market but also weakens the connection between
diversity of supply and competitive structure in the market. The existence of a
monopoly in the middle of the market process may also be seen as the
reluctance on the part of government to delegate some of its power to market
participants. BOTAS’ transfer of some of its contracts to private parties is a
good sign. However, it is politically motivated and there is no assurance that
BOTAS will not change course on legal or political grounds. The delay on
import contracts is a good indicator of this slippery ground.
The final policy advice questions the very logic of Turkish natural gas policy.
In Turkey, only 3 percent of gas consumed is produced domestically, the
produce electricity, and the remaining is consumed by households and
industry almost equally. Even if we accept that the encouragement of the
expansion of the gas distribution networks to cities is an acceptable policy for
the environmental benefits, there is no logical justification for the usage of an
imported source in electricity production and industry at such a gigantic
scale. Turkey should take every necessary step to reduce natural gas
consumption in electricity generation and industry. If done so, the share of
imported natural gas in primary energy sources may be reduced from current
level of about 27% up to 6% (IEA, 2008a).
6. Conclusion
Regulated private ownership in fact does not provide completely satisfactory
solution to the natural monopoly problem. In natural gas distribution
industries, however, it is superior to the other possibilities. Competition
without regulation is unlikely to be sufficiently effective and franchising
without regulation is inappropriate to complex circumstances.
In this paper, we have tried to offer a glimpse of the application of auctions to
energy networks and used Turkey as a case study. We touched upon Turkish
natural gas distribution industry and surrounding issues in the Turkish natural
gas market. We see that so far the legal reform and the regulatory agency
have not been able to establish a market structure that reinforces and
We may conclude that BOTAS’ ongoing monopoly in the natural gas market
-such as its share in imports, long-term purchase contracts and property of
transmission grids - both increases the costs of transition to a competitive
regulatory setting and prevents price reductions in gas prices. So, it is
completely necessary to reduce BOTAS’ dominant role in the market in order
to successfully institutionalize competition and reduce prices to just and
reasonablelevels.
In sum, the efforts to reform the industry remain sluggish in Turkey. The
opportunities to build a competitive market still exist, although institutional
costs are increasing.
Acknowledgements
I would like to thank Energy Expert Mehmet ERTURK for his very helpful
comments. His constructive remarks are gratefully acknowledged. The errors
References
BOTAS (Petroleum Pipeline Corporation) 2008. BOTAS Web Site. Accessed
from http://www.botas.gov.tr on 12.11.2008 at 13:20.
Chadwick, E. 1859. Results of Different Principles of Legislation and
Administration in Europe; of Competition for the Field, as Compared with
Competition within the Field, of Service. Journal of the Statistical Society of
London, 22(3):381-420.
Demsetz, H. 1968. Why Regulate Utilities?. Journal of Law and Economics,
11(1):55-65.
EMRA (Energy Market Regulatory Authority) 2008. EMRA Web Site.
Accessed from http://www.epdk.org.tr on 12.11.2008 at 11:22.
Helm, D. 2003. Auctions and Energy Networks. Utilities Policy, 11:21–25.
IEA (International Energy Agency), 2008a. Energy Balances of OECD
Countries 2005-2006: 2008 Edition. IEA, Paris, France.
IEA (International Energy Agency), 2008b. Natural Gas Information: 2008
Captions to Tables
Table 1.Evolution of natural gas demand by sector (1987-2007) : 6
Table 2.Natural gas demand and supply projections (1987-2020) : 6
Captions to Illustrations
Footnotes
Table 1.Evolution of natural gas demand by sector (1987-2007)
(Million Cubic Meter)
Years Electricity Fertilizer Households Industry Total
1987 522 - - - 522
1988 1,034 152 0 - 1,186
1989 2,759 382 7 5 3,153
1990 2,599 501 50 222 3,373
1991 2,908 485 190 547 4,132
1992 2,633 652 375 861 4,521
1993 2,595 797 549 1,011 4,952
1994 3,037 612 647 955 5,251
1995 3,857 732 1,014 1,190 6,793
1996 4,174 830 1,526 1,376 7,906
1997 5,019 761 2,041 1,899 9,721
1998 5,491 493 2,247 2,041 10,271
1999 7,950 144 2,429 1,858 12,382
2000 9,733 113 2,806 1,914 14,566
2001 10,994 121 2,849 2,063 16,027
2002 11,631 496 2,973 2,277 17,378
2003 13,513 469 3,944 3,012 20,938
2004 13,226 528 4,463 3,892 22,108
2005 15,435 594 5,843 4,993 26,865
2006 16,642 157 7,259 6,435 30,493
Table 2.Natural gas demand and supply projections (1987-2020)
(Million Standard Cubic Meter)
2008 2009 2010 2015 2020
Total Gas Demand 38,025 41,640 44,543 56,920 66,604
Contracted Gas Supply 45,553 49,092 51,059 40,791 40,791
Table 3.Natural gas prices in distribution regions of Turkey (October 2008)
No Distribution Region - Company Tender Date
First Gas Supply Date
Cost of gas purchase from BOTAS (YTL/m3) As % of total price Special Consumption Tax (YTL/m3) As % of total price USDC (¢/kwh) USDC (¢/m3) USDC (YTL/m3) As % of total price Value added Tax (18%) As % of total price Gas price for households (YTL/m3) Connec. Fee ($)
1) Kayseri - KAYSERIGAZ 19.06.2003 01.10.2004 0,651867 80,7 0,023 2,8 0,076 0,809 0,009791 1,2 0,123238 15,3 0,807896 180 2) Konya - GAZNET 31.07.2003 21.10.2004 0,651867 80,9 0,023 2,9 0,064 0,681 0,008245 1,0 0,122960 15,3 0,806072 180 3) Erzurum - PALEN 13.08.2003 08.11.2004 0,651867 81,1 0,023 2,9 0,046 0,489 0,005926 0,7 0,122543 15,3 0,803336 180 4) Corlu - CORDAS 28.08.2003 25.06.2005 0,651867 81,3 0,023 2,9 0,036 0,383 0,004638 0,6 0,122311 15,3 0,801816 180 5) Gebze - PALGAZ 11.09.2003 01.12.2004 0,651867 81,1 0,023 2,9 0,052 0,553 0,006699 0,8 0,122682 15,3 0,804248 180 6) Inegol - INGAZ 18.09.2003 24.10.2004 0,651867 80,9 0,023 2,9 0,061 0,649 0,007859 1,0 0,122891 15,3 0,805616 180 7) Catalca - TRAKYADAS 25.09.2003 25.10.2005 0,651867 81,2 0,023 2,9 0,044 0,468 0,005668 0,7 0,122496 15,3 0,803032 180 8) Bandirma - BADAS 09.10.2003 27.01.2005 0,651867 79,2 0,023 2,8 0,174 1,851 0,022416 2,7 0,125511 15,3 0,822794 180 9) Balikesir - BALGAZ 16.10.2003 05.01.2005 0,651867 80,1 0,023 2,8 0,112 1,192 0,014429 1,8 0,124073 15,3 0,813369 180 10) Sivas - SIDAS 30.10.2003 21.10.2005 0,651867 79,4 0,023 2,8 0,164 1,745 0,021128 2,6 0,125279 15,3 0,821274 180 11) Kutahya - CINIGAZ 06.11.2003 04.01.2005 0,651867 80,0 0,023 2,8 0,124 1,319 0,015975 2,0 0,124352 15,3 0,815193 180 12) Eregli (Konya) - NETGAZ 04.12.2003 16.10.2005 0,651867 79,3 0,023 2,8 0,172 1,830 0,022159 2,7 0,125465 15,3 0,822490 180 13) Corum - CORUMGAZ 18.12.2003 15.10.2004 0,651867 80,6 0,023 2,8 0,079 0,841 0,010178 1,3 0,123308 15,3 0,808353 180 14) Kirikkale Kirsehir - KIRGAZ 08.01.2004 29.09.2005 0,651867 79,5 0,023 2,8 0,158 1,681 0,020355 2,5 0,125140 15,3 0,820362 180 15) Samsun - SAMGAZ 22.01.2004 29.10.2005 0,651867 81,0 0,023 2,9 0,055 0,585 0,007086 0,9 0,122751 15,3 0,804704 180 16) Aksaray - AKSARAYGAZ 12.02.2004 22.11.2005 0,651867 78,3 0,023 2,8 0,236 2,511 0,030404 3,7 0,126949 15,3 0,832219 180 17) Duzce Karadeniz Eregli - DERGAZ 08.04.2004 30.11.2005 0,651867 81,3 0,023 2,9 0,034 0,362 0,004380 0,5 0,122264 15,3 0,801512 180 18) Gemlik - GEMDAS 22.04.2004 08.12.2005 0,651867 78,3 0,023 2,8 0,239 2,543 0,030790 3,7 0,127018 15,3 0,832675 180 19) Yalova - ARMAGAZ 01.07.2004 19.11.2005 0,651867 81,4 0,023 2,9 0,031 0,330 0,003994 0,5 0,122195 15,3 0,801056 180 20) Usak - UDAS 02.12.2004 26.10.2005 0,651867 81,0 0,023 2,9 0,055 0,585 0,007086 0,9 0,122751 15,3 0,804704 180 21) Polatli - POLGAZ 13.01.2005 09.02.2006 0,651867 78,4 0,023 2,8 0,230 2,447 0,029631 3,6 0,126810 15,3 0,831307 180 22) Izmir - IZMIRGAZ 27.01.2005 01.06.2006 0,651867 81,7 0,023 2,9 0,012 0,128 0,001546 0,2 0,121754 15,3 0,798167 180 23) Manisa - MANISAGAZ 24.02.2005 13.10.2006 0,651867 81,6 0,023 2,9 0,016 0,170 0,002061 0,3 0,121847 15,3 0,798775 180 24) Nigde Nevsehir - KAPADOKYAGAZ 17.03.2005 23.09.2006 0,651867 80,4 0,023 2,8 0,098 1,043 0,012625 1,6 0,123749 15,3 0,811241 180 25) Bilecik Bolu - BEYGAZ 09.06.2005 01.03.2006 0,651867 81,6 0,023 2,9 0,016 0,170 0,002061 0,3 0,121847 15,3 0,798775 180 26) Karabuk Kastamonu Cankiri - KARGAZ 16.06.2005 Supplied 0,651867 80,8 0,023 2,9 0,069 0,734 0,008889 1,1 0,123076 15,3 0,806832 180
27) Edirne Kirklareli Tekirdag - TRAKYAGAZ 23.06.2005 01.04.2006 0,651867 81,9 0,023 2,9 0,000 0,000 0,000000 0,0 0,121476 15,3 0,796343 0
28) Yozgat - SURMELIGAZ 30.06.2005 17.11.2006 0,651867 79,2 0,023 2,8 0,176 1,873 0,022674 2,8 0,125557 15,3 0,823098 180 29) Malatya - PEGAZ 07.07.2005 22.08.2006 0,651867 81,3 0,023 2,9 0,037 0,394 0,004767 0,6 0,122334 15,3 0,801968 180 30) Kahramanmaras - ARMADAS 14.07.2005 22.12.2006 0,651867 81,7 0,023 2,9 0,009 0,096 0,001159 0,1 0,121685 15,3 0,797711 180
32) Gaziantep Kilis - GAZDAS 28.07.2005 10.10.2007 0,651867 81,9 0,023 2,9 0,000 0,000 0,000000 0,0 0,121476 15,3 0,796343 30
33) Sanli Urfa - GURGAZ 09.11.2005 17.12.2007 0,651867 80,4 0,023 2,8 0,095 1,011 0,012239 1,5 0,123679 15,3 0,810785 180 34) Canakkale - CANAKKALEGAZ 16.12.2005 22.12.2006 0,651867 81,8 0,023 2,9 0,001 0,011 0,000129 0,0 0,121499 15,3 0,796495 180 35) Isparta Burdur - TOROSGAZ 23.12.2005 01.09.2008 0,651867 81,6 0,023 2,9 0,015 0,160 0,001932 0,2 0,121824 15,3 0,798623 180
36) Afyonkarahisar - AFYONGAZ 06.01.2006 09.11.2007 0,651867 81,9 0,023 2,9 0,000 0,000 0,000000 0,0 0,121476 15,3 0,796343 174
37) Kars Ardahan - KARGAZ Kars Ardahan 20.01.2006 18.06.2008 0,651867 77,7 0,023 2,7 0,279 2,969 0,035943 4,3 0,127946 15,3 0,838756 180 38) Erzincan - ERZINGAZ 27.01.2006 20.11.2007 0,651867 80,5 0,023 2,8 0,089 0,947 0,011466 1,4 0,123540 15,3 0,809873 180 39) Karaman - DOGANGAZ 03.02.2006 08.09.2007 0,651867 79,7 0,023 2,8 0,144 1,532 0,018551 2,3 0,124815 15,3 0,818234 180
40) Amasya Tokat Turhal - TAMDAS 10.02.2006 02.01.2008 0,651867 81,9 0,023 2,9 0,000 0,000 0,000000 0,0 0,121476 15,3 0,796343 163 41) Antalya - OLIMPOSGAZ 17.02.2006 Not specified yet 0,651867 81,9 0,023 2,9 0,000 0,000 0,000000 0,0 0,121476 15,3 0,796343 5
42) K.bey M.Kemalpasa Susurluk - OVAGAZ 24.02.2006 17.11.2007 0,651867 80,6 0,023 2,8 0,081 0,862 0,010435 1,3 0,123354 15,3 0,808657 180
43) Elazig - ELAZIGGAZ 21.07.2006 27.03.2008 0,651867 81,9 0,023 2,9 0,000 0,000 0,000000 0,0 0,121476 15,3 0,796343 5
44) Trabzon Rize - KARADENIZGAZ 15.09.2006 01.09.2008 0,651867 81,7 0,023 2,9 0,008 0,085 0,001031 0,1 0,121662 15,3 0,797559 180 45) Gumushane Bayburt 22.09.2006 Not specified yet 0,651867 78,1 0,023 2,8 0,250 2,660 0,032207 3,9 0,127273 15,3 0,834348 180 46) Diyarbakir - DIYARGAZ 03.11.2006 Not specified yet 0,651867 77,6 0,023 2,7 0,290 3,086 0,037360 4,4 0,128201 15,3 0,840428 180 47) Adiyaman - AKMERCANGAZ 01.12.2006 Not specified yet 0,651867 81,7 0,023 2,9 0,010 0,106 0,001288 0,2 0,121708 15,3 0,797863 180
48) Ordu Giresun - FINDIKGAZ 08.12.2006 Not specified yet 0,651867 81,9 0,023 2,9 0,000 0,000 0,000000 0,0 0,121476 15,3 0,796343 169
49) Van 16.03.2007 12.03.2008 0,651867 77,5 0,023 2,7 0,297 3,160 0,038262 4,5 0,128363 15,3 0,841493 180 50) Seydisehir Cumra 23.03.2007 Not specified yet 0,651867 80,9 0,023 2,9 0,063 0,670 0,008116 1,0 0,122937 15,3 0,805920 180
51) Agri 30.03.2007 Not specified yet - - - - No bid - - -
-52) Cukurova - AKSAGAZ 20.07.2007 Not specified yet 0,651867 81,9 0,023 2,9 0,000 0,000 0,000000 0,0 0,121476 15,3 0,796343 167
53) Siirt Batman 28.12.2007 Not specified yet 0,651867 78,3 0,023 2,8 0,235 2,500 0,030275 3,6 0,126926 15,3 0,832067 180
54) Aydin 08.02.2008 Not specified yet 0,651867 81,9 0,023 2,9 0,000 0,000 0,000000 0,0 0,121476 15,3 0,796343 165
55) Gevye Ali Fuat Pasa Pamukova 06.06.2008 Not specified yet - - - - Cancelled - - -
-56) Istanbul - IGDAS Public Supplied 0,651867 73,0 0,023 2,6 0,635 6,755 0,081784 9,2 0,136197 15,3 0,892848 190
57) Ankara - BASKENTGAZ Privatized Supplied 0,651867 74,4 0,023 2,6 0,522 5,555 0,067260 7,7 0,133583 15,3 0,875710 190
58) Adapazari - AGDAS Privatized Supplied 0,651867 72,5 0,023 2,6 0,673 7,165 0,086759 9,7 0,137093 15,3 0,898719 290
59) Izmit - IZGAZ Privatized Supplied 0,651867 73,4 0,023 2,6 0,602 6,403 0,077526 8,7 0,135431 15,3 0,887824 190 60) Eskisehir - ESGAZ Privatized Supplied 0,651867 78,3 0,023 2,8 0,235 2,500 0,030270 3,6 0,126925 15,3 0,832062 190 61) Bursa - BURSAGAZ Privatized Supplied 0,651867 78,3 0,023 2,8 0,235 2,500 0,030270 3,6 0,126925 15,3 0,832062 190 62) Bahcesehir - BAHCESEHIR Privatized Supplied 0,651867 73,3 0,023 2,6 0,611 6,498 0,078680 8,8 0,135638 15,3 0,889185 190
Figure 1.Components of natural gas price for households
Value Added Tax (18%)
Gas Price For Consumers Unit Service and Depreciation Charge Revenue of the Distribution Company Special Consumption Tax (Fixed Amount)