Munich Personal RePEc Archive
The Internationalization of Inventive
Activity: A Gravity Model Using Patent
Data
Picci, Lucio
University of Bologna - Department of Economics
15 October 2009
The Internationalization of Inventive Activity:
A Gravity Model using Patent Data
Lucio Picci1
This version: October 2009
Abstract
This paper discusses the extent and the determinants of the internationalization of
European inventive activity, between 1990 and 2005, using an innovative method to treat
the information contained in the European Patent Office's Patstat database. We introduce a
new set of indicators measuring internationalized patent applications that are fully coherent
with the principle of fractional counting. The observed level of internationalization of
inventive activities, while being rather low, has steadily increased over time.
The amount of collaboration between actors residing in different countries is
assessed by means of a gravity model. The amount of bilateral collaboration is positively
affected by the presence of a common language, a common border and by more similar
cultural characteristics. International collaboration is negatively affected by distance, with
estimated elasticities that are significantly smaller than the ones that characterize
international trade.
Keywords: Internationalization; R&D; Patent statistics; Gravity model.
1 Department of Economics, University of Bologna, Strada Maggiore 45, 40123 Bologna.
Email: [email protected], tel.: 0039-051-2092608, fax: 0039-051-2092664. I thank Marc
Bogdanowicz, Gaétan De Rassenfosse, Albert Hu, Andrea De Panizza, Antoine Schoen, and Bruno
van Pottelsberghe de la Potterie for comments on a previous version of the paper. I’m grateful to
participants to the World Bank Knowledge Economy Forum (Ancona, June 17-19, 2008), to the
EPIP 2008 Conference (Bern, 3-4 October 2008), to the IPTS Workshop on patent statistics
(Seville, 14-15 May 2009) for useful discussions. I thank James Fearon, Giuditta de Prato and Paola
1. Introduction
Almost all contemporary products are the result of some form of international
collaboration and trade. A cell phone is a bundle of many components that, almost
invariably, are produced in different countries. Raw materials are traded to such an extent
that anything containing plastic or metal components is also very likely to be the result of
international trade. As for services, the current lore on international outsourcing of
back-office routines indicates that internationalization, while not being preponderant, is certainly
increasing.
Innovative activities, on the other hand, are largely the result of efforts which take
place in single countries. Almost twenty years ago, considering the patenting activities of a
sample of big US firms, Patel and Pavitt (1991) observed that "in most cases, the(ir)
technological activities […] are concentrated in their home country", and concluded that
"despite being a critical resource in the global competition and performance of both
companies and countries […] the production of technology remains far from globalised."
Since then, globalization has certainly made inroads into this domain, thanks to robust
increases in international collaboration of various types, to the off-shoring of many R&D
labs, and to advances in the protection and trade of intellectual property rights. However,
as we will demonstrate, it is still true that innovative activities are predominantly national
in scope.
This paper aims to identify the determinants of the intensity of international
collaboration in inventive activities, and what they tell us about why the degree of
internationalization of innovative activities is still relatively low. To address this issue,
several researchers have exploited in various ways the information contained in patent data
(see, among others, Patel and Pavitt, 1991; Patel and Vega, 1999, and Le Bas and Serra,
2002). The research presented here also uses patents data. While most previous studies
have considered the patent portfolios of (multinational) firms, here we attribute patents to
countries, by exploiting the fact that patents data provide separate information on the
nationality of the inventors and of the applicants. If a given patent involves only people and
organizations residing in the same country, we define it as "national". If, on the other hand,
at least one inventor or one applicant resides in a country different from that of the others,
then we call the patent "international". Moreover, the presence of an important functional
distinction between inventors and applicants allows us to define and analyze different
We adopt a methodology to compute patent statistics focusing on all applications
claiming the right to priority that are filed at any one of the EU27 national patent offices,
the European Patent Office (EPO), the United States Patent and Trade Mark Office
(USPTO), or the Japanese patent office. Applications claiming the right to priority are those
that are filed at a particular patent office for the first time. Focusing on them only is a
possibility only recently made available, thanks to the Patstat database (European Patent
Office, 2009a and 2009b), which is the source of our data. The methodology used allows to
control for the presence of the “home bias effect” (the tendency of residents of a country to
file patent applications in their country's patent office), and is fully documented in De
Rassenfosse et al. (2009).
We adopt a gravity model to study the determinants of the intensity of collaboration
between pairs of countries. The gravity model ("one of the more successful empirical
models in economics", Frankel and Rose, 2002) has had remarkable success in explaining
bilateral trade flows. It describes trade between two countries as increasing in their
economic size, and as decreasing in their distance (hence the resemblance with Newton's
gravity law). This model has been given several theoretical rationalizations, the first
proposed by Anderson (1979). Disdier and Head (2008) performed a meta-analysis on 103
papers applying the gravity model and report a mean elasticity of bilateral trade with
respect to distance of 0.9, "indicating that, on average, bilateral trade is nearly inversely
proportionate to distance". They also show that distance effects "decreased slightly between
1870 and 1950 and then began to rise". Besides the negative effect of distance, other
variables have generally been found to positively determine bilateral trade, such as the
presence of a common border, a common language, a common market, a common currency
area (for the latter, see Rose, 2000, and Baldwin, 2006), and a higher level of mutual trust
(Guiso et al., 2009) The gravity model has been also applied to describe relations other
than traditional trade in goods. In particular, distance effects have been found in the trade of
services (Ceglowski, 2006, and Kimura and Lee, 2006), trade through the Internet (Blum
and Goldfarb, 2006), knowledge flows through patent citations (Peri, 2005), immigration
flows (for a recent example, see Lewer and Van den Berg, 2007), and also in fields outside
economics.
Our approach appears to have only one published antecedent, the paper of Guellec
and van Pottelsberghe de la Potterie (2001), who use measures of R&D internationalization
similar to ours, which we introduce in the next section. One dimension in which this paper
description of the data. In Section 4, we illustrate the empirical model and the main results,
which we discuss in Section 5.
2. Measures of internationalization
To present our measures of internationalization, we first briefly review the
familiar concept of fractional counting of patents (see for example Dernis et al., 2001). To
help make the discussion as easy to follow as possible, we use a simple fictitious example.
We consider three countries, United Stated (US), France (FR), and Germany (DE), that in a
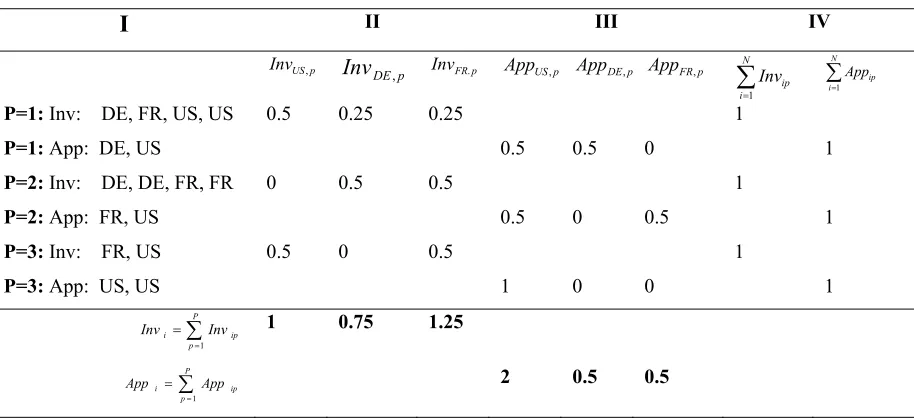
given year produce a total of P=3 patents. Column I in Table 1 indicates the nationality of
the inventors and applicants that contributed to these three inventions.
Table 1 about here
In order to assign patents to countries, two alternative criteria may be chosen:
either according to the nationality of the applicant(s), or of the inventor(s). The former
defines the "applicant criterion" and the latter the "inventor criterion". Whenever an
application has more than one inventor or applicant, some of them coming from different
countries, patent assignment is carried out by resorting to fractional counts. So, for
example, patent n. 1 counts as ½ German and ½ American according to the applicant
criterion, and ½ American, ¼ German and ¼ French according to the inventor criterion.
Let us call Invi,p the fraction of patent p attributed to country i according to the
inventor criterion, and Appi,p the analogous measure according to the applicant criterion.
Column II and III of Table 1 report these measures for the three patents. For each patent,
the sum of all the country's contribution according to the inventor criterion has to be equal
to 1: for each patent, InvUS,p + InvDE,p + InvFR,p = 1, where the first subscript indicates the
country, and the second the patent (for clarity we use the mnemonic symbol of the relevant
country, instead of i, and we omit a time subscript that should be present). These sums are
indicated in Column IV of Table 1.
The total fractional assignment of the three patents to each country is simply equal
to the sum of the individual assignments:
(1)
∑
=
= P
p ip i Inv
and:
(1')
∑
=
= P
p ip i App
App 1
They are reported in the last two rows of Table 1. For example, Germany produced
a total of 0.75 patents according to the inventor criterion, and of 0.5 patents according to
the applicant criterion.
Having defined the concept of fractional counting, we proceed to develop useful
measures to express the degree of collaboration in producing patents between (the agents
residing in) two countries. Again, we discuss them using the fictitious example of Table 1.
We define three concepts of internationalization of a given patent:
Inventor-Applicant internationalization (InvApp): Whenever a patent has (at
least) one inventor and one applicant that come from different countries. All three patents
of the example belong to this type.
Inventor internationalization (in short, InvInv): Whenever a patent has at least
two inventors resident in different countries. All three patents in our example display this
type of internationalization.
Applicant internationalization (AppApp): Whenever a patent has at least two
applicants resident in different countries. Patent 1 and 2, but not patent 3, display this type
of internationalization.
InvApp is the more general type of internationalization. In fact, the presence of
InvInv implies InvApp – if there are two inventors from different countries, then it is also
necessarily true that one inventor and one applicant are from different countries. Similarly,
AppApp implies InvApp. All international patents are necessarily of the InvApp type, and
possibly also of the InvInv and/or of the AppApp type.
There are some forms of international inventive effort that our measures may fail
to detect. Consider a multinational corporation (from country A) acquiring a firm abroad (in
country B) with a long record of patenting its innovations at country B's patent office. Our
measures would not define this activity as “international”, unless at least one inventor is
from outside country B, possibly from the headquarters in country A. However, it may in
fact be appropriate not to consider the case as an example of internationalization of
inventive activity (possibly, as opposed to a case of internationalization of productive
activity), considering that these inventions are not necessarily shared with headquarters.2
A further case of interest applies when a firm owns a R&D unit in a foreign
country, producing an invention with the help of inventors that are all resident in that same
location. If, moreover, the applicant of the filing is the foreign subsidiary (instead of the
firm’s headquarters), then all the applicants and the inventors would be from the same
country and therefore the patent application, according to our taxonomy, would fall into the
"national" category. However, multinational corporations tend to file through their
headquarters (a fact that is also supported by evidence that we present in Table 3 below).
Moreover, even when they file through a foreign subsidiary, given the international scope
of the firm, it would be likely that at least one inventor is from another country, and also the
filing could be done jointly with another subsidiary in a different country, so that the patent
would be classified as international.
Another case of internationalization that would go undetected is when two firms
from different countries constitute a joint R&D effort in one of the two countries, or in a
third country, and produce an invention where all the inventors are residents of the country
where the jointly-owned firm is registered. Arguably, there should not be very many of
these cases.
Having discussed the general concepts of Inventor, Applicant, and
Inventor-Applicant internationalization, we now proceed to define the related measures, starting with
the first one. For each patent, the strength of the relation between inventors in country i and
j is expressed as the product of the attribution of that patent to the two countries:
(2) InvInvijp=Invip⋅Invjp
This measure attributes a greater weight to collaborations where the two countries
have more similar weights. So, for example, the collaboration between the US and France
is equal to ½ · ¼ = 1/8 in patent n. 1 (where there are 1 French and 2 American inventors)
and to ½ · ½ in patent 3 (where the total number of inventors, 2, is equally divided between
the US and France. In fact, if i is different from j, 0≤InvInvijp≤1/4, where the upper bound
is reached when the total number of inventors is equally divided between two countries,
and the lower limit applies when a patent is national.
The aggregate strength of the relation between the inventors of two countries is
3)
∑
= = P p ijp ij InvInv InvInv 1Below, we report the values for all the combinations of the three patents in Table
1, where for clarity, instead of the indexes i and j, the acronyms of the countries are
employed. 5 . 0 5 . 0 5 . 0 0 0 5 . 0 5 . 0
,US = ⋅ + ⋅ + ⋅ =
US InvInv 125 . 0 5 . 0 0 5 . 0 0 25 . 0 5 . 0
,DE = ⋅ + ⋅ + ⋅ =
US InvInv 375 . 0 5 . 0 5 . 0 0 0 25 . 0 5 . 0
,FR = ⋅ + ⋅ + ⋅ =
US
InvInv
The top part of Table 2 shows the values of these interactions for all three cases.
Note that Invij =Invji (the order of the countries is irrelevant). Using (1), it is easy to see
that:
(4) j
N i
ij Inv
InvInv =
∑
=1 and
i N j ij Inv InvInv =
∑
=1For example, as predicted by (4):
US FR US DE US US
US InvInv InvInv Inv
InvInv , + , + , =0.5+0.125+0.375=1=
These sums are reported for all three countries in the last column and in the last rows of the
top part of Table 2, and correspond to the values reported in Table 1. They show that the
country patent portfolio, assigned according to the inventor criterion, may be expressed as a
sum of pairwise measures of country inventive collaboration (InvInvij).
The measure of applicant internationalization is constructed along the same lines,
and the following formulae hold:
(2') AppAppijp =Appip⋅Appjp
(3')
∑
= = P p ijp ij AppApp AppApp 1
(4') j
N i
ij App
AppApp =
∑
=1 and
i N j ij App AppApp =
∑
=1All computations for this case are shown in the middle part of Table 2. Note that
ji
ij App
express a country patent portfolio, according to the applicant criterion, as a sum of
interactions between applicants in different countries. The values reported in the last
column and row of the middle part of Table 2 correspond to those of Table 1.
We construct a measure of Inventor-Applicant internationalization similarly. The
strength of the collaboration between inventors in country i and applicants in country j, for
a single patent p, is defined as:
(5) InvAppijp =Invip⋅Appjp
Summing over patents provides a measure of the strength of the overall
collaboration between country i inventors and country j applicants:
(6)
∑
=
= P
p
ijp
ij InvApp
InvApp 1
These measures aggregate to the patent attributed to a country either according to
the inventor, or to the applicant criterion, depending on whether the summation is over i, or
over j:
(7) i
ij N
j
Inv
InvApp =
∑
=1
(7') j
ij N
i
App
InvApp =
∑
=1
The bottom part of Table 2 indicates all computations for our fictitious example.
Note that InvAppij generally differs from InvAppji.
The quantities defined in (3), (3’) and (6) are the three measures of
internationalization of innovative activities that we will assess in Section 4 using a gravity
model. In the next section, in order to provide a first description of the degree of
internationalization, we will use measures of internationalization that are relative to the
total number of patent applications. Starting from (3) and (3’), the necessary computations
are straightforward:
and
(8') AppAppiji =Appij/Appi
where 1
1
=
∑
= iji
N
j
Inv
Inv and 1
1
=
∑
= iji
N
j
App
App .
In the case of (6), we can compute two relative measures, depending on whether
the normalization is carried out with respect to the inventors of country i, or to the
applicants of country j:
(9) InvAppiji =InvAppij/Invi
(9') InvAppijj =InvAppij/Appj
where 1
1
=
∑
= iji
N
j
InvApp
and 1
1
=
∑
= ijj
N
i
InvApp
.
Our metrics of relative internationalization have similarities with those of Guellec
and van Pottelsberghe de la Potterie (2001), who adopt three measures that they call SHAI,
SHIA, and SHII. The first one is similar to our (9), the second to (9'), and the third to (8).
Our measure (8') has no analogue in their paper. Our measures have three main advantages
on others that have been employed in the literature (see also OECD, 2008). First, we use
fractional counting so as to count as "more international" those patents where international
collaboration is more pronounced. Secondly, the appropriate use of fractional counting
allows to decompose a patent portfolio as a sum of pairwise internationalization linkages,
plus a fully national component (equations 4, 4’, 7 and 7’). Thirdly, contemplating all
possible types of internationalization, as they may be detected using patent data, allows to
compute alternative measures whose contrast may be informative.
3. The data
We consider patent applications, not granted patents. This choice, besides being a
common practice in the literature, has the advantage of allowing an analysis of more recent
data, considering that several years typically elapse between the filing and the granting of a
patent. The source of the data is the Patstat database, based on the EPO's "master
bibliographic database DocDB" (European Patent Office, 2009a and 2009b), and covers
is that it allows the identification of patent applications that claim the right to priority (that
is, it permits us to distinguish between multiple applications for the same inventions in
several patent offices). We take full advantage of this characteristic and we only consider
"priority" applications.
Most studies on patents only use information from a single patent office. Given
our focus on the internationalization of patents, this approach would not be viable, because
the presence of the "home bias effect" would vitiate any study based on a single, even if
very important, national patent office. For this reason, we consider applications filed in any
one of the patent offices of a member state of the European Union (in its current
configuration of 27 States, EU27), at the EPO, the USPTO and the Japanese Patent Office.
Guellec and van Pottelsberghe de la Potterie (2001) and OECD (2008) focus their attention
on the filings to the EPO only, a strategy that rests on its continental scope. However, such
a choice also is questionable, for two reasons. First, many European patents never reach the
EPO as priority filings, or as successive applications. Secondly, the decision to file to the
EPO is influenced by factors that are country-dependent. In particular, agents from smaller
countries, which have been members of the EPO for longer and whose national patent
offices have higher filing fees, have a higher propensity to use that institution (De
Rassenfosse and van Pottelsberghe de la Potterie, 2007).The two reasons together imply
that only focusing on the EPO may induce biased estimates. Using data from the EPO only
(or from one or few national patent offices, as in the triadic approach – see Dernis and
Khan, 2004) was also a matter of convenience and, until some time ago, it was almost
unavoidable. With the availability of the Patstat database, better alternatives have become
available.
The Patstat database, however, while being very innovative, is still in its infancy,
and the data of each patent office require careful analysis and often ad-hoc treatment in
order to be included. The choice of the patent offices to be included was made considering
a trade-off between considering more offices, and the high incremental costs to be incurred
to check the quality of the data and to make any corrections that may be necessary. The
methodology employed is fully documented in de Rassenfosse et al (2009). Out of all
applications filed at the selected patent offices between 1990 and 2005 (a total of
8,260,081), 224,911 are international according to our classification.
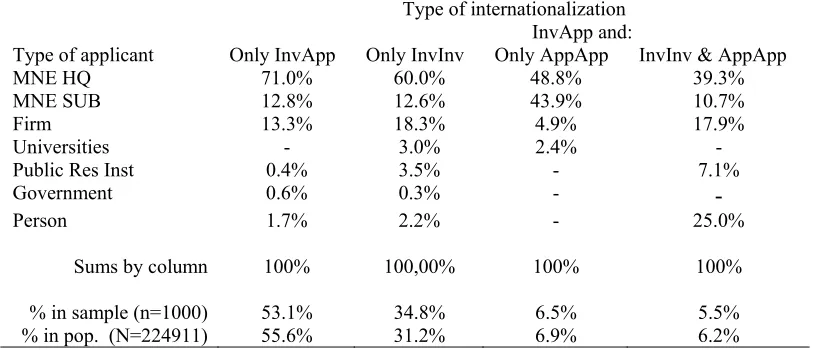
Table 3 documents some relevant characteristic of these international patents. We
consider first its last line, that reports the frequency of the types of internationalization.
About 56% of the international patents do not display any other type of internationalization
besides the InvApp (only) type. The other international patents also manifest some other
type of internationalization. The most frequent occurrence is of patents that are both of the
InvApp and of the InvInv type (about 31% of the total). The cases involving AppApp
internationalization are relatively infrequent (last two columns).
Next, we ask ourselves about the nature of the applicants. Unfortunately, besides
reporting their names, patent statistics tell us nothing about their nature – be them national
or multinational firms, universities, etc. The only way to find out is to carry out individual
searches, a task that would obviously be too demanding if it were to be conducted on the
whole group of about 225 thousand international patent applications. As a compromise, we
selected selected a stratified random sample of 1,000 units, with proportional allocation in
the year variable. For each one of them, we determined (using Internet searches and, in a
few cases of doubt, the Amadeus business registry) the type of applicant(s), according to
the following classification.
"Multinational Enterprises" (MNEs) are firms that control at least one production
unit in a country different from where they are based. We do not distinguish between
headquarters and those subsidiaries that may be present in the same country as heaquarters
(both are indicated as HQ). “Subsidiaries” (SUB) are firms controlled by MNEs and located
in a country different from that of the headquarters. "Firms" are all firms that are not (part
of) a MNE. "Universities" include all universities, and "Public research institutes" are
research institutions that are primarily financed by public administrations (in all cases
considered, they are also publicly owned, and clearly public in nature).
The rest of Table 3 refers to results computed on the sample of 1000 patents. The
last but one row reports the type of internationalization of the patent applications contained
in the sample, with differences with respect to the population total that are due to sampling
error. Each column reports the relative frequencies of the type of applicant conditional on
the type of internationalization (note that the sum of the percentages by columns is always
equal to 100%). Around 84% of the patents that are only of the InvApp type (and not of the
InvInv and/or AppApp type) are the result of the activity of MNE. In most cases, MNE file
through their headquarters, the only exception being for patents of the InvApp and AppApp
type, that, implying collaboration of firms in distint countries, not surprisingly involve a
are carried out by firms (or other entities) that are not (part of) MNE. Applications from
MNE headquarters are of decreasing importance as we move in the table from left to right.
A Pearson χ2 test shows that the relative importance of each type of applicant is not
independent of the type of internationalization, implying that the differences that we have
commented upon, as a whole, are statistically significant.
To assess the overall degree of internationalization of inventive activity, we
compute the relative measures of internationalization defined by Equations 8, 8', 9 and 9' of
the previous section, for EU27, the United States and Japan, on all applications filed
between 1990 until 2005. The data for EU27 are computed as a weighted average of the
country level data, with weights equal to the relative size of patent portfolio of each country
(computed according to the inventor criterion). The results are shown in Figure 1.
Figure 1 about here
All measures indicate a degree of internationalization that is still rather modest,
even though it has increased steadily since the early 1990s. The European country average
indicates the highest level of internationalization, around 8% for InvApp
internationalization at the end of the period. The United States showed a marked increase in
internationalization in the 1990s, with levels roughly constant in the last few years. Japan
has a very low share of international patents, reflecting both a reduced degree of
internationalization of Japanese R&D, and a very high propensity to patent of Japanese
entities.
We also observe important differences among the four alternative metrics, with the
two relative measures of inventor-applicant internationalization being well above the
others. The first of the two (indicated in the Figure as InvApp | Inv) refers to patents that
have national inventors and extra-national applicants, and InvApp | App the opposite. Let's
focus on the case of Europe. The typical case accounted for by the InvApp | Inv measure is
the one of a foreign MNE owning an R&D lab in a European country and filing the patents
produced there through its headquarters in the home country. The fact that the first measure
is higher than the second indicates the relatively high importance of foreing applicants in
European inventive activity. The opposite happens for the United States, indicating a
Overall, these data allow us to declare that the degree of "globalization" in the
production of technology, to refer again to the work of Patel and Pavitt (1991), has
increased since the time when they wrote, but is still rather low in relative terms.
4. A gravity model of international inventive activity
The basic model that we estimate is the following:
ijt jt it
ijt ij
jt it
ijt A A dist L D D
INT )=β0+β1ln( )+β2ln( )+β3ln( )+λ +β4 +β5 +ε ln(
where ln is the natural log, INT is one of the three bilateral measures of internationalization
of inventive activity (equations 3, 3' or 6), A is the "inventive mass" of country i or j, that
we proxy it with Invi or j and Appi or j (the total country patent portfolio, see equations 1 and
1'). Dist is the distance between the capital cities of pairs of countries (computed with the
great circle formula) and L is a vector of other conditioning variables. It includes Border, a
dummy for the presence of common borders, dummies for the inclusion in the European
Union (Eu Union) and in the European Monetary Union (Euro Zone), and Com lang, a
variable representing the presence of a common language (see the Appendix for a
description, and data sources, of this variable and of the following ones). In L we also
include Tech, an indicator of pairwise "inventive proximity", computed as the correlation
between two vectors, one for each country, formed by the number of patent priority
applications in each of the eight technology classes according to the International Patent
Classification.
It is quite likely that the costs of travel alone are not able to explain any effect that
physical distance may have – just as they do not fully explain the negative effect of distance
on international trade. It could well be that what really matters is a broad concept of
cultural distance. The success of R&D activities rests upon the smooth functioning of many
tasks that are not limited to research activities proper, but also include, for example, the
building of the necessary infrastructure and the protection of the intellectual assets that are
eventually produced. Since the necessary mutual understanding among all parties involved
may be guaranteed only in part through contractual arrangements, tacit agreements end up
is for tacit agreements to be honored, and the more problematic is collaboration.3 In order to
assess the role of cultural differences, we include among the regressors some variables that
should capture these effects.
We consider first a survey-based quantification on mutual trust between countries,
Trust, that originates from one of the questions contained in the Eurobarometer survey. The
variable Lang sim describes language similarity, and takes higher values for languages that
share more common “branches”. Note that Lang sim is certainly correlated with Com lang,
but it conveys different information. Com lang is meant to capture ease of communication
(commonality of the language spoken in a couple of countries), while Lang sim is meant to
proxy cultural proximity, imagining that persons whose languages share common roots also
indicate the presence of more similar cultural traits. Religion sim is computed as the
probability that two persons in different countries share the same broad religious group.
Somatic dist is based on the weighted average of four distinct somatic characteristics. These
last two variables are available only for a group of 14 countries (all of them current member
of the European Union, plus Norway – See the Appendix).
We expect the degree of protection of Intellectual Property Rights (IPRij) (the index
of patent rights of Park, 2008) to influence choices of internationalization. On the one hand,
better IPR protection favors international collaboration, since it limits the possibility that
ideas, by travelling the distance, get stolen. However, facing a deficient IPR protection at
home may induce important firms to locate their R&D activities in countries affording
better protection. Also, inventors in a country affording poor IPR protection may have a
further stimulus to look for employment in the R&D labs of multinational corporation, that
can shield themselves better by patenting their inventions through their headquarters.
Adding to the subtlety of the issue, we should consider that the relation between IPR
protection and inventive activities is endogenous, because multinational corporations are
likely to lobby for stronger IPR, both at home and, depending on their degree of
internationalization, abroad.
We also consider measures of Foreign Direct Investment (FDI). We use a set of
eight variables, expressing, for each country in a pair, flows or stock, inward or outward.
3
A survey of senior executives representing a wide range of industries, carried out by The
Economist Intelligence Unit (2007), indicated “cultural differences” as the third most important risk
to developing global innovation networks (the first and the second one being, respectively, theft of
The source of the data, expressed at current US Dollars4 at current prices and exchange
rates, is UNCTAD (2009). These measures represent FDI regardless of its motives, and we
should expect that only a small component is dedicated to R&D activities abroad.
Moreover, the measures are aggregate also in the sense that no distinction on the recipient
or source country is made.
Last, we include a series of country-specific fixed effects, one for each country and
year – the two D variables. This specification is quite flexible, including all possible fixed
effects, short of estimating a Fixed-Effects panel model. The presence of a year dummy
interacted with the country dummies is coherent with the discussion in Baldwin and
Taglioni (2006). We estimate the basic model using data on pairwise collaboration between
countries that are directly computed from our set of about 225 thousand international
patents. We compute all bilateral ties for a total of 42 countries (see the Appendix), and we
also consider a subgroup of 14 countries, all of them European, for which the Trust and
Somatic dist variables are available. The maximum number of pairwise linkages is
T N
N⋅( −1)⋅ , where N is the number of countries (either 42 or 14), and T the number of
years under consideration (16, from 1990 until 2005). The actual number of observations
used will in fact be sensibly smaller, due to the presence of many zero pairwise linkages,
that the logarithmic transformation transforms into missing values. The presence of a
limited number of further missing values is due to the incomplete coverage of the FDI data.
We obtain our main results using the OLS estimator. Santos Silva and Tenreyro
(2006) argue that the nature of the estimation problem in a gravity model may induce a
form of heteroskedasticity of the error term that, due to the log transformation of the data,
leads to the inconsistency of the OLS estimator. They argue that a Poisson estimator is not
prone to the problem (see also Martínez-Zarzoso et al., 2009, for a critical appraisal of the
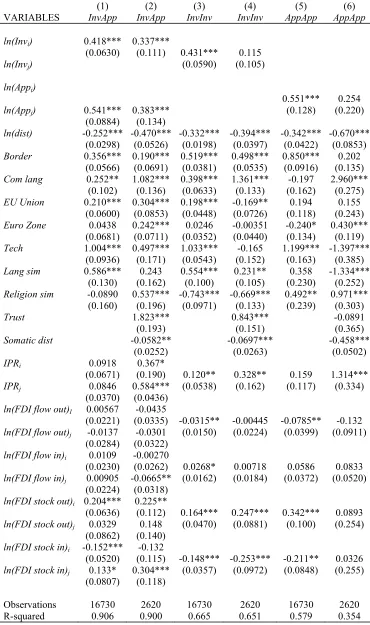
suggested approach). Estimates obtained using this method, that we report in Table A.1 in
the Appendix, do not differ sensibly from the OLS results. In commenting them, we will
indicate the few instances when the two methods lead to different conclusions.
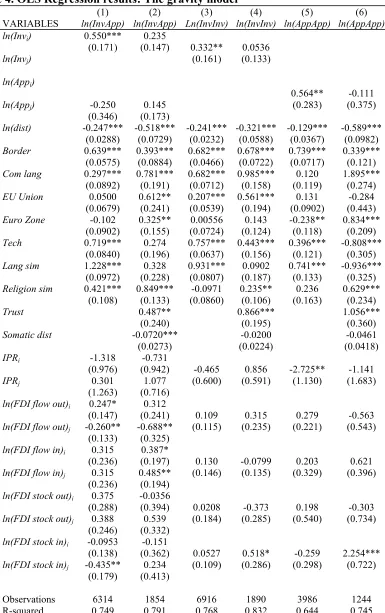
Table 4 shows the estimates of the gravity model for the three types of
internationalizations. In interpreting the results, note that same variables indexed i and j
will have estimated coefficients that are numerically the same when explaining InvInv or
4
The nature of the dummy variables included – see below – makes unnecessary expressing
AppApp internationalization, because the related measures are symmetric. We report these
estimates only once (columns from 3 to 6). On the other hand, InvAppij≠ InvAppji – see the
discussion in Section 2 – so that variables indexed i and j will not have the same impact on
the more general measure of internationalization.
Odd-numbered columns are on the whole group of 42 countries, while
even-numbered columns show the results for the group of 14 European countries5. Sharing a
common border and a common language has a significantly positive effect on all types of
international inventive collaboration. Distance is found to negatively affect international
collaboration, with an elasticity that, for the broader group of countries and for InvApp
internationalization, is approximately equal to 25%. For all types of internationalization, we
find higher estimates when we consider the subset of European countries. Being a member
of the European Union, or of the European Monetary Union, also positively affects the
level of internationalization. The measure of inventive proximity, Tech, positively
influences InvApp and InvInv internationalization, while for the infrequent cases of
AppApp internationalization the sign of the impact depends on whether we focus on the
whole set of countries, or on the smaller subset.
Table 4 about here
The variables expressing cultural distance generally are significant and with the
expected sign. Language sim has a stronger estimated effect on the larger group of
countries. Its effect is estimated to be negative in the case of AppApp internationalization
in the subset of European countries. The effect of Religion sim if for the most estimated to
be positive. Trust and Somatic dist, available only for the group of European countries, are
for the most precisely estimated.
The Poisson estimates indicate that, for the European sample, better IPR protection
improves internationalization, in most cases. OLS estimates are contradictory, indicating in
one case a negative effect of IPR protection. We similarly fail to find significant and
unambiguous effects of the FDI variables, again with differences between the responses
5
Estimates have also been carried out on the whole set of countries that are currently member
of the European Union (without the Trust and Somatic dist variables), with results that in all cases
are similar to the ones obtained for the subgroup of 14 European countries. The results are available
provided by the two alternative estimators – the Poisson estimator indicating a positive
effect of the outbound FDI stock and, on InvInv internationalization, a negative one of the
inbound stock.
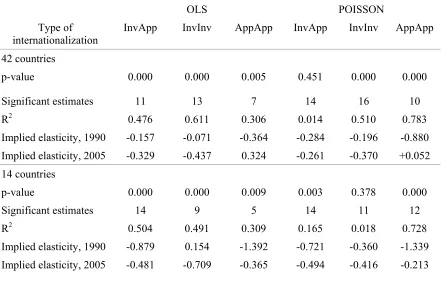
To appreciate any change in time of the estimates of the distance elasticity, we
estimate the gravity model separately for each year, using both estimators, and on both
samples. We exclude from the list of regressors IPRij and the eight variables representing
FDI flows and stocks, considering that we found their explanatory power to be limited. The
full set of results (available from the author) indicate that, by and large, for most years we
find the same results that emerged when pooling the 16 years of observations. In Table 5
we provide a summary of the results. Focusing on the broader concept of
internationalization, InvAppij, the yearly estimates of the distance elasticity are significant
in between 11 and 14 years, depending on the sample and on the estimation method used.
We adopt a simple device aimed at representing the changes in time of the yearly
estimates of the distance elasticity. Using weighted OLS, we estimate a bivariate regression
where the independent variable is the set of estimated distance elasticities, a total of 16 of
them, and the explanatory variable is time (expressed as years, from 1990 to 2005). The
weight of each observation is set equal to each estimated distance elasticity divided by its
standard error, so as to give more importance to those coefficients that are estimated with
more precision. We carry out this exercise for all types of internationalization, with
elasticities obtained using both types of estimators, and on both groups of countries. We
report the results in Table 5, where the p-value is of the estimated coefficient of the time
variable. The fitted line is then used to compute the predicted distance elasticities for the
first and the last year of the period under considerations.
Table 5 about here
When we consider the group of 42 countries, the OLS estimates diminish
significantly in time for the broader definition of international collaboration, InvAppij.The
Poisson estimates, on the other hand, do not show any significant tendence to either
increase or decrease during the period under considerations. Both OLS and Poisson
estimates, on the other hand, concord in indicating that distance elasticities have increased
in time for InvInv internationalization, and decreased for the infrequent cases of AppApp
we obtain the estimated elasticities on the smaller group of European countries (lower part
of Table 5). In these cases, unambiguously, we observe yearly estimates of the distance
elasticity that are smaller in later years.
5. Discussion
In this paper, we have discussed the extent, and researched the causes of,
internationalization of innovative activities, using a dataset on priority patent applications
filed at any patent office in the European Union, in the United States and in Japan between
1990 and 2005. We found that the degree of internationalization of innovative activities,
while increasing over time, is still relatively limited. Such a lasting "lack of globalization"
may come as a surprise, at least if it is observed in the light of the amazing intricacy of the
relations that govern today's international division of labor.
R&D internationalization, however, is now more pronounced than it was 20 years
ago. Much evidence, both of anecdotal, and of a more systematic nature, indicates that in
the more recent years there was an important increase in off-shoring of R&D activities to
countries such as China and India, with rationales shifting from the traditional “home-base
exploiting” to “home-base expanding” motives. Our data, up to the year 2005, do not detect
these changes, that possibly will take some time to manifest themselves in patent statistics.
We stay away from the debate on what exactly are the emerging forms of global
R&D efforts. Types of more open innovation, as described in Chesbrough (2003), are quite
likely to be part of the story. However, adopting catchphrases to describe complex realities
is risky and, in the case at hand, may conduce to confusion between the conceptually
distinct ideas of “openness” and “internationalization” of innovative processes6. The whole
issue, while certainly deserving the attention of researchers, is outside of the scope of our
work.
We studied the factors that determine the observed level of internationalization
using a gravity model. From our results, it emerges unambiguously that distance negatively
6 For example, for some firms, constructing an ecosystem conducive to open models of
innovation may be an alternative to more traditional off-shoring of tightly controlled R&D labs.
That is, in some cases we may observe more openness leading to less internationalization. Evidence
on emerging models of open innovation, mostly seen from the point of view of internationalization,
affects the internationalization of R&D activities, both as expressed by the presence of a
border in common between couple of countries and, most importantly, by physical distance,
with estimated elasticities that are however sensibly lower than the ones usually found in
the literature on international trade. We posited that the physical distance variable could
proxy for a broadly defined concept of cultural distance, and in fact we found that variables
meant to capture cultural distance are in most cases highly significant. However, these
measures do not succeed in explaining the role of physical distance away. Just as in the
debate on international trade, we find that physical distance matters in determining the
strength of bilateral ties.
Year-by-year estimates of the distance elasticity allowed us to appreciate its
changes in time, although with the obvious caveat that the period under consideration, 16
years, is certainly a narrow window for this type of exercise. We find evidence that the
impact of distance on InvInv internationalization increased in time. A possible explanation
of this finding would be the following. InvInv internationalization represents collaboration
of inventors from different countries. Many impediments to international collaboration of
various types have decreased over the last decades – think of the lower costs of travel and
of telecommunications, and the increased ease with which tools such as videoconferencing
permit the transmission of forms of tacit knowledge. These changes are reflected in the
overall increase in internationalization that emerges from our data. However, we may argue
that, during the same period, the importance of factors related to cultural distances
(themselves correlated with physical distance) have remained roughly constant, so that their
relative importance has increased.
As for the other types of internationalization, and most importantly, for the more
general InvApp type, the results depend on the group of countries that we analyze. The
relevance of distance on InvApp internationalization may have increased when we observe
the whole group of countries (also depending on the estimation method that we use), while
we find stronger evidence that it decreased if we analyze the subset of European countries.
Most cases of InvApp internationalization are the results of the activities of multinational
firms abroad, as Table 3 shows. In this result, we may see the integrating effect of the
European Union, whose impact is estimated to be positive in most specifications. The
European Union is a policy bundle composed of many ingredients, among which we
mention the presence of a common regulatory framework, a common market, and an
innovation policy that, among other things, explicitly encourages international
understanding of the interaction between public policies and the internationalization of
inventive activities, is outside of the scope of the present work.
We also tend to find a positive impact for a single important element of the
European policy package, namely, being a member of the Euro Zone. This result is best
seen in the light of the debate that followed the contribution of Rose (2000), who found a
significant and economically very strong positive effect of currency zones on international
trade. Later studies tended to confirm the presence of such an effect, but they significantly
reduced its estimated size – see Baldwin (2006).
Regardless of the changes in time that may have occurred, the estimated effect of
distance on the internationalization in Europe is a robust conclusion of our work. One of the
explicit policy goals of the European Commission is to encourage the formation of a
“European research area”.7 We find that innovators in member states “naturally” decide to
collaborate sensibly more frequently with like-minded innovators residing in countries that
are physically and culturally close, that share a border and a language. Without proper
incentives that alleviate the negative effect of distance, this may lead to a cozy integration
among neighbors, a situation not necessarily corresponding to the type of “European
research area” that policy makers have in mind. For this reason, the role of distance should
enter the policy debate.
In Europe, the overall process of integration has reduced many of the impediments
to international R&D collaboration. However, a process of integration may also reduce the
motivations inducing firms to invest resources to carry out a process of internationalization.
Market integration may make it less necessary to set up R&D labs abroad for traditional
home-base exploiting motives – for example, there is less need to adapt one's products to
foreign markets, if technical requirements are standardized. Also, the stronger protection of
IPR that may follow a process of integration, may induce to locate (part) of the innovative
process outside of the boundaries of the firms, by relying more on market for technologies,
and less on R&D labs abroad.
7 See for example the home page of European Commission’s DG Research (the Directorate
General responsible for Science, Research and Technology), declaring that “European Research,
and more specifically the creation of a European Research Area, are now high on the policy agenda
in Europe”. (http://ec.europa.eu/research/index.cfm?pg=why&lg=en . Last accessed on 15 October
We fail to find unambiguous evidence of a significant role of IPR protection. The
reasons could be many, but our discussion in the previous section suggests that the
relationship between the protection of IPR and distinct types of internationalization of
inventive activities is not a simple one, so that further work should be done to disentangle it
– for example, by developing different measures for different aspects of IPR protection, and
by disaggregating measures of internationalization according to some likely important
characteristics, such as, the technological field and the type of applicant. We also failed to
find an unambiguous effect of FDI, with results that also in part depended on the type of
estimator chosen. Using bilateral FDI measures, that are notoriously scanty, would be an
appropriate step better understand the nature of the relation. The fact that no obvious
pattern emerges from our study, however, to some extent also confirms the relevance of the
departure point that we chose for this paper: The internationalization of productive
activities (of which FDI mostly talks), and the internationalization of inventive activities,
References
Anderson, James (1979), The Theoretical Foundation for the Gravity Equation, American
Economic Review 69, pp. 106-116.
Baldwin, Richard (2006), “The Euro's Trade Effect (2006), Proceedings of June 2005
workshop on what effects is EMU having on the Euro Area and its member
countries” European Central Bank
Baldwin, Richard and Taglioni, Daria (2006), Gravity for Dummies and Dummy for
gravity Equations, CEPR Discussion Paper No. 5850
Blum, Bernardo S. and Goldfarb, Avi (2006), Does the Internet defy the law of gravity?
Journal of International Economics, 70, pp. 384-405
Ceglowski, Janet (2006), Does Gravity Matter in a Service Economy?, Review of World
Economy, Vol. 142, pp. 307-329
Chesbrough, Henry (2003), Open Innovation, Harvard Business Press, Cambridge,
Massachusetts
De Rassenfosse, Gaétan, and van Pottelsberghe de la Potterie, Bruno (2007) “Per un pugno
di dollari: A first look at the price elasticity of patents” Oxford Review of Economic
Policy, 23(4), pp. 588-604
De Rassenfosse, Gaétan, Dernis, Helene; Guellec Dominiqueand van Pottelsberghe de la
Potterie, Bruno Patent statistics without the home bias: a corrected count of priority
filings using Patstat, (2009). Mimeo.
Dernis, Helene; Guellec Dominique and van Pottelsberghe de la Potterie, Bruno (2001)
"Using patent counts for cross-country comparisons of technology output", STI
Review, 27, OECD, pp. 129-146.
Dernis, Helene and Khan, Mosahid (2004), Triadic patent families methodology, OECD,
Directorate for Science, Technology and Industry, DSTI/DOC (2004)2
Disdier, Anne-Célia, and Head, Keith (2008), “The Puzzling Persistence of the Distance
Effect on Bilateral Trade” The Review of Economic and Statistics, 90(1): pp. 37-48
European Patent Office (2009a), PATSTAT database, April 2009 Edition
European Patent Office (2009b), Data catalogue for the EPO Worldwide Patent Statistical
Database, April 2009 Edition
Fearon, James (2003), Ethnic and Cultural Diversity by Country, Journal of Economic
Frankel, Jeffrey, and Rose, Andrew (2002), An Estimate of the Effect of Common
Currencies on Trade and Income, The Quarterly Journal of Economics, Vol. 117, pp
437-466.
Guellec, Dominique, and van Pottelsberghe de la Potterie, Bruno (2001), “The
internationalization of technology analyzed with patent data” Research Policy 30,
pp. 1253-1266
Guiso, Luigi; Sapienza, Paola and Zingales, Luigi (2009) Cultural Biases in Economic
Exchange? The Quarterly Journal of Economics, 124(3), pp. 1095-1131.
Kimura, Fukunari and Lee, Hyun-Hoon (2006), The Gravity Equation in International
Trade in Services, Review of World Economics, Vol. 142, pp. 92-121.
Le Bas, Christian and Sierra, Christophe (2002) Location versus home advantages' in R&D
activities: some further results on multinationals' location strategies, Research
Policy 31, pp. 589-609.
Lewer, Joshua J, and Van den Berg, Hendrik (2007), A gravity model of immigration,
Economic Letters 99, pp. 164-167
Martínez-Zarzoso, Inmaculada; Nowak-Lehmann, Felicitas and Sebastian Vollmer (2009),
The Log of Gravity Revisited, mimeo.
OECD (2008), Open Innovation in Global Networks, Paris
Park, Walter G (2008), International patent protection: 1960-2005, Research Policy, Vol.
37, pp. 761-766.
Patel, Pari and Pavitt, Keith (1991), “Large firms in the production of the world
technology: An important case of "non-globalization” Journal of International
Business Studies 22 (1), pg. 1-21
Patel, Pari and M. Vega (1999) Patterns of internationalisation of corporate technology:
location versus home country advantages. Research Policy 28 (2/3), pp. 145-155
Peri, Giovanni (2005) Determinants of Knowledge Flows and Their Effect on Innovation,
the Review of Economics and Statistics, 87(2): pp. 308-322
Rose, Andrew (2000), One Money, One Market: Estimating the Effects of Common
Currencies on Trade," Economic Policy, Vol. 15 (April), pp. 7-45
Santos Silva, Joao, and Tenreyo, Silvana (2006) The Log of Gravity, Vol. 88, No. 4, Pp.
641-658.
The Economist Intelligence Unit (2007) Sharing the Idea: The Emergence of Global
UNCTAD (2009), World Investment Report, Annex Tables. Available online:
http://www.unctad.org/Templates/Page.asp?intItemID=3203&lang=1 (last accessed
Tables
[image:26.595.63.529.419.745.2]Table 1. Fractional counts of three fictitious patents
Table 2. Computation of measures of internationalization of three fictitious patents
∑
= = P p ijp ij Inv InvInv 1j = US j = DE j = FR
i N j ij Inv InvInv =
∑
=1i = US 0.5 0.125 0.375 1
i = DE 0.125 0.3125 0.3125 0.75
i = FR 0.375 0.3125 0.5625 1.25
j N i ij Inv InvInv =
∑
=1 1 0.75 1.25
∑
= = P p ijp ij App AppApp 1j = US j = DE j = FR
i N j ij App AppApp =
∑
=1i = US 1.5 0.25 0.25 2
i = DE 0.25 0.25 0 0.5
i = FR 0.25 0 0.25 0.5
j N i ij App AppApp =
∑
=1 2 0.5 0.5
∑
= = P p ijp ij InvApp InvApp 1j = US j = DE j = FR
i N j ij Inv InvApp =
∑
=1i = US 0.75 0.25 0 1
i = DE 0.375 0.125 0.25 0.75
i = FR 0.875 0.125 0.25 1.25
j N i ij App InvApp =
∑
=1 2 0.5 0.5
I II III IV
p US
Inv , InvDE,p InvFR.p AppUS,p AppDE,p AppFR,p
∑
= N i ip Inv 1 ∑ = N i ip App 1 P=1: Inv: DE, FR, US, US
P=1: App: DE, US
0.5 0.25 0.25
0.5 0.5 0
1
1
P=2: Inv: DE, DE, FR, FR
P=2: App: FR, US
0 0.5 0.5
0.5 0 0.5
1
1
P=3: Inv: FR, US
P=3: App: US, US
0.5 0 0.5
1 0 0
1 1 ∑ = = P p ip i Inv Inv 1
1 0.75 1.25
∑ = = P p ip i App App 1
Table 3. Type of applicant vs. type of internationalization. Sample of 1000 international patents
Type of internationalization
InvApp and:
Type of applicant Only InvApp Only InvInv Only AppApp InvInv & AppApp
MNE HQ 71.0% 60.0% 48.8% 39.3%
MNE SUB 12.8% 12.6% 43.9% 10.7%
Firm 13.3% 18.3% 4.9% 17.9%
Universities - 3.0% 2.4% -
Public Res Inst 0.4% 3.5% - 7.1%
Government 0.6% 0.3% - -
Person 1.7% 2.2% - 25.0%
Sums by column 100% 100,00% 100% 100%
% in sample (n=1000) 53.1% 34.8% 6.5% 5.5% % in pop. (N=224911) 55.6% 31.2% 6.9% 6.2%
Pearson χ2 test on the independence of the two characters (18 degrees of freedom) = 145.9.
P-value = 0.000
Legend:
Type of applicant: A "Firm" is any firm, which is not a multinational corporation, or does not belong to one. MNC HQ: a Headquarter (HQ) of a multinational corporation (MNC), or a subsidiary, or a controlled firm, established in the same country as the headquarter. MNC SUB: a subsidiary of a MNE which is registered in a country different from HQ. Person: a physical person. Public Res Inst: Research institute that are financed mostly by public administrations. University: Universities and other types of higher education institutions.
Table 4. OLS Regression results: The gravity model
(1) (2) (3) (4) (5) (6)
VARIABLES ln(InvApp) ln(InvApp) Ln(InvInv) ln(InvInv) ln(AppApp) ln(AppApp)
ln(Invi) 0.550*** 0.235
(0.171) (0.147)
ln(Invj)
0.332** (0.161)
0.0536 (0.133)
ln(Appi)
ln(Appj) -0.250 0.145
(0.346) (0.173)
0.564** (0.283)
-0.111 (0.375)
ln(dist) -0.247*** -0.518*** -0.241*** -0.321*** -0.129*** -0.589***
(0.0288) (0.0729) (0.0232) (0.0588) (0.0367) (0.0982)
Border 0.639*** 0.393*** 0.682*** 0.678*** 0.739*** 0.339***
(0.0575) (0.0884) (0.0466) (0.0722) (0.0717) (0.121)
Com lang 0.297*** 0.781*** 0.682*** 0.985*** 0.120 1.895***
(0.0892) (0.191) (0.0712) (0.158) (0.119) (0.274)
EU Union 0.0500 0.612** 0.207*** 0.561*** 0.131 -0.284
(0.0679) (0.241) (0.0539) (0.194) (0.0902) (0.443)
Euro Zone -0.102 0.325** 0.00556 0.143 -0.238** 0.834***
(0.0902) (0.155) (0.0724) (0.124) (0.118) (0.209)
Tech 0.719*** 0.274 0.757*** 0.443*** 0.396*** -0.808***
(0.0840) (0.196) (0.0637) (0.156) (0.121) (0.305)
Lang sim 1.228*** 0.328 0.931*** 0.0902 0.741*** -0.936***
(0.0972) (0.228) (0.0807) (0.187) (0.133) (0.325)
Religion sim 0.421*** 0.849*** -0.0971 0.235** 0.236 0.629***
(0.108) (0.133) (0.0860) (0.106) (0.163) (0.234)
Trust 0.487** 0.866*** 1.056***
(0.240) (0.195) (0.360)
Somatic dist -0.0720*** -0.0200 -0.0461
(0.0273) (0.0224) (0.0418)
IPRi -1.318 -0.731
(0.976) (0.942)
IPRj 0.301 1.077
(1.263) (0.716)
-0.465 (0.600) 0.856 (0.591) -2.725** (1.130) -1.141 (1.683)
ln(FDI flow out)i 0.247* 0.312
(0.147) (0.241)
ln(FDI flow out)j -0.260** -0.688**
(0.133) (0.325)
0.109 (0.115) 0.315 (0.235) 0.279 (0.221) -0.563 (0.543)
ln(FDI flow in)i 0.315 0.387*
(0.236) (0.197)
ln(FDI flow in)j 0.315 0.485**
(0.236) (0.194)
0.130 (0.146) -0.0799 (0.135) 0.203 (0.329) 0.621 (0.396)
ln(FDI stock out)i 0.375 -0.0356
(0.288) (0.394)
ln(FDI stock out)j 0.388 0.539
(0.246) (0.332)
0.0208 (0.184) -0.373 (0.285) 0.198 (0.540) -0.303 (0.734)
ln(FDI stock in)i -0.0953 -0.151
(0.138) (0.362)
ln(FDI stock in)j -0.435** 0.234
(0.179) (0.413)
0.0527 (0.109) 0.518* (0.286) -0.259 (0.298) 2.254*** (0.722)
Observations 6314 1854 6916 1890 3986 1244
R-squared 0.749 0.791 0.768 0.832 0.644 0.745
Notes:
Columns: 1, 3 & 5: All (42) countries; 2, 4 & 6: Subset of EU countries, plus Norway (14 countries).
Robust standard errors in parentheses,*** p<0.01, ** p<0.05, * p<0.1
Table 5. Regression results: Changes in time of the distance elasticity. Weighted OLS
OLS POISSON
Type of internationalization
InvApp InvInv AppApp InvApp InvInv AppApp
42 countries
p-value 0.000 0.000 0.005 0.451 0.000 0.000
Significant estimates 11 13 7 14 16 10
R2 0.476 0.611 0.306 0.014 0.510 0.783
Implied elasticity, 1990 -0.157 -0.071 -0.364 -0.284 -0.196 -0.880
Implied elasticity, 2005 -0.329 -0.437 0.324 -0.261 -0.370 +0.052
14 countries
p-value 0.000 0.000 0.009 0.003 0.378 0.000
Significant estimates 14 9 5 14 11 12
R2 0.504 0.491 0.309 0.165 0.018 0.728
Implied elasticity, 1990 -0.879 0.154 -1.392 -0.721 -0.360 -1.339
Implied elasticity, 2005 -0.481 -0.709 -0.365 -0.494 -0.416 -0.213
Notes:
n=16. p-value of the estimated slope of a regression having the estimates of the distance elasticities
(by year), as the dependent variable, and time as the explanatory variable.
The weights are equal to the estimated coefficient of ln(dist_km), divided by its estimated standard
error. Implied elasticities are computed as the forecasts of the distance elasticities for the first and
Figures
Figure 1. International patent, EU27, national averages
EU27 national average United States Japan
Notes:
InvInv | Inv: Eq. 8; AppApp | App: Eq. 8'; InvApp | Inv: Eq. 9; AppInv | App: Eq. 9'
Source of the data: Analysis of the Patstat database (April 2009 release) (See Section 3 for a description). 0 2 4 6 8 % o f i n te rn a ti o na l pa te nt s , U S
1990 1992 1994 1996 1998 2000 2002 2004 Years
InvApp | Inv InvApp | App InvInv AppApp 0 2 4 6 8 10 % o f in te rn a tio n a l p a te n ts
1990 1992 1994 1996 1998 2000 2002 2004 Years
InvInv AppApp InvApp | Inv InvApp | App
0 .1 .2 .3 .4 % of i n ter n at ion al p at en ts , J P
1990 1992 1994 1996 1998 2000 2002 2004 Years
APPENDIX
A. The countries considered for the analysis.
Measures of the internationalization of inventive activities have been computed for a total
of 42 countries. These are:
All OECD countries: Australia, Austria, Belgium, Canada, Czech Republic,
Denmark, Finland, France, Germany, Greece, Hungary, Iceland, Ireland, Italy, Japan,
Korea, Luxembourg, Mexico, Netherlands, New Zealand, Norway, Poland, Portugal,
Slovak Republic, Spain, Sweden, Switzerland, Turkey, United Kingdom, United States);
Countries “invited […] to open discussions for membership to the [OECD]: Brazil,
China, India, Indonesia and South Africa;
Countries included into the “roadmaps” [marking] the start of accession talk [to the
OECD]: Chile, Israel and Russia and (from the site of the OECD, accessed on 15 October
2009); Estonia and Slovenia also belong this group, but they have not be considered for
problems of data coverage.
Countries that, while not belonging to the groups above, are part of the European
Union (with the exclusion of Cyprus and of Malta, whose patenting activities are either
zero or negligible): Lithuania, Bulgaria and Romania; Latvia also belong to this group, but
it has not be considered for problems of data coverage.
Taiwan.
The gravity model is also estimated on a group of 14 countries, for which the Trust
and Somatic dist variables also available. These are: Austria, Belgium, Denmark, Finland,
France, Greece, Ireland, Italy, Netherlands, Norway, Portugal, Spain, Sweden, United
Kingdom.
B. Definition of variables and data sources.
Tech. The technological proximity variable is computed considering the eight top
"sections" (A through H) of the International Patent Classification (IPC) taxonomy. See
http://www.wipo.int/classifications/ipc/en/ (last accessed on 15 October 2009). The
carried out in the paper. Fractional counting is adopted to address all the cases when more
than one IPC category is assigned to a patent.
Com lang. It is equal to 1 if two countries the same language is spoken, 0 otherwise, and it
takes fractional values for multilingual countries. For example, it is equal to one half
between Belgium and France (the presence of a small German speaking minority in
Belgium is ignored), and to one third for the pairs of Switzerland with Germany, France
and Italy.
Trust. From Guiso et al. (2009), based on the Eurobarometer survey.
Som dist. It is based on the distance between a set of four anthropometric measures. The
source is Guiso et al (2009).
Lang sim. The similarity between couple of languages is computed using data from the
Ethnologe Project (http://www.ethnologue.com/), as collected and organized by James
Fearon (see Fearon, 2003). The similarity between two languages is based on the distance
between “tree branches” (“for example [...] Byelorussian, Russian and Ucrainian share their
first three classifications as Indo-European, Slavic, East Branch languages”; Fearon, 2003).
Unlike in Fearon’s work, who obtains his measure by dividing the number of branches that
are in common by the maximum number of branches that any language has (which is equal
to 15), we divide by the maximum number of branches of each couple of language, so as to
take into account that the granularity of the branch definition may be not the same across
languages.
Religion dist. It is the probability that two persons in different countries belong to the same
broad group of religions. The computation is based on data from the World Value Survey
(http://www.worldvaluessurvey.org/), integrated with data from the CIA World Factbook
for the countries not covered therein.
IPR. The source of the data, available for 1995, 2000, 2005 and an average of 1960-1990, is
Park (2008). For the years 1990, 1991 and 1992, the 1960-1990 average has been used.
The years 1993, 1994, 1996 and 1997 are set equal to the observation for 1995. The
observation for year 2000 is also used for the years 1998, 1999, 2001 and 2002. Last, the