The use of indicators for unobservable
product qualities: inferences based on
consumer sorting
Nagler, Matthew G. and Kronenberg, Fredi and Kennelly,
Edward J. and Jiang, Bei and Ma, Chunhui
8 October 2010
Online at
https://mpra.ub.uni-muenchen.de/28409/
The Use of Indicators for Unobservable Product Qualities:
Inferences Based on Consumer Sorting
Matthew G. Nagler, Fredi Kronenberg, Edward J. Kennelly, Bei Jiang, and
Chunhui Ma*
Abstract
Using the dietary supplement black cohosh to demonstrate our method, we employ data on a product characteristic unobservable to consumers to decompose the contribution to consumers’ valuations of observable characteristics into surrogate indicator and direct components. Because consumers are not all “expert appraisers” of the unobservable characteristic, the measured relationship of indicators to the unobservable quality is generally not the one consumers perceive. Consequently, biases that depend upon the nature of consumers’ ineptitude are introduced into the component estimation. The researcher’s inference problem is solved by recognizing that consumers with greater appraisal expertise sort disproportionately to higher quality products. This enables feasible measurement of inept consumers’ relative valuations and conjectures through separate hedonic estimation on high- and low-quality product subsamples. We find that, relative to experts, inept consumers likely underestimate the value of most
observable characteristics in indicating black cohosh product authenticity; however they overweight online product ratings.
Keywords: hedonic analysis, surrogate indicators, asymmetric information, pricing strategy, product strategy.
Prices indicate the product characteristics that consumers value, but they do not tell us
why consumers value them. While in some cases consumers might value a characteristic
intrinsically, in other cases characteristics are valued as a signal, or surrogate indicator, of the
level of some quality that is not directly observable. For example, a knowledgeable owner of a
porcelain vase may find its shape and painted decoration aesthetically pleasing; meanwhile, she
may value the vase’s thickness as an indicator of its authenticity as an artifact of the Ming
Dynasty, rather than, say, because it makes the vase more durable or beautiful (see Brook 1998,
pp. 225-6).
Standard hedonic analysis, which deals in the valuation of observable qualities, would tell
us only that consumers value thickness in a vase. To know why, it is necessary to measure the
unobservable characteristic (here, authenticity), which is not a common element of product
valuation analyses.
This paper demonstrates a method of estimating, as two distinct valuation components,
consumers’ intrinsic valuation of observable characteristics and their valuation of those
characteristics as surrogate indicators. It makes use of unique data measuring authenticity (i.e.,
whether the product contains the key ingredients claimed on the label) for a sample of brands of
black cohosh, a medicinal herb believed to help with menopause symptoms. As a medication,
black cohosh is properly characterized as a credence good, or product for which key
quality-related characteristics, such as botanical authenticity, are not observable even after purchase and
use (Darby and Karni 1973, Dulleck and Kerschbamer 2006). We obtain data on authenticity in
the laboratory through a standard analytical method called high-performance liquid
chromatography. Thus we observe a critical quality-related product characteristic that
hedonic regression equation, we are able to take our analysis beyond the standard hedonic
valuation of observable product characteristics, to gain insight into the extent to which these
characteristics are valued as indicators.
An empirical conundrum is posed, however, by the fact that not all consumers are “expert
appraisers” of key unobservable qualities. Two possibilities exist. First, consumers may suffer
from various forms of unawareness.1 They may not be aware of the need to appraise a certain unobservable quality; or they may be aware of it, but unaware that information at their disposal
from observable characteristics could provide insight into it. Alternatively, consumers may be
aware that an observable characteristic can help in appraisal of an unobservable quality, but they
may not know in what way or to what extent. 2 This second possibility – that consumers are aware, but are inept at appraisal – is the one that poses the problem.
Consider, again, the Ming Dynasty vase for which thickness is a surrogate indicator of
authenticity. If all consumers were expert appraisers, then assuming we could observe
authenticity, it would be possible to use the empirical relationship between thickness and
authenticity to decompose the contribution of thickness to the price of the vase into intrinsic
(e.g., durability) and surrogate indicator components. If, instead, all consumers were unaware
that thickness could be used to diagnose the authenticity of a vase, or unaware that a vase’s
possible authenticity as a Ming Dynasty artifact should be taken into consideration, then there
would likewise be no empirical problem. One would know for a fact that the contribution of
thickness to the price of the vase was entirely based on the intrinsic value of thickness. But now
suppose that consumers are aware that a vase with Chinese motifs might be a valuable artifact,
and also aware (if vaguely) that thickness might help one determine authenticity, but not
authentic per millimeter thickness of the item. If so, then the empirical relationship of thickness
to authenticity would be misleading to determining the basis for how thickness is being valued
by the market. This is because the relationship contains information not being used by the inept
consumer. Thus a decomposition of the consumer’s valuation of thickness based on this
relationship leads to biased estimation of the components. Further, in such a case, it becomes
difficult to interpret the strength of the empirical relationship of authenticity to market prices, as
the relationship conflates the measurement of consumers’ tastes for authenticity with their
ineptitude at appraisal.
We struggle to provide some clarity regarding consumers’ valuations and conjectures
when quality is unobservable by classifying inept appraisal using surrogate indicators into three
cases. A consumer might overshoot, overestimating the power of the surrogate indicator to
predict the unobservable characteristic. Or she might undershoot, underestimating its power of
prediction. Or she might entertain a fallacy, reversing in her prediction the true sign of the
relationship between surrogate indicator and unobservable characteristic. Expert appraisal is
nested in this structure as a boundary sub-case between “overshoot” and “undershoot,” while
unawareness is a boundary sub-case between “undershoot” and “fallacy.”
The empirical problem of extracting information about surrogate indicator use is partially
overcome by inferring consumers’ expertise levels from their choices. Consumers with greater
appraisal expertise are better at discerning quality, and so sort disproportionately to higher
quality products. This enables the researcher to measure the surrogate indicator valuations and
conjectures of inept consumers relative to experts by separately performing hedonic analysis on
high- and low-quality product pools. We demonstrate the method using separate estimation on
The idea that consumers sort across quality grades based on differences in ability is not
new. A number of theoretical analyses have considered market outcomes in situations in which
some consumers are inattentive, unskilled, or otherwise experience higher costs to evaluating
market information than others (Salop and Stiglitz 1977, Nagler 1993, Gabaix and Laibson 2006,
Armstrong and Chen 2009). One consistent finding across this literature is that people with
different abilities select different products (or, more generally, product choice strategies), such
that more skilled, less cost-encumbered individuals get better deals (e.g., lower price per unit
quality) than those less skilled and more cost-encumbered. The present paper’s innovation is an
empirical methodology that uses sorting as a tool to extract information relevant to managerial
decision-making. One may apply the methods developed in this study to create targeted pricing,
product and promotion strategies based on consumer expertise levels. These methods may also
be used in certain contexts to evaluate the effects of public policies (see concluding section).
The existing literature on indicators of product quality focuses largely on how different
surrogate indicators, such as country-of-origin and perceived difficulty of manufacture, influence
consumers’ perceptions of quality (e.g., Quester et al. 2000, West et al. 2002, Jo 2005, Johnson
and Folkes 2007). Much of the research emphasis has been on the role of price as an indicator of
quality; analyses of this have included experimental studies (e.g., Brucks et al. 2000, West et al.
2002) and some meta-analytic reviews (Rao and Monroe 1989, Völckner and Hofmann 2007).
By and large, the studies are descriptive: none provides a methodology for using data on
surrogate indicators and underlying qualities as a tool for making inferences about consumers’
valuations and quality judgments.
Another strand of work, related to the literature on the influence of indicators, looks at
non-durable goods, Burton and Lichtenstein (1989, 1990) considered how consumers’ perceptions of
the price-quality relationship contrast with actual price-quality. Mason et al. (2001) examined
the determinants of consumers’ accuracy at judging brand performance on various attributes.
One thing these studies have in common is that they ascertain consumer accuracy using as
benchmarks for “objective” quality measures that are publicly available to consumers – for
example, ratings in Consumer Reports. The present paper is unique in that its measure of
objective quality is one that consumers could not possibly have observed themselves; thus we
eliminate the possibility that consumers may have improved their accuracy by “peeking” at the
objective measures.
We proceed as follows. We lay out a model of unobservable characteristics and
surrogate indicators, examine the empirical problem posed by inept consumer appraisal, and
consider how consumer sorting addresses this problem. Next, we present results from empirical
analysis of the market for black cohosh. Finally, we conclude.
MODEL
Unobservable Product Qualities
The standard hedonic approach posits a representative consumer who values a product as
a bundle of characteristics. For our purposes, let us consider a product consisting of K
observable characteristics, X
k, k=1,…,K, and one unobservable characteristic, z. Thus the utility
the consumer obtains from consuming the product is given by
(1) U =U X
1,...,XK,z
(
)
(2) logP
i =! +"1X1i+...+"KXKi +#i
where X
ki is the value of the kth characteristic for brand i, and ! is a stochastic disturbance term. Note that z does not enter this regression because it is not observable. Estimation of the
equation in (2) allows measurement of the extent to which the consumer values increments in
each of the observable variables, that is, !k " #P #Xk. But, as discussed in the introduction, it
does not provide information on the extent to which observables are valued as indicators of z.
Nor does one get any sense as to how much the consumer values increments in z.
In general, the value of each observable characteristic X
k provides information about the
value of z, following from some functional relationship
(3) z=z X1,...,X
K
(
)
Assuming !z !X
k is nonzero, Xk is said to be a surrogate indicator of z. If !z !Xk >0, then we say that X
k is a positive indicator of z. If !z !Xk <0, then Xk is a negative indicator of z. We
may therefore decompose the slope coefficients !k in (2) as:
(4) !P !X
k =!P !Xk D+!P !z" !z !Xk
That is, the effect of each observable characteristic on the price of the product is equal to the sum
of its direct effect as a quality with intrinsic value to the consumer and its indirect effect as a
surrogate indicator to the consumer of the valued unobservable characteristic.3
Now suppose we are able to privately observe z, so that z may be included along with the
observable variables. Then (2) becomes
(5) logP
where ! is the stochastic disturbance term for the augmented equation. Also, we may write a
regression equation that determines the value of z, corresponding to (3),
(6) z
i =a+b1X1i+...+bKXKi +!i
where ! is a stochastic disturbance. The estimation of (5) poses problems: because z is not
observed directly by consumers, it must be viewed as endogenously determined based on (6). In
general, characteristics that consumers use to infer the value of z but that are not observed by the
researcher will be correlated with variables that consumers value intrinsically and that are not
observed by the researcher; that is, ! is correlated with !. Thus the coefficients in (5) are
estimated with bias. To resolve this problem, it is necessary to instrument for z with a subset of
the X
k. Importantly, this can only be accomplished if one can identify ex ante at least one
observable characteristic, X
k*, that the consumer does not intrinsically value at all, hence !k* =0. This is needed to ensure that the exclusion criteria are met for identification of z in the
instrumented version of (5).
Properly instrumenting for z with zˆ yields
(7) logP
i =!!D+ !
"zˆ i +
!
#1DX
1i+...+ !
#KDXKi+$!i
which may be efficiently estimated. In (7), the effect of the X
k on price through z is controlled
for, so a decomposition has been effected. The coefficients on the X
k represent the direct effect
of the X
k on price, !P !Xk D, purged of the effect that the Xk have as indicators of the value of
z. Since the coefficient on z is !P !z, it appears that by estimating (2) and (7), we may obtain
each component in (4).
The above estimation procedure makes a critical assumption that all consumers
incorporate the full !z !X
k in their valuation of the Xk. This is because including zˆ in (7)
controls for the !z !X
k based on the actual empirical relationship of z to the Xk. Thus it
assumes that consumers are aware of all the information each observable characteristic provides
about the value of z. This is true if consumers are expert appraisers of z, but it is not true if they
are not.
Let us continue to maintain the assumption of a single representative consumer, but allow
that the consumer might not be an expert appraiser of z. In light of this, it is necessary to be
more precise about what we mean by !z !X
k. Let us define !z !Xk T as the total information
content that X
k provides on z, which in turn may be thought of as the sum of two components:
!z !X
k A, the component the consumer is aware of or presumes in her appraisal of z; and
!z !X
k U, the component the consumer is unaware of (i.e., the gap between the actual !z !Xk T
and what the consumer presumes). With this newly defined structure, the decomposition in (4) is
re-written as
(8) !P !X
k =!P !Xk D +!P !z" !z !Xk A
reflecting that the surrogate indicator influence of the X
k on prices occurs only through that
portion of the X
k’s explaining power that the consumer presumes.
Now it may be seen that estimation of (7) actually yields !P !X
k D" !P !z# !z !Xk U as
the coefficients on the X
k, not the !P !Xk D; the latter are unrecoverable without knowing the
extent and nature of the consumer’s inept use of each surrogate indicator X
estimation of (7) provides biased estimates of the !P !X
k D, where the bias is given by
! "P "z# "z "X
k U. The sign of the bias for each Xk depends on three things: whether the
unobservable characteristic z is valued positively or negatively by the market (i.e., the sign of
!P !z), whether X
k is a positive or negative surrogate indicator of z (i.e., the sign of !z !Xk T),
and the nature of consumers’ ineptitude in using X
k to appraise z (i.e., the relationship of
!z !X
k A to !z !Xk T).
Delving into this last item in greater detail, let us assume that consumers exhibit a
consistent form of ineptitude for each X
k, that is, the relationship of !z !Xk A to !z !X
k T does
not vary for a given k. We classify this relationship into three mutually exclusive and
collectively exhaustive cases based on the value of µk !
"z
"Xk A
( )
"z"Xk T
( )
. First, suppose µk >1.This implies consumers sign the relationship between X
k and z correctly but perceive that Xk
moves z more than it actually does. In this case, consumers overshoot. Second, suppose
µk !
( )
0,1 . This implies consumers sign the relationship between Xk and z correctly but
perceive that X
k moves zless than it actually does. In this case, consumers undershoot. Third,
suppose µk <0. This implies consumers sign the relationship between Xk and z incorrectly –
that is, they perceive z rises with X
k when it actually falls, or falls with Xk when it actually
rises. In this case, consumers are said to entertain a fallacy about the X
k. Complete unawareness
of a surrogate indicator would be represented by the borderline value µk =0, while for expert
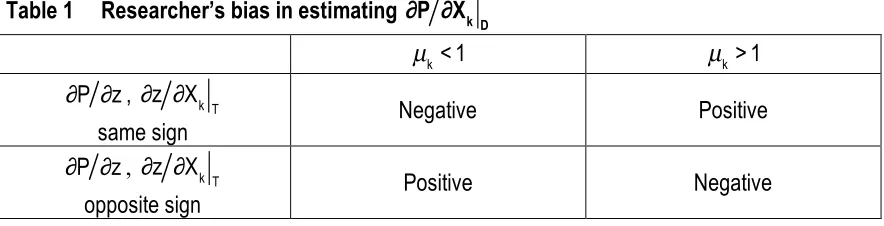
Table 1 summarizes the researcher’s potential bias outcomes based on this classification.
For example, for a positively valued unobservable characteristic and positive surrogate indicator,
the estimate of !P !X
k D is positively biased when consumers overshoot. Intuitively, this is
because consumers assign more surrogate indicator value to the variable then merited by its
actual empirical relationship to the unobservable characteristic; so their intrinsic valuation of the
variable, as a component of overall valuation, is overestimated when the estimation considers the
actual empirical relationship instead of the perceived one. Note that while we may speak of the
biases in estimation conditional on each consumer conjecture, we normally are able to measure
neither the estimation bias nor the conjecture.
<Insert Table 1 about here>
The empirical conundrum created by consumers’ ineptitude at appraisal may be viewed
through another lens by estimating (6), which shows the actual empirical relationship between
the X
k and z. This relationship, as we have discussed, is generally not known to the non-expert
consumer. Thus the coefficients on the X
k are the !z !Xk T rather than the !z !Xk A. In
practical terms, though estimation of (6) may indicate a good fit of z with the X
k, it is not
necessarily the case that consumers have in actuality obtained a good fix on z.
The measure of !P !z obtained from estimating (7) also reflects the conundrum. The
coefficient varies with two effects that are not separately identified: the consumer’s valuation of
z, and the consumer’s composite competence at using the surrogate indicators of z. Thus a small
!P !z conflates consumer unawareness with respect to z with consumer apathy. It is possible,
moreover, that !P !z takes the “wrong” sign, that is, negative for a characteristic that consumers
fallacious that consumers perceive an unobservable characteristic to be more present when it is in
fact less present. Thus an unobservable characteristic desired by consumers could actually be
valued negatively by the market.
Differences in Appraisal Expertise
Let us now consider the possibility that not all consumers are equally inept: some may be
expert appraisers while others are less skilled. Generally, not all people will have the same
exposures or experiences that enable them to learn. Even if they did, differences across
individuals would lead to different learning with respect to the same exposure. The consequence
is differences in knowledge and appraisal expertise across individuals.
To model this, let us begin by assuming that consumers differ only with respect to their
appraisal expertise, and that they are identical with respect to their tastes for product attributes.
That is, different consumers j will be characterized by different levels of !z !X
k A(j) for each k.
This will tend to result in different levels !P !X
k(j) for each consumer; however, the direct
valuation components, !P !X
k D, will be the same for all. Appraisal expertise may be defined
in an overall sense based on the relative ability of different consumers in essence to fit (6) from
the X
k using their conjectures about the !z !Xk . Specifically, consumer j’ is “more expert at
appraisal” than j” if !z !Xk U (j')
(
)
2"Xk #
$% &'( k
)
< !z !Xk U(j")
(
)
2"Xk #
$% &'( k
)
, where Xk = Xki
i
!
; that is,if her weighted sum of squared conjectural error is lower.4 Thus less-expert individuals, so defined, are more prone to errors in distinguishing high-z brands from low-z brands.
The assumption of differences in expertise across consumers has implications for the
which there are two brands, H and L, and two consumers, j’ and j”. Assume H exhibits higher
quality with respect to the unobserved characteristic, i.e., zH >zL. Suppose the two consumers
have identical conjectures with respect to all the !z !X
k except for one, and for that k’ let
!z !X
k'U(j') < !z !Xk'U(j") . Thus consumer j” is less expert than j’. It follows that j” is more
likely than j’ to conclude erroneously that H is the low-quality product and L the high-quality
product. Thus, given any price pair for the two products, j” is more likely to choose L, all else
being equal; that is, for a given price, j” is more likely to conclude (erroneously) that L is the
better buy based on her erroneous appraisal of z
H and zL. We can see that consumers who are
more expert at appraisal will tend to sort to the high-quality product, while inept consumers sort
to the low-quality product. Sorting of consumers will not necessarily be perfect; however, there
will generally be differences in the average expertise of consumers across product pools
correlated with the level of unobservable characteristic.
Consumer sorting based on expertise levels has important empirical measurement
implications, observable in our simple model. Let us use subscript E to represent the relatively
expert consumers that sort to the high-quality product, and I to represent the relatively inept
consumers that sort to the low-quality product. Estimation of (2) restricted to high-quality
products provides a composite !P !X
k(E) for each k, while estimating the same equation for
low-quality products provides !P !X
k(I) . Using (8), we may write out the implicit components
of the coefficients pertaining to experts and inept consumers
(9) !P !X
k(E) =!P !Xk D+!P !z(E)" !z !Xk A(E)
(10) !P !X
where !P !z
(E) and !P !z(I) represent, respectively, how experts and inept consumers
collectively value z while !z !X
k A(E) and !z !Xk A(I) represent the surrogate indicator value
that each group attributes to Xk. Note that we are unable to estimate these components directly:
z is a constant for the high- and low-quality subsamples, so we cannot include it in the equation.
However, (9) and (10) do indicate that the difference in the coefficient estimates for the constant
term provides an estimate of !P !z
(E) " !P !z(I) .
Subtracting (9) from (10) yields the relative valuation bias of inept consumers for each
Xk,
(11) !P !X
k(I) " !P !Xk(E) =
(
!P !z(I)" !P !z(E))
dz dXk A(I) " !P !z(E)#dz dXk U(EI)This bias is the sum of two components: inept consumers’ relative error in valuing z, weighted
by their surrogate indicator conjecture about Xk; and their relative error about the role of Xk as
indicator, dz dXk U
(EI) !dz dXk A(E) "dz dXk A(I), weighted by the experts’ valuation of z. Note
that dz dX
k U(EI) represents a generalization of dz dXk U !dz dXk T "dz dXk A from the
previous section, in which the conjectures of the relative experts who sort to the high-quality
product replace the total information content represented by the subscript T. We observe that the
intrinsic valuation of Xk plays no role in the bias; this follows from the presumption that all
consumers have identical tastes for product attributes. Intuitively, the relative valuation bias tells
us how valuations of Xk purely as a surrogate indicator differ for consumers sorting to
low-quality versus high-low-quality products.
A corresponding relative conjectural error, µk(EI) !
"z "X
k A(I)
"z "X
k A(E), generalizes µk;
defined, respectively, as µk(EI) >1, µk(EI) !
(
0,1)
, and µk(EI) <0. Whereas inferences could notdrawn about µk, the sorting of consumers does allow us to draw inferences about µk(EI), based
on (11). Table 2 summarizes. Inferences depend upon the sign of !P !X
k(I) " !P !Xk(E),
whether the unobservable characteristic is positively or negatively valued, and whether the
surrogate indicator Xk is a positive or negative one with respect to the unobservable
characteristic. The table’s results depend additionally on the maintained assumption that both
experts and inept consumers consistently and correctly value z as positive or negative; this
enables us to posit !P !z
(E) >!P !z(I) >0 for a positive z, and !P !z(E) <!P !z(I) <0 for a negative z. We also maintain the assumption that expert consumers are sufficiently expert that
they are not fallacious, though the inept consumers could be.
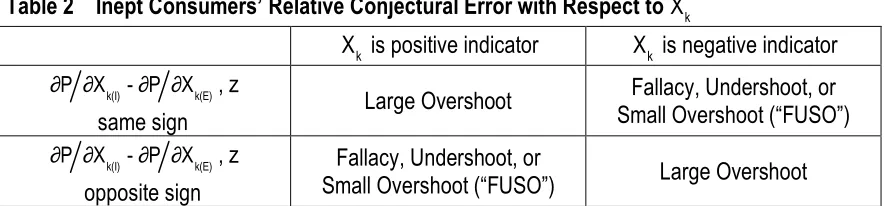
<Insert Table 2 about here>
Table 2 shows that the researcher may mainly distinguish only situations in which inept
consumers overshoot substantially from situations in which they do not. For example, a positive
surrogate indicator of a positively valued unobservable characteristic corresponds to a positive
bias in inept consumers’ valuations only when inept consumers assign substantially more
surrogate indicator value to the characteristic than is warranted. Otherwise, the bias will be
negative. Note that a negative valuation bias will follow even for modest overshooting, because
a negative first term may overwhelm a positive second term in (11). Intuitively, the inept
consumers’ failure to identify the positive unobservable characteristic when it is present causes
them to undervalue its presence in general. This drags down the surrogate indicator value of all
observable characteristics.
The market for black cohosh provides an opportunity to illustrate the use of unobservable
product qualities in hedonic analysis and, in particular, to demonstrate the inferences that
researchers may make based on consumer sorting.
Background
A plant native to North America, black cohosh (Latin name Actaea racemosa, formerly
Cimicifuga racemosa)was used historically by Native Americans for a number of medicinal
purposes. Over the past 50 years, it has gained popularity in Europe, and more recently North
America, as an herbal supplement for treating menopausal symptoms. As a dietary supplement,
black cohosh is subject to regulation in the United States by the Food and Drug Administration
(FDA) under the Dietary Supplement Health and Education Act (DSHEA). Following DSHEA’s
main premise, the rules that cover labeling and good manufacturing practices for dietary
supplements more closely resemble those that govern foods than the FDA’s rigorous drug
regulations. Accordingly, supplements require no premarket clinical testing or approval. Since
DSHEA was enacted in 1994, the number of products to which it has applied has grown from
4,000 to approximately 30,000. Over the same period, FDA funding for supplement oversight
has declined. Consequently, the agency has recently faced severe constraints in its efforts to
enforce its rules against supplement mislabeling and contamination (Wechsler, 2007).
Mislabeling of black cohosh has been recently documented. In a laboratory study of 11
products labeled as pure black cohosh, Jiang et al. (2006) detected adulteration in four. Three of
these products contained marker compounds for a lower-cost Asian Actaea species, but not those
black cohosh. The medicinal uses of Asian Actaea differ from those of American black cohosh,
and, as noted in National Pharmacopoeia Committee (2005, 50), the health consequences of
substitution are not known.
Data
Our current laboratory analysis expands the sample of Jiang et al. (2006) to include a
total of 38 distinct products labeled as black cohosh.5 Following the procedure outlined in their study, 6 we employ a combined method of high-performance liquid chromatography –
photodiode array detection (HPLC-PDA) and selected ion monitoring liquid chromatography –
mass spectrometry (SIM LC-MS). The method observes multiple ions in the products in order to
evaluate whether the products contain black cohosh. The results of the authentication analysis
were roughly consistent with Jiang et al.’s results. 25 out of the 38 products were found to
contain black cohosh, while the other 13 did not. Thus, approximately 66% of products
contained black cohosh in the current study, as compared to 73% analyzed by Jiang et al. For
obvious reasons, we withhold identifying information on the products studied, though in what
follows we do report average prices and regression results incorporating the authenticity data.
We supplement our authenticity data with data on consumer-observable characteristics
for the sampled products, which we collected as part of an earlier hedonic study of black cohosh
that did not account for authenticity (Nagler et al., 2010). We visited 20 stores in New York
City and the lower Hudson River Valley and collected non-promotional retail prices for black
cohosh products sold in the stores. In total, 55 price observations were made representing the 38
laboratory-tested black cohosh products in the sample. In addition to the price data, other
all the information appearing on the label, including ingredients lists and the precise wording of
all label verbiage. Using standard Internet search techniques (e.g., Google), we also found and
collected online consumer ratings of the brands represented.7 All data on observable characteristics were collected during the summer and fall of 2007.
In all, in addition to PRICE (the retail price), the following variables were populated for
each observation:
1. NYC, a dummy variable indicating whether the store where the price was observed
was located in New York City;
2. RETAILER BRAND, a dummy variable indicating whether the product is a retailer’s
brand (e.g., Whole Foods, Vitamin Shoppe);
3. INGREDIENTS, the number of commonly-perceived “active” ingredients listed on
the label;
4. VEGGIE, a dummy variable indicating whether the product is suitable for
vegetarians, based on the ingredients or an explicit label affirmation;
5. KOSHER, a dummy variable indicating whether the product is kosher, based on an
explicit label affirmation;
6. STANDARDIZED, a dummy variable indicating whether the label claims the product
contains a standardized component or set of components, as determined by
industry-recognized methods (a quality assurance measure);
7. SIDE EFFECTS, a dummy variable indicating whether the label warns of side
effects;
8. SAFE, a dummy variable indicating whether the label contains the word “safe” or
9. RATED, a dummy variable indicating whether an online consumer rating could be
located for the particular brand of black cohosh;
10. SUM OF RATINGS, the total of the ratings located for the brand (with individual
ratings normalized to a 1-point scale);
11. TIME SUPPLY, the number of days of supplement supplied per package, calculated
as the number of units (e.g., tablets) per package divided by the number of units per
day in the recommended dosage (or the maximum number of units per day in those
cases where a range was given);
12. CERTIFIED, a dummy variable indicating whether the label contains the word
“certified”;
13. GUARANTEED, a dummy variable indicating whether the label contains the word
“guarantee” or some derivative;
14. CLAIMS, a dummy variable indicating whether the label makes an affirmative
therapeutic claim with respect to a specific symptom.
We partition these variables into two groups, “group A” (#1-11) and “group B” (#12-14).
Group A consists of characteristics hypothesized to have a direct effect on each product’s price.
Group B consists of characteristics hypothesized to affect consumers’ valuations (hence prices)
only through their influence on consumers’ perceptions of the product’s authenticity. For
example, the word “safe” on the product label, we propose, conveys value to consumers that
might result in a price premium because consumers perceive the product so-labeled to be safer,
and consumers value safety. Meanwhile, “certified” conveys value to consumers only as a
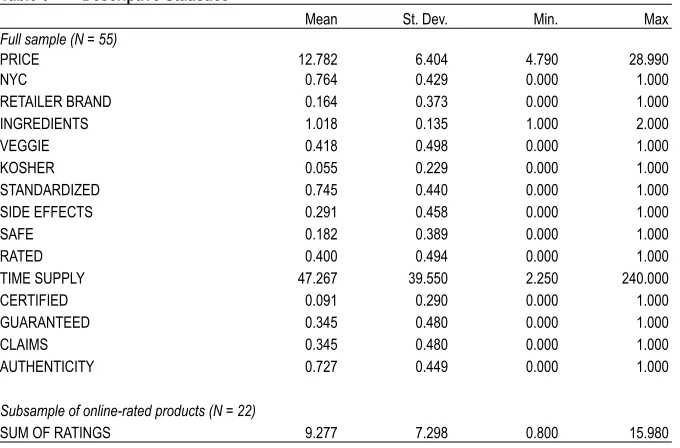
Table 3 displays descriptive statistics for our data.8 <Insert Table 3 about here>
Estimation on the Full Sample
We begin by estimating the basic hedonic regression model (2) to show the total effect of
observable product characteristics on price. For the X
k, we include all of the Group A variables
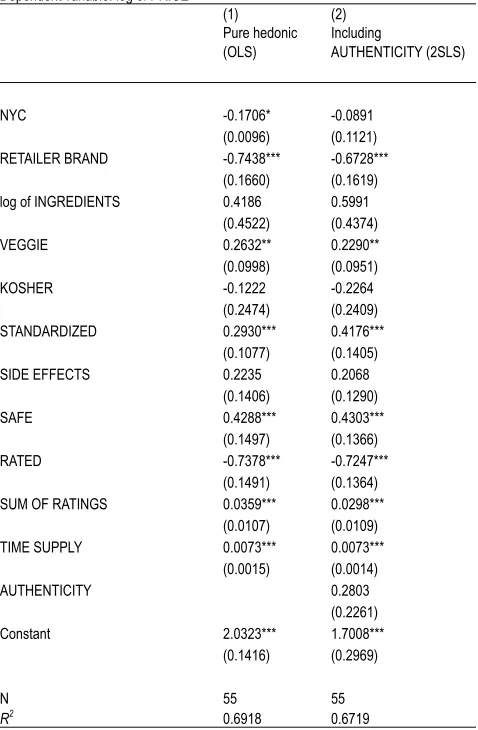
(#1-11) listed above. Table 4 (first column) shows the results of this estimation. The high
R-squared suggests we have captured a substantial portion of the variation in price with our
included observable characteristics; most of these have a significant influence on the price. The
results of the regression are largely consistent with those of the hedonic regressions estimated on
a larger sample in our earlier paper (Nagler et al. 2010. We refer the reader to that paper for a
detailed interpretation of the coefficients.)
< Insert Table 4 about here>
In the second column of Table 4 we present the results of estimating (7), the basic
hedonic model augmented with authenticity. As discussed in the model section, authenticity
must be treated as endogenous, therefore we must instrument for it in our regression. We do so
using the Group B variables (#12-14) listed above. As these variables are hypothesized not to
appear in (2), the system is fully identified, and we may proceed with estimation by two-stage
least squares (2SLS).9 The coefficients on the X
k in this regression, denoted !kD in (7), yield
the influence of each X
k on the log of price, purged of their influence on price through
authenticity. Authenticity is insignificant in this regression, but this may be the consequence of
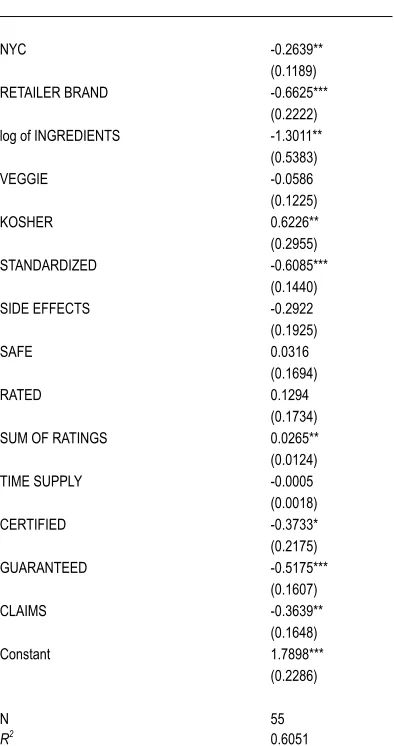
To understand the relationship of authenticity to observables, we estimate (6). Here, the
X
k include all variables #1-14. The results are shown in Table 5. As discussed in the model
section, these results show the true empirical relationship of the observables to unobserved
authenticity. Thus, positive indicators (e.g., KOSHER) take positive signs, while negative
indicators (e.g., STANDARIZED) take negative signs. Since consumers are not expert
appraisers in general, the relationship that they infer between the observables and authenticity
will tend to differ from what the results in Table 5 show.
< Insert Table 5 about here>
Several of the observable characteristics we tracked have a significant relationship to
authenticity. It is interesting to note that, while authenticity would likely be positively valued by
the market if it were observable, the signs of the coefficients on the X
k are not always the same
in our estimation of (6) as they were in our estimation of (2). For example, STANDARDIZED is
a significant positively-valued characteristic overall, but it is a significant negative indicator of
authenticity, thus its effect on price through authenticity is negative. One may observe from
Table 3 that purging STANDARDIZED of its negative influence on price as an indicator of
authenticity increases the size of its overall positive price effect.
Perhaps more striking, a number of label words that seem intended to reassure consumers
about authenticity turn out to be significant negative indicators of actual authenticity:
CERTIFIED, GUARANTEED, and CLAIMS (as well as STANDARDIZED) all take significant
negative coefficients in the regression. There may be a number of possible marketing
explanations for why these words appear on labels. However, their persistent presence seems to
point to the ineptitude either of a significant portion of consumers or of black cohosh marketers.
counter-indicate authenticity and would tend to steer clear of the associated products. This
would induce savvy marketers to remove the words from their products’ labels.
It is also interesting to note that our X
k, taken together, explain more than three-fifths of
the total variation in authenticity. It is fair to say that the potential exists for fairly effective
appraisal of black cohosh by knowledgeable consumers.
Subsample Estimation: Inferences Based on Sorting
To gain insight into the valuation biases and conjectural errors of inept consumers
relative to more-expert consumers, we re-estimate (2) separately on the subsamples of authentic
products and non-authentic products. Consistent with the first column of Table 4, we include all
Group A variables.
The first two columns of Table 6 display the results of the estimation. A number of the
explanatory variables are omitted from the regressions for either the authentic or non-authentic
model because they take a constant value across the corresponding subsample, and so provide no
variation as a basis for estimating a coefficient. Their omission from the regression only affects
the size of the constant term, and so has no relevance to the coefficients on included explanatory
variables. However, it makes it impossible to compare constant terms between the models as a
measure of the relative valuation of the unobservable characteristic, per our discussion in the
model section.
<Insert Table 6 about here>
There are stark differences in the coefficients estimated for the explanatory variables on
the two subsamples. Under the assumption that the buyers of authentic and non-authentic black
represent differences in valuation of the observable characteristics purely as surrogate indicators.
Given that consumers more capable at appraising black cohosh likely tend to sort to the authentic
products, the coefficient differences may be characterized as representing the relative bias of the
relatively inept consumers who buy the non-authentic products. We display the bias explicitly in
the third column of Table 6.
We use our relative bias measures and the decomposition in (11) to determine the relative
conjectural error of the inept consumers. We employ the classification in Table 2, taking the
presumption that authenticity is a positively valued quality, and using the information in Table 5
on which surrogate indicators are positive and which are negative. The last column of Table 6
reports our findings.
The results are very interesting. With respect to most surrogate indicators, the relatively
inept consumers appear to undershoot – or else, entertain fallacies or modestly overshoot – in
their conjectures. This suggests either unawareness or tentativeness about most of the indicators
of authenticity. But there is one exception: inept consumers overshoot substantially with respect
to the sum of online ratings. That is, they place too much weight on the level and frequency of
online ratings as an indicator of high-quality black cohosh products. We will discuss the
possible implications of this finding in the next section.
CONCLUSIONS
The study presented in this paper has used data on a consumer-unobservable
characteristic to cast light on consumer decision making under uncertainty. Our analysis suggests
just to the issue of what information consumers have before and after purchase, but also to their
expertise at using it. Consumers who are inept at appraisal may under- or over-weight
observable characteristics in their attempts to ascertain unobservable qualities. These tendencies
result in problems both for the consumer and the researcher. Consumers arrive at inaccurate
determinations as to which products are high- and low-quality and their product valuations are
correspondingly erroneous. And marketing researchers who use the empirical relationship
between observable and unobservable qualities to reconstruct consumers’ surrogate indicator
valuations of observable characteristics arrive at biased estimates.
The problem for researchers seeking to extract relevant information about surrogate
indicator use may be partially resolved by recognizing that consumers sort between high- and
low-quality products based on their expertise levels. We illustrated this through a study of the
black cohosh market in which we measured consumer-unobservable product authenticity as well
as a range of consumer-observable product characteristics for a sample of brands. By applying
hedonic estimation separately to authentic and non-authentic product samples, we measured
expert and inept consumers’ distinct valuations of observable characteristics. We also measured
the relative conjectural errors made by inept consumers in using each observable characteristic as
a surrogate indicator.
One important finding from this last element of the analysis was that, while inept
consumers probably err on the side of being too tentative in their use of most surrogate
indicators, they appear to construe too much about authenticity from small differences in the
level and frequency of online product ratings. Online ratings and product commentary are widely
touted as a source of helpful information on product quality, and it is possible that their
products, to rely on them too heavily. These same individuals may suboptimally neglect other
sources of information, such as the wording on product labels.
Our finding is consistent with the literature. Banerjee (1992, 1993) shows that
decision-makers may rely excessively on others’ opinions and actions, often substituting inferences from
these for superior private information. Mayzlin (2006) proposes a model in which online
communications that appear to be from consumers might have other sources (e.g., firms). She
finds in this context that consumers nevertheless rely on anonymous online feedback, making it
profitable for firms to pose as consumers and create promotional product commentary.
Our study generally highlights the value of accounting for consumer-unobservable
characteristics in marketing research. While this study made use of unique data generated in a
biochemical laboratory, data on unobservable characteristics may be available to researchers in
many typical marketing contexts. As experts on their categories, product manufacturers often
have superior information on the quality of competing products relative to consumers.
Sophisticated quality measurement techniques, such as those used by Consumer Reports and
other independent testers, while infeasible for most consumers, may be feasible for researchers.
From a managerial perspective, research along the lines of the methods demonstrated
here may yield a number of useful applications. Performing hedonic analysis separately on
expert and non-expert consumers may allow managers to develop targeted pricing strategies that
account for differences in how these two groups value product characteristics as indicators of
unobservable qualities. Such findings may also allow for targeted product and promotion
strategies that emphasize product attributes of interest to each group. Observed differences in
the conjectural errors with respect to surrogate indicators that non-expert consumers make
Further work needs to be done. The present study was limited by its small sample size
and should therefore be considered exploratory. In particular, the coefficient estimates
associated with the two subsamples likely included a substantial amount of noise, and our
interpretations of the differences and the associated conjectural errors should be weighted
accordingly. Replication of our method in other contexts would be helpful in demonstrating its
uses. Product markets with important experience and/or credence good qualities pose good
candidates, particularly where important managerial or policy issues remain unresolved.
One example involving policy issues is the market for illegal drugs. Public policy has
focused on limiting supply through seizure, with mixed results. One consequence of
supply-chain pressure has been that sellers “cut” their product with baser substances before selling it.10 In regard to reductions in drug purity and their implications for drug policy evaluation, a number
of questions need to be answered. To what extent do observable characteristics provide evidence
of adulterated products? What observable characteristics are most influential in stimulating
recognition of adulteration? Assuming some buyers are less sophisticated than others, what sorts
of conjectural errors in drug purity evaluation do inept buyers make relative to expert buyers?
Do supply-chain pressure and consequent effects on drug purity have consequences for which
REFERENCES
Armstrong, M., Y. Chen, 2009. Inattentive consumers and product quality. Journal of the
European Economic Association7(2-3) 411-422.
Banerjee, A. V., 1992. A simple model of herd behavior. Quarterly Journal of Economics
107(3) 797-817.
Banerjee, A. V., 1993. The economics of rumours. Review of Economic Studies 60 309-327.
Baum, C. F., M. E. Schaffer, S. Stillman, 2003. Instrumental variables and GMM: Estimation
and testing. Stata Journal3(1) 1–31.
Brook, T. 1998. The Confusions of Pleasure: Commerce and Culture in Ming China. Berkeley,
University of California Press.
Brucks, M., V. A. Zeithaml, G. Naylor, 2000. Price and brand name as indicators of quality
dimensions for consumer durables. Journal of the Academy of Marketing Science28(3)
359-374.
Burton, S., D. R. Lichtenstein, 1989. The relationship between perceived and objective
price-quality. Journal of Marketing Research26(4) 429-443.
Burton, S., D. R. Lichtenstein, 1990. Assessing the relationship between perceived and objective
price-quality: A replication. Advances in Consumer Research 17(1) 715-722.
Darby, M. R., E. Karni. 1973. Free competition and the optimal amount of fraud. Journal of Law
and Economics16(1) 67-88.
Dulleck, U., R. Kerschbamer. 2006. On doctors, mechanics, and computer specialists: The
economics of credence goods. Journal of Economic Literature44(1) 5-42.
Erdem, T., M. P. Keane, B. Sun, 2008. A dynamic model of brand choice when price and
Gabaix, X., D. Laibson, 2006. Shrouded attributes, consumer myopia, and information
suppression in competitive markets. Quarterly Journal of Economics 121(2) 505-540.
Godes, D., D. Mayzlin, 2004. Using online conversations to study word-of-mouth
communication. Marketing Science 23(4) 545-560.
Heifitz, A., M. Meier, B. C. Schipper, 2006. Interactive unawareness. Journal of Economic
Theory130(1)78-94.
Jiang, B., F. Kronenberg, P. Nuntanakorn, M.-H. Qiu, E. J. Kennelly. 2006. Evaluation of the
botantical authenticity and phytochemical profile of black cohosh products by
high-performance liquid chromatography with selected ion monitoring liquid
chromatography-mass spectrometry. Journal of Agricultural and Food Chemistry54(9) 3242-53.
Jo, M.-S., 2005. Why country of origin effects vary in consumers’ quality evaluation: A
theoretical explanation and implications for country of origin management. Journal of
Global Marketing19(1) 5-25.
Johnson, A. R., V. S. Folkes, 2007. How consumers’ assessments of the difficulty of
manufacturing a product influence quality perceptions. Journal of the Academy of
Marketing Science35(3) 317-328.
Letizia, P., V. A. Greenfield, P. Reuter, 2009. The World Heroin Market: Can Supply Be Cut?
Oxford: Oxford University Press.
Li, J., 2009. Information structures with unawareness. Journal of Economic Theory144(3)
977-993.
Liu, Z., 2008. The dirty face problem with unawareness. The B.E. Journal of Theoretical
Mason, K., T. J. S. Burton, D. Roach, 2001. The accuracy of brand and attribute judgments: The
role of information relevancy, product experience, and attribute-relationship schemata.
Journal of the Academy of Marketing Science29(3) 307-317.
Mayzlin, D., 2006. Promotional chat on the Internet. Marketing Science 25(2) 155-163.
Nagler, M. G., 1993. Rather bait than switch: deceptive advertising with bounded consumer
rationality. Journal of Public Economics 51(3), 359-378.
Nagler, M. G., F. Kronenberg, E. J. Kennelly, B. Jiang. 2010. Pricing for a credence good: A
hedonic analysis. Working Paper, The City College of New York.
National Pharmacopoeia Committee. 2005. Chinese Pharmacopoeia 2005A. Beijing: Chemistry
Industry Press.
Quester, P. G., S. Dzever, S. Chetty. 2000. Country-of-origin effects on purchasing agents’
product perceptions: an international perspective. Journal of Business & Industrial
Marketing15(7) 479-490.
Rao, A. R., K. B. Monroe, 1989. The effect of price, brand name, and store name on buyers’
perceptions of product quality: An integrative review. Journal of Marketing Research
26(3) 351-357.
Salop, S., J. Stiglitz, 1977. Bargains and ripoffs: a model of monopolistically competitive price
dispersion. Review of Economic Studies44(3) 493-510.
Völckner, F., J. Hofmann, 2007. The price-perceived quality relationship: A meta-analytic
review and assessment of its determinants. Marketing Letters18(3) 181-196.
Wechsler, J. 2007. Ensuring quality for dietary supplements. Pharmaceutical Technology August
West, G. E., B. Larue, C. Gendron, S. L. Scott. 2002. Consumer confusion over the significance
FOOTNOTES
1 Unawareness may be described by subjective state spaces that may contain full factual information but lack
awareness information necessary for reasoning with respect to relevant uncertainties. Thus, the agent possesses facts, but they do not “ring a bell” in a way needed to make a relevant inference. Put another way, the possibility of the inference does not “occur” to the agent. For discussions, see Heifetz et al. (2006), Liu (2008), and Li (2009). 2 The archetype of this consumer is the typical guest on the popular public television show, Antiques Roadshow.
The guest brings an artifact, which has been in her attic for decades, to the show, whereupon an antiques expert pronounces it to be extremely valuable, to the highly visible surprise of the guest. If the guest were herself an expert appraiser, she would not act dumbfounded upon learning of the artifact’s true value. But neither is she completely unaware: some observable product characteristic has given her enough of an inkling that the artifact is valuable that she decided to bring it to the show for appraisal.
33 People obtain indications about product quality from a number of sources, including advertising content and
intensity, consumption experiences, and prices (e.g., Erdem et al., 2008); as well as word-of-mouth communication by other consumers, including online product reviews (Godes and Mayzlin 2004).
4 In fact, we expect that expertise in appraisal likely carries across all surrogate indicators, such that people who
make erroneous conjectures about one !z !X
k will likely make larger errors about others. This is consistent with the literature, which views those who make errors versus those who do not as having different traits (e.g.,
attentiveness, myopia, etc.). For the purposes of this paper, it is not necessary to introduce this complication into the modeling. However, the notion does provide motivation for thinking of expert and inept appraisers as constituting distinct market segments.
5 A distinct product consists of a specific brand with a certain number of units per package, a certain formulation
(e.g., tablet, liquid-filled capsule, etc.), and a distinct set of ingredients. 6
For a detailed description, see Jiang et al. (2006), pp. 3243-5.
7 Online retailers of dietary supplements, such as Amazon and drugstore.com, and dedicated review sites, such as
Buzzillions.com, invite consumers to write product reviews. Typically any visitor to the site can write one. The review process is structured to allow the consumer both to offer a written comment and a numeric rating, usually on a 5-point scale. The comment and rating are then posted to the website for other visitors to view.
8
Note that while approximately 66% of distinct products in our sample were determined to be authentic, authentic products accounted for roughly 73% of our observations. This is because authentic products were slightly oversampled across retailers relative to non-authentic products.
9 GMM estimation is not used here due to its poor small sample properties. See Baum et al. (2003). 10
µk < 1 µk > 1
!P !z, !z !X
k T
same sign Negative Positive
!P !z, !z !X k T
[image:33.612.87.529.77.190.2]Xk Xk
!P !X
k(I) -!P !Xk(E), z
same sign Large Overshoot
Fallacy, Undershoot, or Small Overshoot (“FUSO”)
!P !X
k(I) -!P !Xk(E), z
opposite sign
Fallacy, Undershoot, or
[image:34.612.87.529.78.181.2]PRICE 12.782 6.404 4.790 28.990
NYC 0.764 0.429 0.000 1.000
RETAILER BRAND 0.164 0.373 0.000 1.000
INGREDIENTS 1.018 0.135 1.000 2.000
VEGGIE 0.418 0.498 0.000 1.000
KOSHER 0.055 0.229 0.000 1.000
STANDARDIZED 0.745 0.440 0.000 1.000
SIDE EFFECTS 0.291 0.458 0.000 1.000
SAFE 0.182 0.389 0.000 1.000
RATED 0.400 0.494 0.000 1.000
TIME SUPPLY 47.267 39.550 2.250 240.000
CERTIFIED 0.091 0.290 0.000 1.000
GUARANTEED 0.345 0.480 0.000 1.000
CLAIMS 0.345 0.480 0.000 1.000
AUTHENTICITY 0.727 0.449 0.000 1.000
Subsample of online-rated products (N = 22)
[image:35.612.56.396.91.315.2]Pure hedonic (OLS)
Including
AUTHENTICITY (2SLS)
NYC -0.1706* -0.0891
(0.0096) (0.1121)
RETAILER BRAND -0.7438*** -0.6728***
(0.1660) (0.1619)
log of INGREDIENTS 0.4186 0.5991
(0.4522) (0.4374)
VEGGIE 0.2632** 0.2290**
(0.0998) (0.0951)
KOSHER -0.1222 -0.2264
(0.2474) (0.2409)
STANDARDIZED 0.2930*** 0.4176***
(0.1077) (0.1405)
SIDE EFFECTS 0.2235 0.2068
(0.1406) (0.1290)
SAFE 0.4288*** 0.4303***
(0.1497) (0.1366)
RATED -0.7378*** -0.7247***
(0.1491) (0.1364)
SUM OF RATINGS 0.0359*** 0.0298***
(0.0107) (0.0109)
TIME SUPPLY 0.0073*** 0.0073***
(0.0015) (0.0014)
AUTHENTICITY 0.2803
(0.2261)
Constant 2.0323*** 1.7008***
(0.1416) (0.2969)
N 55 55
R2 0.6918 0.6719
[image:36.612.56.295.90.455.2]NYC -0.2639** (0.1189)
RETAILER BRAND -0.6625***
(0.2222)
log of INGREDIENTS -1.3011**
(0.5383)
VEGGIE -0.0586
(0.1225)
KOSHER 0.6226**
(0.2955)
STANDARDIZED -0.6085***
(0.1440)
SIDE EFFECTS -0.2922
(0.1925)
SAFE 0.0316
(0.1694)
RATED 0.1294
(0.1734)
SUM OF RATINGS 0.0265**
(0.0124)
TIME SUPPLY -0.0005
(0.0018)
CERTIFIED -0.3733*
(0.2175)
GUARANTEED -0.5175***
(0.1607)
CLAIMS -0.3639**
(0.1648)
Constant 1.7898***
(0.2286)
N 55
R2 0.6051
[image:37.612.56.253.93.466.2](1) (2) Authentic Subsample (OLS) Non-authentic Subsample (OLS) Relative Bias of Inept Consumers Relative Conjectural Error
NYC -0.0994 Omitted (0.0915)
RETAILER BRAND -1.1878*** -0.8215** 0.3663 FUSO (0.2849) (0.3327)
log of INGREDIENTS Omitted 0.7597 (0.6150)
VEGGIE 0.3811*** 0.6035* 0.2224 FUSO (0.1308) (0.3048)
KOSHER -0.1078 Omitted (0.2218)
STANDARDIZED 0.2339* Omitted (0.1249)
SIDE EFFECTS 0.0260 1.7940* 1.768 FUSO (0.1585) (0.8963)
SAFE 0.7468*** 0.2520 -0.4948 FUSO (0.2262) (0.4003)
RATED -1.1484*** -2.5348* -1.3864 FUSO (0.1912) (1.1952)
SUM OF RATINGS 0.0502*** 0.8325* 0.7823 large overshoot (0.0110) (0.4288)
TIME SUPPLY 0.0134*** 0.0089** -0.0045 FUSO (0.0032) (0.0025)
Constant 1.8882*** 1.8690*** (0.1564) (0.2242)
N 40 15
R2 0.7869 0.7802
[image:38.612.56.380.103.448.2]