How to cite this paper:Sarparandeh, M. and Hezarkhani, A. (2016) Application of Self-Organizing Map for Exploration of REEs’ Deposition. Open Journal of Geology, 6, 571-582. http://dx.doi.org/10.4236/ojg.2016.67045
Mohammadali Sarparandeh, Ardeshir Hezarkhani*
Department of Mining and Metallurgical Engineering, Amirkabir University of Technology (Tehran Polytechnic), Tehran, Iran
Received 8 June 2016; accepted 23 July 2016; published 26 July 2016
Copyright © 2016 by authors and Scientific Research Publishing Inc.
This work is licensed under the Creative Commons Attribution International License (CC BY). http://creativecommons.org/licenses/by/4.0/
Abstract
Varieties of approaches and algorithms have been presented to identify the distribution of ele-ments. Previous researches based on the type of problem, categorized their data in proper clus-ters or classes. This means that the process of solution could be supervised or unsupervised. In cases, where there is no idea about dependency of samples to specific groups, clustering methods (unsupervised) are applied. About geochemistry data, since various elements are involved, in ad-dition to the complex nature of geochemical data, clustering algorithms would be useful for recog-nition of elements distribution. In this paper, Self-Organizing Map (SOM) algorithm, as an unsu-pervised method, is applied for clustering samples based on REEs contents. For this reason the Choghart Fe-REE deposit (Bafq district, central Iran), was selected as study area and dataset was a collection of 112 lithology samples that were assayed with laboratory tests such as ICP-MS and XRF analysis. In this study, input vectors include 19 features which are coordinates x, y, z and concentrations of REEs as well as the concentration of Phosphate (P2O5) since the apatite is the
main source of REEs in this particular research. Four clusters were determined as an optimal number of clusters using silhouette criterion as well as k-means clustering method and SOM. Therefore, using self-organizing map, study area was subdivided in four zones. These four zones can be described as phosphate type, albitofyre type, metasomatic and phosphorus iron ore, and Iron Ore type. Phosphate type is the most prone to rare earth elements. Eventually, results were validated with laboratory analysis.
Keywords
Self Organizing Map (SOM), REEs, Geochemistry, Choghart, Central Iran
1. Introduction
Since 1970s, pattern recognition methods have been employed to detect hidden information of economic geolo-gy. Applications of clustering algorithms are among the most successful experiences in geochemical exploration. Characterization of the spatial distribution of elements of ore deposits has a guiding role for geological explora-tion [1]. A combinaexplora-tion of mathematical and geological knowledge can be utilized to identify and predict poten-tial exploration targets [2]. Numerous investigations have been conducted in recent years to identify distribution of elements and put the data samples in appropriate clusters. The selection of appropriate method depends on the complexity of the problems. One of these methods is based on artificial neural network. Most of the researches show that an ANN can be applied successfully to engineering problems without any restriction. It has also been seen that the capability (i.e. pattern recognition and memorization) of an ANN is suitable for inherent uncertain-ties and imperfections found in geochemical problems [3]. An important application of neural network is clus-tering. Clustering is an unsupervised method of data grouping using a given measure of similarity. Clustering approach attempts to organize unlabeled feature vectors into clusters (natural groups) such that samples within a cluster are similar to each other but differ from those in other clusters [4]. Clustering analysis is an important and useful tool for analyzing large datasets that contain many variables and experimental parameters. Therefore, the application of cluster analysis to complex datasets has attracted a high level of scientific interest in various aspects of geochemistry researches [5]. In order to investigate the distribution of elements, it is essential for a robust classification scheme to cluster chemistry samples into homogeneous groups [6]. Several common clus-tering techniques have been utilized to divide geochemical samples into similar homogeneous groups with the ultimate objective of characterizing the quality of elements such as principal component analysis, fuzzy k-means clustering technique and Q-mode hierarchical cluster analysis to assess the chemistry of groundwater and iden-tify the geological factors. For example, Ji et al. (2007) developed semi-hierarchical correspondence cluster analysis and showed its application for division of geological units with the help of geochemical data that are systematically collected from an area around Tahe in Heilongjiang Province, north China [7]. Meshkani et al. (2011) used hierarchical and k-means clustering for identifying the distribution of lead and zinc in Sanan-daj-Sirjanmetalogenic zone in Iran [8]. Ziaii et al. (2009) introduced the neuro-fuzzy method for separating anomalies and showed that this method is more efficient than using multivariate statistics [9]. These methods are efficient at geochemical samples by chemical similarities, but are not useful for the visual assessment of the re-sults and presentation of maps showing geochemical facies [6]. The recently proposed method of the self-orga- nizing maps (SOM) is likely to become a complementary or alternative tool to the clustering methods [10] [11].
The SOM is related to adaptive k-means, but performs a topological feature map that is more complex than just cluster analysis. After training, the input vectors are spatially ordered in the array, i.e. the neighboring input vectors in the map are more similar than the more remote ones [12]. The self-organizing maps approach is based on the unsupervised learning algorithm, and has excellent visualization capabilities, including techniques that apply the reference vectors of the SOM to give an informative picture of the data [13]. Sun et al. (2009) applied SOM method to classify Pb-Zn-Mo-Ag anomalies in the mining area around Sheduolong in Qinghai Province, China [14]. In 2012, Abedi et al. used SOM method and fuzzy k-means (FCM) to provide deposit exploration map for Now Chun copper deposit in Iran. They used vectors with 13 features of three layers including geologi-cal, geophysical and geochemical information as input data [15]. The topology preservation property makes the SOM a popular choice in data analysis. The most important advantages of SOM such as visualization capability and the output map, lead the authors to use this method for having a better conclusion about REEs’ distribution in the study area. The objective of this paper is to show that the self-organizing map is an applicable and suitable approach for zoning of the deposit based on rare earth elements.
2. Geological Settings of Study Area
There are significant concentrations of iron ore in central and north east of Iran. Magnetite is the main mineral in most of important Iron ore bodies. Obtrusive elements are often phosphorus and sulfur in the form of apatite, pyrite and seldom chalcopyrite. Iron deposits of Iran can be divided into two main groups, magmatogene and volcano sediments. Metasomatism is the main reason of concentrating in Iron ore deposits of central Iran [16].
Figure 1. Geological map of Bafq mineral province [29].
metasomatism, were both involved to different degrees in the formation of Choghart and other similar deposits in central Iran [17].
metasomatic aureole differs widely. The orebody is hosted by volcanic members (intrusive and extrusive alkali rhyolites) of the epicontinental to continental Infracambrian Esfordi Formation [17]. The orebody and the me-tamorphosed country rock are cut by several diabasic dikes. The plain that surrounds the orebody and its meta-morphosed intrusive and volcanic country rocks are composed of 150 m of Quaternary formations and recent alluvium, of fine grained sand and gravel, magnetite boulders, gypsum and intrusive fragments. Hematite is the second ubiquitous mineral after magnetite. Although some primary hematite is also found in the drill cores, most of hematite is secondary in origin. Some goethite and hydrous iron oxide occur on the surface, but disappear ra-pidly with increasing depth. Calcite, dolomite, secondary hematite and talc occur throughout the orebody as veinlets and cementing material of oxidized ore. Rutile and goethite are probably the results of total transforma-tion of the earlier formed martite [18].
In the Early Cambrian there are intrusions of granitic plutons into the Precambrian sequence and formation of felsic to intermediate volcanic and volcano-sedimentary rocks. This sequence is composed of an unmetamor-phosed series which includes interlayered micro-conglomerates, sandstones, black siltstones and shales, dolo-mites and dolomitic limestones, mafic to felsic volcanic rocks, volcanoclastic beds and tuffaceous shales [19]- [21]. Simplified geological map of Choghart pit, based on different rock types as well as the location of samples within the study area are shown in Figure 2.
Choghart main minerals include magnetite, hematite (Martite), actinolite, tremolite and sometimes pyrite and albite. Apatite-bearing magnetite is formed often in margins of deposit [22]. Figure 3 illustrates some examples of optical microscopy investigations for three samples from three different rock types consisting host rock, Iron ore body and metasomatite.
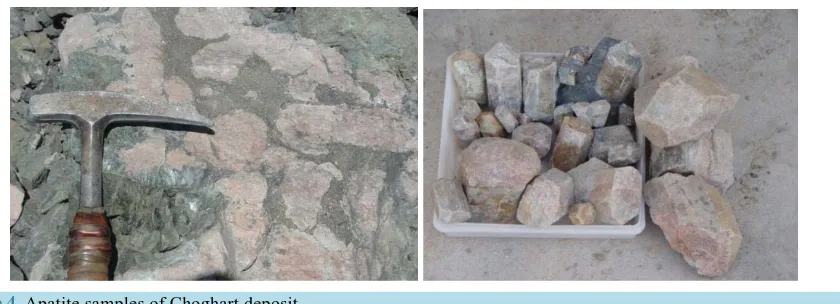
The Early Cambrian igneous rocks of the Bafqmining district have a bimodal nature. The chondrite-norma- lized REE patterns display significant variation from LREE to HREE with no considerable Eu anomalies for basaltic rocks. And show obvious enrichment in the LREE with important negative Eu anomalies for the rhyo-litic domes [23]. The REEs enrichment is intensely associated with the formation of phosphate minerals in many IOA deposits. However, sometimes bastnaesite and allanite are significant [24]. In this study, apatite is the main REE bearing mineral in Choghart Iron ore deposit. Figure 4 shows some examples of apatite which have been observed in this deposit.
[image:4.595.62.524.452.692.2]Edfelt (2007) explained there are few complications in the phosphate-REE relationship in some Kiruna dis-trict [25]. Hence, the relationship between REE and phosphate minerals in such deposits should be more
Figure 2. Simplified geological map of Choghart pit and sample locations (red frame shows study area) (simplified and modified
Figure 3. Microscopic images: (a) Host rock sample, consisting of plagioclase and calcite with fine grain background texture of quartz and sericite, porphyry texture, thin section, XPL; (b) Iron ore sample, magnetite, apatite with some martitized magnetite, polished section; (c) Metasomatite sample, microgranoular texture, pyroxene (red), apatite (gray),
magnetite and hematite, thin section, XPL.
Figure 4. Apatite samples of Choghart deposit.
understood. In these deposits, appetites characteristically comprise 2000 - 6000 ppm REE [26] [27]. Daliran (2002) claimed Bafq district apatites contain up to 1.75 wt.% REE [28]. Some researches present that post-de- positional REE leaching could be happened in apatite in which the inclusions of monazite and xenotime might be seen [29]-[31]. The U-Pb dating of monazite inclusions in apatite demonstrates that the REE redistribution in apatite might be happened frequently throughout hydrothermal process several million years after the formation of the IOA deposits [30].
3. Data Set
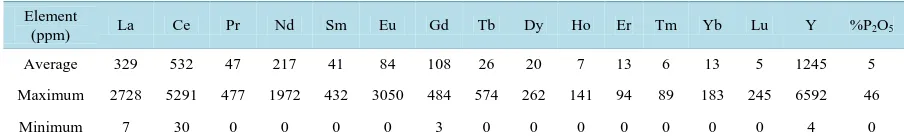
The data set is a collection of 112 lithology samples that were assayed with laboratory tests. 19 features includ-ing coordinates x, y, z and concentrations of Phosphate (P2O5) and REEs (Table 1), were selected as input data set. The concentrations of REEs were analyzed in laboratory using inductively coupled plasma mass spectrome-try (ICP-MS) due to its sensitivity for trace elements. Phosphate (P2O5) contents were measured by X-ray fluo-rescence (XRF) spectrometer. Phosphate is in percent and other elements are in ppm. It should be noted that these values have been normalize in order to use them in clustering methods.
According to the results of the ICP-MS analysis, cerium, lanthanum, neodymium and yttrium have the maxi-mum amounts among all the rare earth elements in Choghart. These elements are in relationship with apatite. Therefore, the distribution of phosphorus in this region is associated with the distribution of rare earth elements. Since the apatite is the main source of these elements in study area, Phosphate was chosen as an input variable.
The geological settings in addition to information of field studies and microscopic investigations that men-tioned in Section 2, were applied for validity assessment of SOM output map.
4. Methodology
[image:5.595.111.531.269.421.2]Table 1. Rare earth elements and phosphate which have been used as well as average and minimum and maximum of each
element. Phosphate (P2O5) is in percent and other elements are in ppm.
Element
(ppm) La Ce Pr Nd Sm Eu Gd Tb Dy Ho Er Tm Yb Lu Y %P2O5
Average 329 532 47 217 41 84 108 26 20 7 13 6 13 5 1245 5
Maximum 2728 5291 477 1972 432 3050 484 574 262 141 94 89 183 245 6592 46
Minimum 7 30 0 0 0 0 3 0 0 0 0 0 0 0 4 0
unsupervised method. This method was first developed by Kohonen in 1980 and its typical application is to produce a two-dimensional map from a multidimensional space [32]. This method uses a network to estimate the probability density function of the input space, in a way that maintains the topological structure of the input space. If two vectors in the input space are close together, they would be considered under a same condition. The net of neurons is a right-angle grid and the neighbors repeatedly upgrade. Figure 5 shows physical scheme of self-organizing map.
In this method, first, random amounts of weight, wkj, are considered for the neurons. So:
(
1, 2, ,)
kj kj kj KJI
w = w w w (1)
where K is the number of rows and J is the column. Then a random vector of input data is selected. The next step is calculation of distances between this vector and neurons and finding the closest as wining neuron (Equa-tion (2)). Then, winning neurons and neighboring neurons converge to the input vector. For this purpose, the neighborhood function is defined according to Equation (3) [33].
{
2}
2 min 2
mn p kj p
kj
∀
− = −
w z w z (2)
( )
(
2)
, 2,
mn kj mn kj
h t =h c −c t (3)
Rectangular or hexagonal neighborhood can be defined. However, the Gaussian kernel is commonly used as follows [33]:
( )
( )
( ) 2 2 2 2 , e mn kj c c t mn kjh t η t σ
− −
= (4)
where η(t) is the learning rate factor and σ(t) is the width of the kernel. Both η(t) and σ(t) are monotonically de-creasing functions. To determine the accuracy of the map, error is calculated as Equation (4) and iteration stops when this error is small enough.
( )
22 1
p
T p mn
p
t ε
=
=
∑
z −w (5)To determine the cluster boundaries, unified distance matrix (U-matrix), might be calculated. The U-matrix expresses the distance to the neighboring vectors for each neuron. Large values within the U-matrix indicate the position of cluster boundaries [33].
5. Results and Discussion
Figure 5. Physical structure of self-organizing map [33].
Figure 6. Silhouette plot and overall average silhouette width: k-means clustering (left) and self-organizing map (right).
an expression of confidence. However, for 12 samples the silhouette values are negative and illustrate that they have been incorrectly clustered. Since, the logic of both k-means and SOM method is the same, they put the samples in the same clusters. Accordingly, silhouette results of both methods are similar.
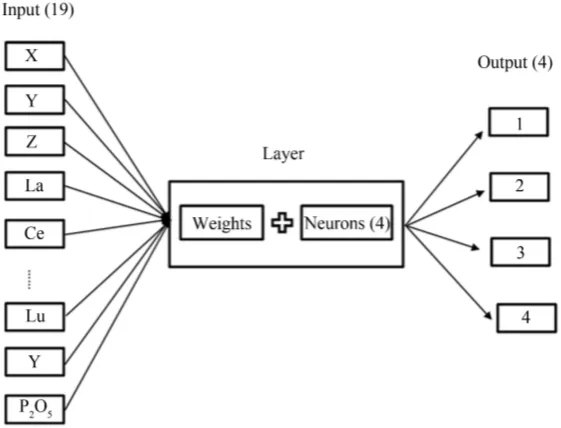
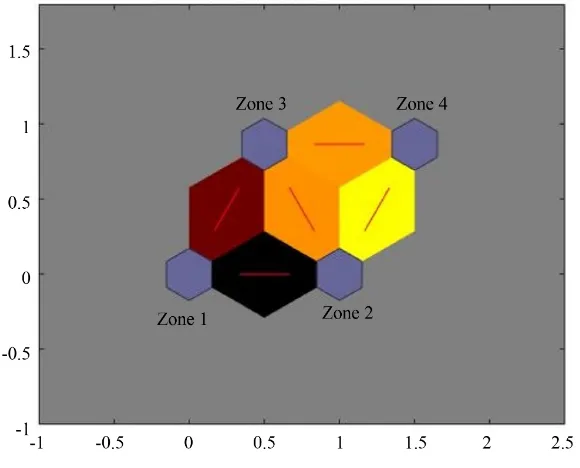
The goal of SOM is to represent all input vectors in a high-dimensional space by prototypes in a low-dimen- sional space, such that the distance and topology are preserved as much as possible [36]. Therefore, in this study, the high-dimensional dataset (19 dimensions that are 19 features including coordinates x, y, z and concentrations of Phosphate (P2O5) and REEs) has been evaluated in a two-dimensional space. Schematic diagram of the struc-ture of self-organizing map in this study is shown in Figure 7. Using self-organizing map, the samples of stu-died area can be assigned to four clusters, as shown in Figure 8. In this way, 13, 32, 38 and 29 samples respec-tively were clustered in zones 1 to 4. Each hexagon represents a neuron. In this study, a 2 × 2 network has been used which is composed of four neurons.
Figure 7. Schematic diagram of the structure of self-organizing map in this study.
[image:8.595.87.537.594.688.2]Figure 8. Determining the number of samples for each cluster.
Table 2.Average concentrations of rare earth elements for samples in different zones which separated using self-organizing
map algorithm. REE (ppm)
Zone
La Ce Pr Nd Sm Eu Gd Tb Dy Ho Er Tm Yb Lu Y P2O5
(%)
1 1658 2632 194 1077 149 616 193 7 68 6 9 21 22 1 3132 31
2 40 129 15 47 25 18 118 8 12 3 8 5 8 12 1367 0.2
3 305 360 45 166 27 11 76 56 13 4 11 4 10 2 767 3
4 84 260 20 84 30 15 99 15 15 14 25 5 18 3 891 1
• Zone 1: phosphate type
av-• Zone 4: iron ore type
This zone consists of Iron ore. The concentrations of phosphate and REEs are 1% and 105 ppm, respectively. Since Self-organizing map has a 2-dimensional topology, the relations between centers of 19-dimensional clusters have been illustrated in a 2-dimensional map. Weight distance matrix or unified distance matrix (U-matrix) is one of the tools of SOM. Figure 9 shows neighbor weight distances. Lines are used to display the relationship between neighbor neurons. The darker the color, the further the distance between the neurons, as well as the lighter the color, the lesser the distance between the neurons. Therefore, the distance between zone 1 and zone 2 is maximum. They are the most prone and least prone zones for rare earth elements, respectively. The minimum distance is related to Zone 2 and 4. They both have the least contents of REEs. Finally, zone 1 (phosphate type) is the most promising zone for rare earth elements.
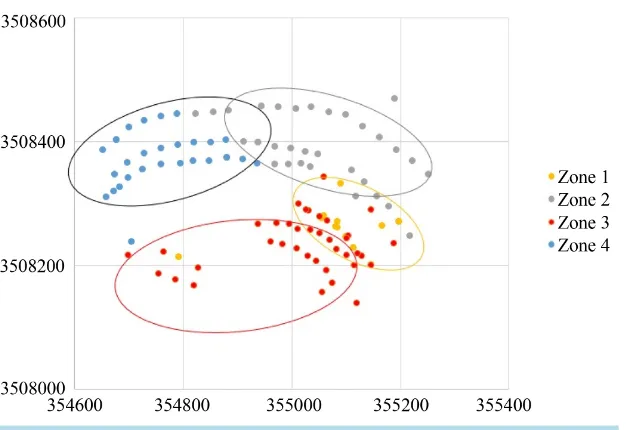
Figure 10 shows the location of samples. For better visual separation, samples of each zone have been shown with distinct colors. Thus, a distinction between zones (or clusters) could be seen based on the coordinates.
6. Conclusion
[image:9.595.168.458.475.709.2]Usual ways of clustering which have been used in geochemical explorations, according to literature reviews, were around K-means algorithm. However, in this way and other popular methods such as MLP neural network, topology of samples is not to be considered. Self-organizing map or briefly SOM is a type of artificial neural network (ANN), which is applied for clustering and its advantages, is to involve topological settings of dataset and gives a two-dimensional map from a multidimensional input dataset. This method has been used already in some fields of Earth Sciences such as geophysics and seismology. In this study, known SOM was applied to find REEs’ distribution in Choghart Iron ore deposit. Accordingly, after finding optimal number of clusters using silhouette criterion, a two-dimensional map was composed. Finally, studied area was subdivided in four zones
Figure 10.The result of SOM. The studied area has been divided to 4 zones.
which have a good agreement with rock types. Field studies and laboratory analysis confirm that there are four different rock types. Given that just REEs and phosphate (not all elements) have been used for clustering, it can be concluded that this algorithm has worked well. In addition, this study shows that the preservation of topology is one of the advantages of this method for geochemical exploration. The comparison between the results and laboratory analysis as well as checking with field observations, confirm authenticity of this study.
References
[1] Hao, Y. and Wang, G. (2012) Application of Fractal Models to Characterization of Vertical Distribution of Mo Depo-sits in Henan Province. 8th International Conference on Natural Computation, Chongqing, 29-31 May 2012, 927-931.
http://dx.doi.org/10.1109/icnc.2012.6234773
[2] Nazarpour, A., Sadeghi, B. and Sadeghi, M. (2014) Application of Fractal Models to Characterization and Evaluation of Vertical Distribution of Geochemical Data in Zarshuran Gold Deposit, NW Iran. Journal of Geochemical Explora-tion, 148, 60-70. http://dx.doi.org/10.1016/j.gexplo.2014.08.007
[3] Pourtaghi, A. and Lotfollahi-Yaghin, M.A. (2012) Wavenet Ability Assessment in Comparison to ANN for Predicting the Maximum Surface Settlement Caused by Tunneling. Tunnelling and Underground Space Technology, 28, 257-271.
http://dx.doi.org/10.1016/j.tust.2011.11.008
[4] Hilario, L.G. and Ivan, M.G. (2004) Self-Organizing Map and Clustering for Wastewater Treatment Monitoring. En-gineering Applications of Artificial Intelligence, 17, 215-225. http://dx.doi.org/10.1016/j.engappai.2004.03.004
[5] Nguyen T.T., Kawamura, A., Tong T.N., et al. (2015) Clustering Spatio-Seasonal Hydrogeochemical Data Using Self- Organizing Maps for Groundwater Quality Assessment in the Red River Delta, Vietnam. Journal of Hydrology, 522, 661-673. http://dx.doi.org/10.1016/j.jhydrol.2015.01.023
[6] Guler, C., Thyne, G.D., McCray, J.E. and Turner, K.A. (2002) Evaluation of Graphical and Multivariate Statistical Methods for Classification of Water Chemistry Data. Hydrogeology Journal, 10, 455-474.
http://dx.doi.org/10.1007/s10040-002-0196-6
[7] Meshkani, S.A., Mehrabi, B., Yaghubpur, A., et al. (2011) The Application of Geochemical Pattern Recognition to Regional Prospecting: A Case Study of the Sanandaj-Sirjan Metallogenic Zone. Iran Journal of Geochemical Explora-tion, 108, 183-195. http://dx.doi.org/10.1016/j.gexplo.2011.01.006
[8] Ji, H., Zeng, D., Shi, Y., et al. (2007) Semi-Hierarchical Correspondence Cluster Analysis and Regional Geochemical Pattern Recognition. Journal of Geochemical Exploration, 93, 109-119. http://dx.doi.org/10.1016/j.gexplo.2006.10.002
[9] Ziaii, M., Pouyan, A.A. and Ziaii, M. (2009) Neuro-Fuzzy Modelling in Mining Geochemistry: Identification of Geo-chemical Anomalies. Journal of Geochemical Exploration, 100, 25-36. http://dx.doi.org/10.1016/j.gexplo.2008.03.004
[10] Kalteh, A.M., Hjorth, P. and Berndtsson, R. (2008) Review of the Self-Organizing Map (SOM) Approach in Water Resources: Analysis, Modeling and Application. Environmental Modelling and Software, 23, 835-845.
[15] Abedi, M., Norouzi, G.H. and Torabi, S.A. (2012) Clustering of Mineral Prospectivity Area as an Unsupervised Clas-sification Approach to Explore Copper Deposit. Saudi Society for Geosciences, 10, 3601-3613.
[16] National Iranian Steel Corporation (1975) Report on Detailed Exploration of Se-Chahun Iron Ore Deposit in Central Iran. National Iranian Steel Corporation (NISCO), Tehran.
[17] Moore, F. and Modabberi, S. (2003) Origin of Choghart Iron Oxide Deposit, Bafq Mining District, Central Iran: New Isotopic and Geochemical Evidence. Journal of Sciences, 14, 259-269.
[18] Daya, A.A. (2012) Reserve Estimation of Central Part of Choghart North Anomaly Iron Ore Deposit through Ordinary Kriging Method. International Journal of Mining Science and Technology, 22, 573-577.
http://dx.doi.org/10.1016/j.ijmst.2012.01.022
[19] Foerster, H. and Jafarzadeh, A. (1994) The Bafq Mining District in Central Iran, a Highly Mineralized Infracambrian Volcanic Field. Economic Geology, 89, 1697-1721. http://dx.doi.org/10.2113/gsecongeo.89.8.1697
[20] Ramezani, J. and Tucker, R.D. (2003) TheSaghand Region, Central Iran: U-Pb Geochronology, Petrogenesis and Im-plications for Gondwana Tectonics. American Journal of Science, 303, 622-665.
http://dx.doi.org/10.2475/ajs.303.7.622
[21] Samani, B.A. (1988) Metallogeny of the Precambrian in Iran. Precambrian Research, 39, 85-106.
http://dx.doi.org/10.1016/0301-9268(88)90053-8
[22] Shekarian, Y. (2014) Geochemical Investigations on REEs in N-NE Choghart Iron Deposit and Their Economic Eval-uations. Dissertation, Amirkabir University of Technology (Tehran Polytechnic), Tehran, 59-72.
[23] Rajabi, A., Canet, C., Rastad, E. andAlfonso, P. (2015) Basin Evolution and Stratigraphic Correlation of Sedimenta-ry-Exhalative Zn-Pb Deposits of the Early Cambrian Zarigan-Chahmir Basin, Central Iran. Ore Geology Reviews, 64, 328-353. http://dx.doi.org/10.1016/j.oregeorev.2014.07.013
[24] Oreskes, N. and Einaudi, M.T. (1990) Origin of Rare Earth Element-Enriched Hematite Breccias at the Olympic Dam Cu-U-Au-Ag Deposit, Roxby Downs, South Australia. Economic Geology, 85, 1-28.
http://dx.doi.org/10.2113/gsecongeo.85.1.1
[25] Edfelt, A. (2007) The Tjarrojakka Apatite-Iron and Cu (-Au) Deposits, Northern Sweden: Products of One Ore Form-ing Event. Dissertation, Lulea University of Technology, Lulea.
[26] Frietsch, R. (1982) On the Chemical Composition of the Ore Breccia at Luossavaara, Northern Sweden. Mineralium-Deposita, 17, 239-243. http://dx.doi.org/10.1007/BF00206473
[27] Frietsch, R. and Perdahl, J.A. (1995) Rare Earth Elements in Apatite and Magnetite in Kiruna-Type Iron Ores and Some Other Iron Ore Types. Ore Geology Reviews, 9, 489-510. http://dx.doi.org/10.1016/0169-1368(94)00015-G
[28] Daliran, F. (2002) Kiruna-Type Iron Oxide-Apatite Ores and Apatites of the Bafq District, Iran, with an Emphasis on the REE Geochemistry of Their Apatites. Hydrothermal Iron Oxide Copper-Gold & Related Deposits: A Global Pers-pective, 2, 303-320.
[29] Bonyadi, Z., Davidson, G.J., Mehrabi, B., Meffre, S. and Ghazban, F. (2011) Significance of Apatite REE Depletion and Monazite Inclusions in the Brecciated Se-Chahun Iron Oxide Apatite Deposit, Bafq District, Iran: Insights from Paragenesis and Geochemistry. Chemical Geology, 281, 253-269. http://dx.doi.org/10.1016/j.chemgeo.2010.12.013
[30] Stosch, H.G., Romer, R.L., Daliran, F. andRhede, D. (2011) Uranium-Lead Ages of Apatite from Iron Oxide Ores of the Bafq District, East-Central Iran. Mineralium Deposita, 46, 9-21. http://dx.doi.org/10.1007/s00126-010-0309-4
[31] Torab, F. and Lehmann, B. (2007) Magnetite-Apatite Deposits of the Bafq District, Central Iran: Apatite Geochemistry and Monazite Geochronology. Mineralogical Magazine, 71, 347-363.
http://dx.doi.org/10.1180/minmag.2007.071.3.347
[32] Kohonen, T. (1998) The Self-Organizing Map. Neurocomputing, 21, 1-6.
http://dx.doi.org/10.1016/S0925-2312(98)00030-7
[33] Engelbrecht, A.P. (2002) Computational Intelligence. Wiley, Chichester, 63-73.
of Computational and Applied Mathematics, 20, 53-65. http://dx.doi.org/10.1016/0377-0427(87)90125-7
[35] Lleti, R., Ortiz, M.C., Sarabia, L.A. andSánchez, M.S. (2004) Selecting Variables for k-Means Cluster Analysis by Using a Genetic Algorithm That Optimizes the Silhouettes. Analytica Chimica Acta, 515, 87-100.
http://dx.doi.org/10.1016/j.aca.2003.12.020
[36] Yang, L., Ouyang, Z. and Shi, Y. (2012) A Modified Clustering Method Based on Self-Organizing Maps and Its Ap-plications. Procedia Computer Science, 9, 1371-1379. http://dx.doi.org/10.1016/j.procs.2012.04.151
[37] Dehghan, A. (2011) Geological and Structural Map of Choghart Mine. Iran Central Iron Ore Co. (ICIOC).
Submit or recommend next manuscript to SCIRP and we will provide best service for you:
Accepting pre-submission inquiries through Email, Facebook, LinkedIn, Twitter, etc. A wide selection of journals (inclusive of 9 subjects, more than 200 journals) Providing 24-hour high-quality service
User-friendly online submission system Fair and swift peer-review system
Efficient typesetting and proofreading procedure
Display of the result of downloads and visits, as well as the number of cited articles Maximum dissemination of your research work
![Figure 1. Geological map of Bafq mineral province [29].](https://thumb-us.123doks.com/thumbv2/123dok_us/7891256.742134/3.595.65.538.78.629/figure-geological-map-bafq-mineral-province.webp)
![Figure 2. Simplified geological map of Choghart pit and sample locations (red frame shows study area) (simplified and modified after Dehghan (2011), [37])](https://thumb-us.123doks.com/thumbv2/123dok_us/7891256.742134/4.595.62.524.452.692/figure-simplified-geological-choghart-locations-simplified-modified-dehghan.webp)
![Figure 5. Physical structure of self-organizing map [33].](https://thumb-us.123doks.com/thumbv2/123dok_us/7891256.742134/7.595.94.540.79.521/figure-physical-structure-self-organizing-map.webp)