http://dx.doi.org/10.4236/ajps.2016.77102
How to cite this paper: Elos, M.M., Pérez, G.R., Ortíz, F.C., Acevedo, L.P.G., Enríquez, E.A., Zacarías, M.D.C.O., Figuereo, I.P., Herrera, S.A.R., Lucio, J.A.R. and Reyes, J.G.R. (2016) Chlorophyll Concentration and Morphological Diversity in Corn Lines at Different Vegetative Stages. American Journal of Plant Sciences, 7, 1067-1076. http://dx.doi.org/10.4236/ajps.2016.77102
Chlorophyll Concentration and
Morphological Diversity in Corn
Lines at Different Vegetative Stages
Mariano Mendoza Elos1, Gilberto Rodríguez Pérez1*,Francisco Cervantes Ortíz1, Luis Patricio Guevara Acevedo1,
Enrique Andrio Enríquez1, Ma. Del Carmen Ojeda Zacarías2,
Isabel Presa Figuereo1, Sergio Alfredo Rodríguez Herrera3,
José Antonio Rangel Lucio1, José Guadalupe Rivera Reyes1
1Division of Graduate Studies and Research, Institute Technologic of Roque, Guanajuato, México 2University Autonomous Agrarian of Nuevo León, Monterrey, México
3University Autonomous Agrarian Antonio Narro, Saltillo, México
Received 6 February 2016; accepted 15 May 2016; published 18 May 2016
Copyright © 2016 by authors and Scientific Research Publishing Inc.
This work is licensed under the Creative Commons Attribution International License (CC BY).
http://creativecommons.org/licenses/by/4.0/
Abstract
The objective of this study was to assess the chlorophyll content of corn lines at different vegeta-tive stages and the diversity between them. The study was conducted in the experimental field of the Roque Institute of Technology (ITR) located in Roque, Celaya, Guanajuato, Mexico. We used 32 corn lines from CIMMYT and four lines from the breeding program of the ITR. The evaluation was conducted in the spring-summer cycle of 2014 at two planting dates. We used a completely ran-domized block design with three replications. The experimental unit consisted of two rows of five linear meters with a distance of 0.75 meters between rows. Chlorophyll was measured at six dif-ferent stages: V6, VT, R3, R4, R5 and MF. The agronomic variables recorded were: PH, CH, LAC, LBC, FF, MF, PM, CC, CL, DC, RC, KR and GY. The results of the analysis of variance showed significant differences between lines, dates and their interaction. On average, 18 lines were found with chlo-rophyll concentrations above 51 SPAD units in the two environments. This indicated that these materials had a high potential for field performance. Using cluster analysis UPGMA method, we identified seven groups for chlorophyll and eight groups for agronomic characteristics for a breeding program. The groups were associated to the homogeneous characteristics of each va-riable.
Keywords
Chlorophyll Content, Phenological Stages, Clusters and Corn Lines
1. Introduction
Maize (Zea mays L.) is one of the most important cereal crops world-wide as well as an important source of feed, fibre, and biofuel. Potassium (K) as one of the essential nutrients for crop plays an important role in crop growth and development, metabolism and yield formation process [1][2]. Because of long-term agricultural production of existing cultivated land, there is about 60% of massive arable land potassium deficiency, which inhibit crop yield and quality improvement [3][4]. The leaf senescence shortens the duration of the photosynthesis after heading, and reduces the photosynthetic production accumulation [5][6]. Potassium deficiency in plants usually induces brown scorching and curling of leaf tips as well as chlorosis (yellowing) between leaf veins, which ac-celerate leaf senescence. Leaf photosynthesis consists of the several physiological processes, including light harvesting, photosystem II (PSII) photochemistry and CO2 assimilation [7]. Chlorophyll fluorescence measure-ments have increasingly been used as a non-invasive tool in leaf ecophysiological studies. This method has been used extensively to investigate the response of plants to environmental stress, including the effects of low potas-sium on the photosynthetic apparatus of crops both in a controlled environment and in the field [8][9].
It has been known for years that corn requires large quantities of nitrogen (N), and that the fraction of nitro-gen recovered is low, typically less than 50% [10]. In Chile, the most recent estimates of the efficiency of nitro-gen use in corn range from 27% to 38% [11]. Moreover, the increasing need to reduce costs, improve efficiency in the use of nitrogen fertilizers and prevent nitrate pollution, requires the use of new tools for measuring the nu-tritional status of crops, especially if this can be done by non-destructive methods. The ideal solution will be to keep track of leaf nitrogen levels during the period of crop development, making it possible to correct deficien-cies and improve crop yields.
One way to determine foliar nitrogen quickly is by using a Minolta® Chlorophyll Meter SPAD 502 (Soil Plant Análisis Development) to measure the greenness index, which is directly related to the content of chloro-phyll in the leaves of the plants. This portable equipment allows an indirect and non-destructive assessment of leaf chlorophyll content by measuring the light transmitted through the leaf at 650 nm and 940 nm. Its use has been successful in terms of assessing the nutritional status of nitrogen in several crops [12][13]. Plants are so effective at producing energy that they can produce enough energy to grow and reproduce [14]. The author also points out that not all plants produce the same amount of energy, since it depends, on the one hand, on environ-mental conditions such as light, temperature, humidity, atmospheric gases, etc. and, on the other, on the type of plants. Corn has a high yield potential associated with efficient photosynthetic mechanisms; its maximum rate is 50 to 60 mg of CO2 dm−2∙h−1, with an optimal temperature between 35˚C and 40˚C [15]. The growth and yield of
plants are closely related to environmental factors and crop management. The quantity, quality and duration of light and temperature, as well as the date and density of planting, soil moisture and chemical fertilization, par-ticularly with nitrogen, affect the concentration of chlorophyll, the formation of biomass and grain yield. Chlo-rophyll is the primary photosynthetic pigment of plants; together with foliar nitrogen, it varies with solar radia-tion [16]. Leaf chlorophyll is closely related to the concentration of N, reflecting the nutritional status of the plant with respect to this important nutrient. Nitrogen is essential for the synthesis of chlorophyll; as part of this molecule, it is involved in the process of photosynthesis [17] Potash and Phosphate Institute, 1997. Adequate amounts of nitrogen in the plant produce dark green leaves with a high concentration of chlorophyll. The green pigment of chlorophyll absorbs the light energy needed to start photosynthesis. The objective of this research was to determine chlorophyll concentration and yield response in elite corn lines with low level of inbreeding in the Bajío region of Mexico.
adapta-tions manifest as changes in plant height, corn cob height, the number, size and angle of leaves, the number of branches of the ear, corn cob length [18] (Rodriguez et al., 2012).
2. Material and Methods
2.1. Plant Materials and Experimental Design
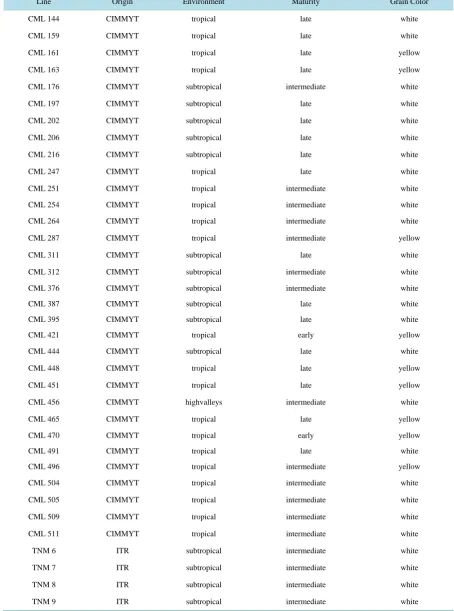
The study was conducted in the experimental field of the Division of Graduate Studies and Research of the Ro-que Institute of Technology (ITR), located at kilometer 8 of the Celaya-Juventino Rosas highway in Celaya, Guanajuato, with coordinates 20˚34'54.24"N and 100˚49'35.34"W and an altitude of 1767 masl [10] (INEGI, 2014). The climate is semi-warm, sub-humid BS, and C (Wo), with the average temperature ranging from 14˚C to 22˚C, and rainfall ranging from 600 - 1000 milliliters per year. The soils in the region are PelicVertisol and Chromic Vertisol, with predominance of the first. These soils are clayey, slightly alkaline levels, extremely fer-tile and suitable to a variety of crops. We used 36 corn inbred lines (S9) and a randomized complete block de-sign with three replications. The experimental plot consisted of two furrows 5m in length and 0.75 m apart, with a plant spacing of 17 cm, giving a population density of 85,000 plants per hectare. The experiment was estab-lished in two planting dates, the first on March 31, and the second on June 4. Planting was done manually, planting two seeds per hole at a distance of 0.25 m. The material was planted in moist soil and the first irrigation was applied at 15 days. The fertilizer formula was 240-60-00 (NPK); it was applied in two doses, the first at 35 days after planting, and the second at 75 days. We used 32 elite lines from the International Maize and Wheat Improvement Center (CIMMYT), and four lines from the improvement program of the ITR (Table 1).
2.2. Treatment
We determined chlorophyll concentration at six stages (Table 2) using a chlorophyll meter SPAD-502 (Minolta Camera Co., Ltd., Japan). Chlorophyll concentration was measured at the following stages: V6, considering the last true leaf, VT, R3, R4, R5 and physiological maturity; in the latter stages, we considered the leaf of the main cob and performed three measurements per leaf (basal, middle and apical). The values were recorded in SPAD units. We performed a combined analysis, considering lines and dates, using the SAS software v.9.3; Tukey’s test was used to compare the means (5%). We performed a morphological characterization of the 36 corn lines, of which 32 were from CIMMYT and four from the ITR; this was done in order to determine the similarities and differences between them, and to identify common groups that allow for more efficient breeding. In this charac-terization, we measured the following variables: plant height (PH), measured from the base of the plant to the tip of the ear; corn cob height (CH), measured from the base of the plant to the base of the cob; days to male flo-wering (MF), established as the day when more than 50% of the plants in the plot were releasing pollen on more than 50% of the ear; days to female flowering (FF), established as the day when more than 50% of the plants in the plot had receptive stigmas; leaves below the corn cob (LBC); leaves above the corn cob (LAC); corn cob cover (CC); corn cob length (CL), measured with a ruler graduated in cm, from the base to the tip of the corn cob, in a sample of five corn cobs per plot; diameter of the cob (DC), measured in the middle of the cob with a vernier graduated in cm, recording the average of five cobs per plot; number of rows per cob (RC) and kernels per row (KR), estimated by counting the rows and the number of grains per row in a sample of five cobs per plot and recording the average value; physiological maturity (PM), defined as the days from the first irrigation day; and grain yield (GY), estimated by harvesting all plants in the plot, weighing the grain in kg, and calculating t∙ha-1
adjusted to 15% moisture. For the identification and selection of the lines, we built a matrix with the aver-age values of the 14 agronomic characteristics from the three repetitions and the two dates, in order to generate a dendrogram by cluster analysis; the x-axis represented the Euclidean distances between genetic links, and the y-axis represented the corn lines. We used the UPGMA method (Unweighted Pair-Group Method with Arith-metic mean) to calculate the distances and generate compact and homogeneous groups in order to morphologi-cally differentiate the groups within the lines.
2.3. Clusters of Lines
Table 1. Genealogical description of the lines.
Line Origin Environment Maturity Grain Color
CML 144 CIMMYT tropical late white
CML 159 CIMMYT tropical late white
CML 161 CIMMYT tropical late yellow
CML 163 CIMMYT tropical late yellow
CML 176 CIMMYT subtropical intermediate white
CML 197 CIMMYT subtropical late white
CML 202 CIMMYT subtropical late white
CML 206 CIMMYT subtropical late white
CML 216 CIMMYT subtropical late white
CML 247 CIMMYT tropical late white
CML 251 CIMMYT tropical intermediate white
CML 254 CIMMYT tropical intermediate white
CML 264 CIMMYT tropical intermediate white
CML 287 CIMMYT tropical intermediate yellow
CML 311 CIMMYT subtropical late white
CML 312 CIMMYT subtropical intermediate white
CML 376 CIMMYT subtropical intermediate white
CML 387 CIMMYT subtropical late white
CML 395 CIMMYT subtropical late white
CML 421 CIMMYT tropical early yellow
CML 444 CIMMYT subtropical late white
CML 448 CIMMYT tropical late yellow
CML 451 CIMMYT tropical late yellow
CML 456 CIMMYT highvalleys intermediate white
CML 465 CIMMYT tropical late yellow
CML 470 CIMMYT tropical early yellow
CML 491 CIMMYT tropical late white
CML 496 CIMMYT tropical intermediate yellow
CML 504 CIMMYT tropical intermediate white
CML 505 CIMMYT tropical intermediate white
CML 509 CIMMYT tropical intermediate white
CML 511 CIMMYT tropical intermediate white
TNM 6 ITR subtropical intermediate white
TNM 7 ITR subtropical intermediate white
TNM 8 ITR subtropical intermediate white
Table 2.Phenological stages of the corn lines; Roque, Celaya, Guanajuato, 2014.
Measurement Stage Days Description
1 V6 40 The collar of the sixth leaf is visible
2 VT 87 Flowering
3 R3 97 Milky stage
4 R4 107 Doughystage
5 R5 117 Dentedstage
6 MF 127 Physiologicalmaturity
to form a grouping (i j). This process uses the distances of all population pairs in the dendrogram (ni, nj); the distances between the group (i j) and another dendrogram H is obtained by:
( )
( ) ( )
i kDikD ij H
N K N H
a a
=
where: Dik = distance between lines in the dendrogram (i j) and lines in the dendrogram H. N (K) N (H) = number of data in dendrograms (i j) and H, respectively.
The parameters used by the combinatorial formula are: αi = αj = −0.5 (Everitt, 1980; Lance and Williams, 1967).
3. Results and Discussion
Statistical Analysis
Table 3. Mean squares of chlorophyll (SPAD units) at the different phenological stages of the corn lines. Roque, Celaya,
Guanajuato, 2014.
FV GL V6 VT R3 R4 R5 MF
Blocks 2 6.09 24.94 14.31 7.94 249.09 43.60
Lines (A) 35 65.68** 76.92** 116.62** 171.41** 231.58** 223.01** Dates (B) 1 333.01** 2238.00** 1952.89** 3405.00** 4346.00** 15,471.98**
A x B 35 40.86* 27.35ns 60.09* 38.58ns 94.00* 111.68*
Error 70 23.09 23.04 34.11 34.39 52.85 69.86
Total 215 7541.60 9753.10 13044.81 15271.73 2,3655.37 38,131.82
**
= significance at p < 0.01; *= significance at p < 0.05; ns = not significant. V6 = sixth leaf stage. VT = flowering stage. R3 = milk stage. R4 = doughy stage. R5 = dented stage and PM = physiological maturity.
Table 4. Comparison of the means of chlorophyll content (SPAD units) in the combined analysis of different phenological
stages of corn lines. Roque. Celaya, Guanajuato, 2014.
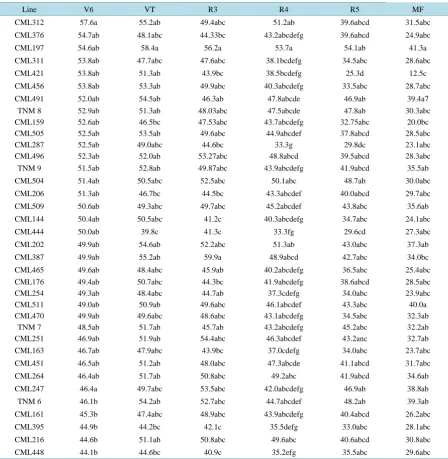
Line V6 VT R3 R4 R5 MF
CML312 57.6a 55.2ab 49.4abc 51.2ab 39.6abcd 31.5abc
CML376 54.7ab 48.1abc 44.33bc 43.2abcdefg 39.6abcd 24.9abc
CML197 54.6ab 58.4a 56.2a 53.7a 54.1ab 41.3a
CML311 53.8ab 47.7abc 47.6abc 38.1bcdefg 34.5abc 28.6abc
CML421 53.8ab 51.3ab 43.9bc 38.5bcdefg 25.3d 12.5c
CML456 53.8ab 53.3ab 49.9abc 40.3abcdefg 33.5abc 28.7abc
CML491 52.0ab 54.5ab 46.3ab 47.8abcde 46.9ab 39.4a7
TNM 8 52.9ab 51.3ab 48.03abc 47.5abcde 47.8ab 30.3abc
CML159 52.6ab 46.5bc 47.53abc 43.7abcdefg 32.75abc 20.0bc CML505 52.5ab 53.5ab 49.6abc 44.9abcdef 37.8abcd 28.5abc
CML287 52.5ab 49.0abc 44.6bc 33.3g 29.8dc 23.1abc
CML496 52.3ab 52.0ab 53.27abc 48.8abcd 39.5abcd 28.3abc
TNM 9 51.5ab 52.8ab 49.87abc 43.9abcdefg 41.9abcd 35.5ab
CML504 51.4ab 50.5abc 52.5abc 50.1abc 48.7ab 30.0abc
CML206 51.3ab 46.7bc 44.5bc 43.3abcdef 40.0abcd 29.7abc
CML509 50.6ab 49.3abc 49.7abc 45.2abcdef 43.8abc 35.6ab
CML144 50.4ab 50.5abc 41.2c 40.3abcdefg 34.7abc 24.1abc
CML444 50.0ab 39.8c 41.3c 33.3fg 29.6cd 27.3abc
CML202 49.9ab 54.6ab 52.2abc 51.3ab 43.0abc 37.3ab
CML387 49.9ab 55.2ab 59.9a 48.9abcd 42.7abc 34.0bc
CML465 49.6ab 48.4abc 45.9ab 40.2abcdefg 36.5abc 25.4abc CML176 49.4ab 50.7abc 44.3bc 41.9abcdefg 38.6abcd 28.5abc
CML254 49.3ab 48.4abc 44.7ab 37.3cdefg 34.0abc 23.9abc
CML511 49.0ab 50.9ab 49.6abc 46.1abcdef 43.3abc 40.0a
CML470 49.9ab 49.6abc 48.6abc 43.1abcdefg 34.5abc 32.3ab
TNM 7 48.5ab 51.7ab 45.7ab 43.2abcdefg 45.2abc 32.2ab
CML251 46.9ab 51.9ab 54.4abc 46.3abcdef 43.2anc 32.7ab
CML163 46.7ab 47.9abc 43.9bc 37.0cdefg 34.0abc 23.7abc
CML451 46.5ab 51.2ab 48.0abc 47.3abcde 41.1abcd 31.7abc
CML264 46.4ab 51.7ab 50.8abc 49.2abc 41.9abcd 34.6ab
CML247 46.4a 49.7abc 53.5abc 42.0abcdefg 46.9ab 38.8ab
TNM 6 46.1b 54.2ab 52.7abc 44.7abcdef 48.2ab 39.3ab
CML161 45.3b 47.4abc 48.9abc 43.9abcdefg 40.4abcd 26.2abc
CML395 44.9b 44.2bc 42.1c 35.5defg 33.0abc 28.1abc
CML216 44.6b 51.1ab 50.8abc 49.6abc 40.6abcd 30.8abc
CML448 44.1b 44.6bc 40.9c 35.2efg 35.5abc 29.6abc
[image:6.595.87.536.249.709.2]since the lines contained and produced the highest concentration of chlorophyll in the R4 and R5 stages; the early date showed better results than the late date (June).
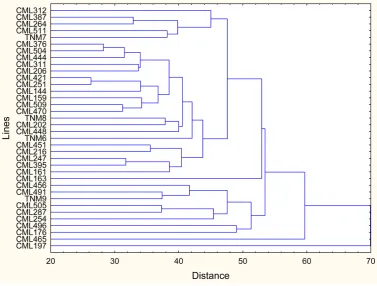
There were also lines that did not exceed 51 SPAD units, particularly in the R4 and R5 stages, despite be-longing to the first statistical group; therefore, these lines do not have a high yield potential, although they can-not be completely discarded. Figure 1 shows the variation between the 36 lines; five major groups were formed according to chlorophyll concentration in the six phenological stages. This indicates that the lines belonging to each group are similar despite coming from different environments and showing different precocity. The first group consisted of three lines, CML 312, CML 505 and CML 496, with SPAD values ranging from 44.51 to 47.46 and an average of 45.90. The second group was formed by 10 lines: CML 491 TNM 9, CML 509, CML 511, TNM 7, CML 202, CML 251, CML 451, CML 216 and CML 264, which had SPAD values from 44.36 to 48.10, with an average 45.93. The third and fourth groups were formed by two lines each: CML 247, TNM 6 and TNM 8, CML 504, respectively; they showed an average of 46.90 and 46.77 SPAD units, respectively. The fifth group was formed by the CML 387 line, with an average of 48.48 SPAD units, while the sixth group was formed by 13 lines: CML 376, CML 206, CML 465, CML 176, CML 161, CML 311, CML 456, CML 470, CML 159, CML 287, CML 144, CML 254 and CML 163, with an average of 41.24 SPAD units. The seventh group was formed by three lines CML 444, CML 395 and CML 448, ranging from 36.92 to 38.37 and with an average of 37.77 SPAD units. Finally, the eighth group was formed by two lines: CML 197 and CML 421, with an average of 45.33 SPAD units. The information generated by the grouping allowed us to identify the more compact groups in terms of their similarity in SPAD values; similar lines could be used in hybrid combinations in a genetic improvement program [18].
[image:7.595.124.502.408.694.2]The dispersion of the 14 agronomic characteristics of the 36 inbred lines can be seen in Figure 2, where the main components, 1 (2.31%) and 2 (3.77%), accounted for 6.08% of the phenotypic variation observed in the 36 lines. According to the eigenvectors, the variables with more weight in the first factor were: PH, CH, LBC, FF, MF, PM, P100, CL, DC, CC and GY. In the second factor, the most important variables were: LAC, KR and RC. Considering all 36 lines, we observed that plant height ranged from 1.48 to 1.92 m, with as average of 1.71 m; corn cob height ranged from 0.63 to 0.91 m, with an average of 0.77 m.
Figure 1.Dendrogram generated from the SPAD units of 36 inbred lines of corn at six phenological stages
Figure 2. Dispersion of the 14 agronomic characteristics of the 36 inbred lines in the mean plane
determined by the main components.
The variable of the number of leaves above the cob was higher than that of leaves below the cob, with an av-erage of 7.13. Flowering was more precocious in the first date, which is explained because the temperatures in March were above 28˚C, while the temperatures declined in June. Female flowering, male flowering, physio-logical maturity and cob diameter showed a positive association with 0.84, 0.83, 0.79 and 0.87 respectively. With respect to cob length, rows per cob, kernels per row, weight of 100 seeds and grain yield, there were on average higher values on the first date. These results show the genetic diversity of the 36 lines in terms of ap-pearance, health of plant and cob, precocity and yield. This variability is attributable to the selection and identi-fication of germplasm, which could thus be used as a criterion for a future genetic improvement program [18]. The cluster analysis for agronomic characteristics detected eight groups, which were formed with 5, 11.4, 5, 1.6, 2.1, and 1, respectively. The first group was formed by lines CML312 of subtropical origin with intermediate maturity cycle, CML387 subtropical-late, CML264 tropical-intermediate, CML511tropical-intermediate and TNM 7 subtropical-intermediate. The second group was 63.63% tropical, with the lines CML 504, CML 421, CML 251, CML 144, CML 159, CML 509 and CML 470, two lines of late maturing, three intermediate and two early. The CML 421 and CML 470 lines seem to be particularly excellent choices as a source of resistance to drought under these environmental conditions, in which the lines in question can be used for the production of hybrids. This is why they should be considered for use in genetic improvement programs by researchers aware of the variability of rain in rain fed agriculture.
the agronomic variables.
The classification of the lines according to different planting dates and contrasting maturity cycles will help create a more effective genetic improvement program, that is, less time-consuming and less costly. This is con-sistent with the results of [22], who reported the importance of identifying promising genetic material when performing a morphological characterization, as they did in 52 populations, concluding that the maturity cycle and the environment of the genetic materials are very important for differentiating them into groups and con-ducting a genetic improvement program. Moreover, [18] performed a morphological characterization of corn lines and concluded that clusters allow to identify lines from different environments and different maturity cycles, which can help conduct a more efficient genetic improvement program and obtain materials with a greater range of adaptation. The main components allowed to group agronomic characteristics into two major vectors.
4. Conclusion
We identified 18 lines with the highest chlorophyll content (above 51 SPAD units), the best for obtaining hybr-ids with a high yield potential. In the V6 stage, the line with the highest chlorophyll content was CML 312, with 57.66 SPAD units; in the flowering, R4, R5 and R6 stages, the CML 197 line had the highest chlorophyll con-tent, with 58.45, 53.72, 54.15 and 41.38 SPAD units, respectively. In the R3 stage, the CML 387 line was the one with the highest chlorophyll content, with 59.91 SPAD units. We also identified lines with low concentra-tions of chlorophyll in each vegetative stage: CML 448, CML 444, CML 448, CML 287 and CML 421, with 44.15, 39.80, 40.96, 32.32, 25.30 and 12.57 SPAD units, respectively; the last two values corresponded to the genotype CML 421. We formed 7 groups of corn lines according to the concentration of chlorophyll and eight according to the agronomic characteristics; this helped identify common groups for a hybridization program.
References
[1] Cao, M.J., Yu, H.Q. and Yan, H.K. (2007) Difference in Tolerance to Potassium Deficiency between Two Maize In-bred Lines. Plant Production Science, 10, 42-46. http://dx.doi.org/10.1626/pps.10.42
[2] Marschner, H. and Marschner, P. (2011) Marschner’s Mineral Nutrition of Higher Plants. Elsevier, London.
[3] Pettigrew, W.T. (2008) Potassium Influences on Yield and Quality Production for Maize, Wheat, Soybean and Cotton. Physiologia Plantarum, 133, 670-681. http://dx.doi.org/10.1111/j.1399-3054.2008.01073.x
[4] Jin, J.Y. (2012) Changes in the Efficiency of Fertiliser Use in China. Journal of the Science of Food and Agriculture,
92, 1006-1009.
[5] Gentinetta, E., Ceppi, D., Perico, G., Motto, M. and Salamini, F.A. (1986) Major Gene for Delayed Senescence in Ma-ize: Pattern of Photosynthates Accumulation and Inheritance. Plant Breeding, 97, 193-203.
http://dx.doi.org/10.1111/j.1439-0523.1986.tb01053.x
[6] Stefan, H. (2009) Stay-Green Regulates Chlorophyll and Chlorophyll-Binding Protein Degradation during Senescence. Trends in Plant Science, 14, 155-162. http://dx.doi.org/10.1016/j.tplants.2009.01.002
[7] Etsushi, K., Ken, J.I., Satoshi, U., Keiichi, O., Cevayir, C. and Shizuo, A. (2011) Silica Crystals and Aluminum Salts Regulate the Production of Prostaglandin in Macrophages via NALP3 Inflammasome-Independent Mechanisms. Im-munity, 34, 514-526. http://dx.doi.org/10.1016/j.immuni.2011.03.019
[8] Haldimann, P., Fracheboud, Y. and Stamp, P. (1996) Photosynthetic Performance and Resistance to Photoinhibition of Zea mays L. Leaves Grown at Suboptimal Temperature. Plant, Cell and Environment, 19, 85-92.
http://dx.doi.org/10.1111/j.1365-3040.1996.tb00229.x
[9] Wang, X.G., Zhao, X.H., Jiang, C.J., Li, C.H., Cong, S., Wu, D., Chen, Y.Q., Yu, H.Q. and Wang, C.Y. (2015) Effects of Potassium Deficiency on Photosynthesis and Photoprotection Mechanisms in Soybean (Glycine max (L.) Merr.).Journal of Integrative Agriculture, 14, 856-863. http://dx.doi.org/10.1016/S2095-3119(14)60848-0
[10] Haochuan, L., Jihua, T., Yanmin, H.V., Jiwey, Y. and Zonghua, L. (2014) Analysis on Combing Ability and Estima-tion of Genetic Parameter for Clorophyllconten in Maize. Journal of Plant Breeding and Crop Science, 6, 97:104. [11] Ángeles, G.E., Ortiz, E.T., López, P.A. and López, G.R. (2010) Characterization and Performance of Populations of
Native Corn Molcaxac, Puebla. Revista Fitotecnia Mexicana, 33, 287-296.
[13] Caires, N.O.S., de Carvalo, G.J.D.., Pereira, M.F.A. and Pinho, T.R. (2005) Uso do SPAD 502 naavaliação dos teores foliares de clorofila, nitrogênio, enxofre, ferro e manganês do algodoneira herbáceo.
[14] Gold, M.M. (2001) Energy Processes of Life: Photosynthesis. 3ᵃ Print. Editorial UNAM, Institute of Geography, Mex-ico D.F., 245 p.
[15] Fageria, N.K. (2009) The Use of Nutrients in Crop Plants. CRC Press, Boca Raton.
[16] Jiang, C.C., Chen, F., Gao, X.Z., Lu, J.W., Wan, K.Y., Nian, F.Z. and Wang, Y.H. (2008) Study on the Nutrition Cha-racteristics of Different K Use Efficiency Cotton Genotypes to K Deficiency Stress. Agricultural Science in China, 7, 740-745. http://dx.doi.org/10.1016/S1671-2927(08)60109-1
[17] Peterson, R.B., Oja, V. and Laisk, A. (2001) Chlorophyll Fluorescence at 680 and 730 nm and Leaf Photosynthesis. Photosynthesis Research, 70, 185-196. http://dx.doi.org/10.1023/A:1017952500015
[18] Rodríguez, PG., Zavala, F.G., Ojeda, C.Z., Gutiérrez, A.D., Treviño, J.E.R. and Rincón, F.S. (2012) Diversity of Lan-draces of Nuevo Leon, Mexico, by AFLP and Morphological Characters. Mesoamerican Agriculture, 23, 29.39. [19] Liu, J.C., Li, J.S., Mi, G.H., Chen, F.J. and Zhang, F.S. (2009) QTL Mapping of Seedling Growth Traits and Grain
Yield under Two Nitrogen Conditions in Maize. Scientia Agricultura Sinica, 42, 3413-3420. (In Chinese)
[20] Osório, J., Osório, M.L., Correia, P.J., de Varennes, A. and Pestana, M. (2014) Chlorophyll Fluorescence Imaging as aTool to Understand the Impact of Iron Deficiency and Resupply on Photosynthetic Performance of Strawberry Plants. Scientia Horticulturae, 165, 148-155. http://dx.doi.org/10.1016/j.scienta.2013.10.042
[21] D’Hooghe, P., Escamez, S., Trouverie, J. and Avice, J.C. (2013) Sulphur Limitation Provokes Physiological and Leaf Proteome Changes in Oilseed Rape That Lead to Perturbation of Sulphur, Carbon and Oxidative Metabolisms. BMC. Plant Biology, 13, 23. http://dx.doi.org/10.1186/1471-2229-13-23