Munich Personal RePEc Archive
Testing Kahneman’s Attitudinal WTP
Hypothesis
Ryan, Anthony M. and Spash, Clive L.
Norwegian University of Life Sciences
May 2010
Online at
https://mpra.ub.uni-muenchen.de/22468/
Testing Kahneman's Attitudinal WTP Hypothesis1
Anthony M Ryan and Clive L Spash by
2
1Data used originates from two projects. Study 1 was sponsored by the European Commission DG XII under
the project on “Social Processes of Environmental Valuation” co-ordinated by Martin O’Connor, EC contract ENV4-CT96-0226; the final report can be found on-line at http://alba.jrc.it/valse/report.htm. Study 2 was part of the European Community project “Integrated Evaluation for Sustainable River Basin Governance”
(ADVISOR), co-ordinated by Paula Antunes, EC Contract EVK1-CT-2000-00074 under the Framework V, Energy, Environment and Sustainable Development RTD Programme.
Abstract
A psychological interpretation of willingness to pay (WTP) bids arising from the Contingent
Valuation Method (CVM) claims they represent a general contribution towards environmental
causes rather than a personal economic valuation. Yet the evidence supporting this
contribution model has been criticised for using group mean correlations to draw conclusions
about individual motives. This paper avoids this problem by examining motives at an
individual level. Evidence reported shows the need to qualify the role of the attitudinal
explanation. Some, but not all, positive WTP bids are found to be based on contributory
rather than economic motives, while the decision to bid zero or positive appears to represent a
general psychological appraisal rather than being purely related to attitudes.
2 Anthony M. Ryan is a researcher at the Sustainable Ecosystems Division of the CSIRO, Canberra, Australia.
I. INTRODUCTION
The CVM is a controversial but commonly applied approach for placing a monetary value on
an actual or proposed environmental change. Many economists believe that a well designed
and properly administered CVM survey will result in a reliable estimation of the 'true'
monetary valuation of an environmental proposal (e.g. Arrow, et al. 1993; Bateman, et al.
2002; Mitchell and Carson 1989; Smith 1994). The contention is that, under the right
conditions, if you ask a member of the public "What is the maximum you would be willing to
pay for environmental improvement X", participants will readily provide a meaningful
response that reflects their personal monetary valuation of the proposal and can be taken as
representing the welfare they would gain. This approach assumes that people are not only
capable of comparing the utility of the status quo with the utility of a proposed change, but
are also able to estimate how much money they would be willing to spend in order to
purchase the benefits that they, or their household, would derive from such a proposal. The
greater the perceived net benefit of the proposal, the more respondents should be prepared to
pay. Thus, a positive WTP bid is taken to represent the exchange of money for positive
welfare benefits.
This overall approach has been termed the “purchase model” by Kahneman and
colleagues (Kahneman and Ritov 1994; Kahneman, et al. 1993; Kahneman, Ritov and
Schkade 1999). These psychologists have then put forward an alternative explanation of the
motives underlying WTP responses which they label the “contribution model”. They assert
this to be a psychologically more plausible interpretation. The contribution model portrays
positive WTP bids as being motivated by a perception that the environmental proposal
outlined by a CVM survey is a good cause that needs supporting (Kahneman and Ritov
1994). Respondents are deemed to be fully aware that any monetary amount that they
applied (Kahneman and Ritov 1994; Kahneman, et al. 1993). The contribution model posits
that the spirit of donation, rather than acquisition, is the primary motivation underling a
positive WTP response. Instead of assessing the costs and benefits of outcomes, people are
regarded as concerned with taking positive action to address a social problem. Respondents
may even be willing to give more due to a belief that an action is “right” in comparison with
those making a judgement based on consequences (Spash 2000, 2006). The contribution
model clearly denies that a positive WTP is representative of the monetary value of the
welfare benefits arising from an environmental improvement, and suggests that some people
are willing to pay for social goods from which they expect to derive no personal utility.
Kahneman and Ritov (1994, p.7) state that “a favourable attitude to an object is
usually correlated with favourable attitudes to actions that will protect that object from harm,
or restore it if it has been harmed” and go on to suggest that a positive WTP bid represents a
favourable attitude supporting a proposed societal change. The link between WTP and the
concept of attitudes is so central to the contribution model that Kahneman and Ritov state
their main substantive hypothesis “is that WTP is a measure of attitude on a scale of
hypothetical dollars” (p.28). They draw upon Andreoni’s (1989) warm glow hypothesis
suggesting that “an individual who has a favourable attitude to a cause derives utility from
contributing to it” (p.8). The contribution model therefore puts forward an “attitudinal
hypothesis”, positing that WTP is an attitudinal measure. Kahneman et al. (1999) further
clarify this by stating that “attitudes can be expressed on a scale of dollars, as well as on
rating scales” (p.207). This attitudinal hypothesis predicts that WTP responses will correlate
with a range of attitude measures. The more positive an attitude towards an environmental
change, the greater should be the stated WTP, although Kahneman et al. (1999) also argue
This paper aims to test the relevance of the contribution model and the attitudinal
hypothesis. In the next section we review the role of attitudes and the evidence for
interpreting WTP as an attitudinal measure within a contribution framing. Two CVM study
datasets are then presented and analysed.
II. THE CONTRIBUTION MODEL AND THE ATTITUDINAL HYPOTHESIS
The contribution model assumes that CVM measures attitudes towards a proposed
environmental change. Attitudes are defined as being an evaluative tendency, which can be
favourable or unfavourable (Eagly and Chaiken 1993). Psychologists clearly conceptually
distinguished attitudes from other psychological variables. The theory of planned behaviour
(TPB) identifies attitudes as being only one out of three main influences on behavioural
intentions (Ajzen 1991, 2001). Subjective norms and perceived behavioural control are
defined as being non-attitudinal psychological variables that are posited to independently
influence behavioural intentions above and beyond the influence of attitudes. If these
non-attitudinal psychological variables are found to have an independent and significant
relationship with responses to WTP surveys, then this would suggest that WTP designs are
measuring a broader psychological evaluation of a social proposal than an attitudinal
assessment.
One of the strengths of the contribution model is that WTP responses are
conceptualised as being mental representations rather than an objective economic assessment.
Such a psychological approach makes sense of findings that are anomalies under the
orthodox economic interpretations. For example, the psychological literature acknowledges
that attitudinal scales can be extremely sensitive to context effects, such as framing and
anchoring, while also being insensitive to seemingly vital information such as embedding
Bohner 2001). Attitudes toward richly experienced 'objects', such as family members, one’s
own nation, and familiar environments, can be particularly vulnerable to context effects
(Eagly and Chaiken 2007). This implies that responses to attitudinal scales assessing social
projects can be heavily influenced by contextual factors related to the measurement design.
Kahneman et al. (1999) argue that the nature of cognitive and evaluative processes make it
unavoidable that CVM will be context dependent and this is not a result of defective
procedures, nor will it be satisfactorily eliminated by changing survey design.
Evidence supporting the attitudinal hypothesis is primarily based upon three published
journal articles that administered the headline method (Kahneman and Knetsch 1992;
Kahneman and Ritov 1994; Kahneman, et al. 1993). The headline method asks participants
to assess a list of solutions to public problems. While some of the participants assess the
public problems on a WTP scale, other participants respond on an attitudinal scale. For each
scale the list of solutions to public problems are ranked according to their mean or median
scores. A rank correlation assessing the degree of similarity in the ordering of the public
problems based on mean/median scores of attitude scale and WTP measure is then reported.
As shown in Table 1, the headline method studies have reported some very strong rank
correlations between WTP and a number of single item attitudinal scales. Kahneman et al.
(1999) also note supporting results from an experimental study by Kahneman, Schade and
Sunstein (1998) that employed the headline method to look at punitive damages in a product
liability case. Furthermore, Payne et al. (1999) found high rank correlation between
attitudinal measures and stated WTP using a similar design.
Kahneman and Ritov (1994) note the importance of investigating the mean scores of a
specific proposal because many public decisions are based on aggregated data and average
CVM scores are used by economists rather than individual scores. However, the literature
psychological process operating at an individual level. Based on the rank correlations the
authors have concluded that attitudinal scales and WTP are almost interchangeable measures
of the same attitude, with the rank correlations being interpreted as representing “an idealised
[image:7.595.63.524.219.720.2]subject” or person (Kahneman et al. 1993).
TABLE 1
Reported Rank Correlations from Three Headline Method Studies
Study and Scale Correlation with
WTP
Kahneman and Knetsch (1992)
Moral satisfaction (group 1) 0.78
Moral satisfaction (group 2) 0.62
Kahneman et al. (1993)
Rating of political support for intervention 0.75
Rating of personal satisfaction expected from making a voluntary contribution of time or money to the intervention
0.79
Rating of how upsetting it would be to read the story announce by the headline or to watch the item on television
0.52
Rating of the importance of the problem 0.72
Kahneman and Ritov (1994)
Rating of political support for intervention
WTP 0.84
% WTP 0.82
N (WTP) 0.81 Rating of personal satisfaction expected from making a voluntary
contribution of time or money to the intervention
WTP 0.84
% WTP 0.80
N (WTP) 0.88 Rating of the importance of the problem
WTP 0.76
% WTP 0.66
N (WTP) 0.83
Notes:
Nickerson (1995) has criticised such an approach, arguing that an intrinsically
within-respondent hypothesis cannot be tested by correlation analysis based on means or medians,
except in some special and restricted cases. A more appropriate hypothesis test would be to
simultaneously collect attitudinal ratings and a WTP value from each respondent. Nickerson
(1995) describes the headline study approach as an example of a subtle and insidious
methodological problem known as “cross-level inference”. This is defined as instances
where data are organised or aggregated in one way, but the conclusions drawn from the
analysis of those data assumes that the data are organised or aggregated in some other way.
A good example of cross-level inference is the following quote by Kahneman et al. (1993):
“our main finding was that correlations between the rankings of environmental issues by
different response measures were high suggesting that the WTP to make a personal
contribution of money, support for political action and a simple rating of the importance of
the problem are almost interchangeable measures of the same attitude” (p.314). Nickerson
(1995) demonstrates that there is no necessary mathematical relationship between the
correlation of the group means and the mean within-respondent correlation.
Monin and Oppenheimer (2005) provide a simple example that demonstrates the
dangers in mixing-up correlated averages with averaged correlations. Table 2 displays the
scores of two judges who each rate four stimuli: a, b, c, d on two separate dimensions A and
B. The within-respondent level proposed by Nickerson (1995) correlates the two dimensions
for each of the judges and reports a strongly negative correlation (r = -0.80). In contrast an
approach, analogous to the headline method, which correlates the rankings of mean scores for
each of the four stimuli, reports a perfectly positive rank correlation (r = +1.00). While
Monin and Oppenheimer’s example of cross-level inference is extreme, the problem clearly
exhibits that the onus of proof lies with Kahneman and colleagues to demonstrate that
'idealized' respondent. Kahneman and Ritov (1994) comment that while they are aware that
Nickerson considers cross-level inference to be a serious concern they do not. Kahneman et
al. (1999) suggest that any major differences between rank correlations and
within-respondent correlations will be due to the group scores being dominated by a few individuals.
They point out that the headline studies assessed the effects of standardising the data of each
individual and concluded that the data set did not contain atypical patterns of responses that
would be indicative of individuals behaving inconsistently with the rank correlation
conclusions. However, even if there are no worrisome outliers it is still possible that there are
fundamental differences between how people respond to WTP scales and attitudinal
measures.
TABLE 2
Disjunction between Rank and Within-Respondent Correlations
Stimulus
a b c d
Judge 1 Dimension A 0 2 4 6
Dimension B 6 2 4 0 r = -0.80
Judge 2 Dimension A 6 2 4 0
Dimension B 0 2 4 6 r = -0.80
Mean scores Dimension A 3 2 4 3 Rank = +1.00 Dimension B 3 2 4 3 Within-respondent = -0.80
Source: Monin and Oppenheimer (2005)
Kahneman and colleagues argue that a WTP money scale is psychometrically a
measure of attitudes, and a poor one. The ‘headline studies’ demonstrate the statistical
inefficiency of the open-ended WTP scale by analysing: (i) the variance between the different
issues that are presented, (ii) the variance associated with individual differences and (iii) the
noise variance. A good scale should be able to differentiate between various issues, but
al. (1993) and Kahneman and Ritov (1994) found the proportion of problem-related variance
to be larger for the attitudinal scales, while the individual differences variance was much
larger for the WTP scale. Based on this evidence they propose that attitudinal scales are
statistically more efficient than the WTP scale. Kahneman and Ritov (1994) and Kahneman
et al. (1999) claim that the poor properties of the WTP scale are due to: (i) a lack of common
modulus3
Kahneman et al. (1999) also point out that most open-ended WTP distributions have a
large positive skew that degrades the statistical efficiency of the scale. They comment that and (ii) the distribution of WTP responses.
Kahneman et al. (1999) suggests that the money scale does not provide participants
with a common modulus leading to large differences between individuals as to how the
money scale is interpreted. The modulus that each WTP participant uses are claimed to be
arbitrary. Context effects in CVM questionnaire design is argued to lead not only to
individual differences in the evaluation, but also to individual differences in the money
expression of this evaluation. Attitudinal scales on the other hand are regarded as being
bounded, psychologically meaningful, response scales. Kahneman et al. (1999) suggest that
most people have an intuitive and common understanding of the meaning of the attitudinal
response scales administered by psychologists. For example, most people would have a basic
agreement on the difference between “extremely important”, “very important”, “moderately
important”, “not very important” and “not important”. Survey participants are argued to
share a common definition as to what constitutes a certain response range. Kahneman and
Ritov (1994) suggest that as a result attitudinal measures should replace WTP questions when
the goal is to assess the value of social proposals. They suggest that a money value could be
assigned to an attitudinal score based on a reference to a standard scale of attitude scores.
3 A common modulus refers to the scale being formally standardised for all participants. This term is borrowed
logarithmic transformations improve the statistical efficiency of the money scale. An
explanation as to why open-ended WTP scales are positively skewed is that the coins and
notes of monetary systems increase exponentially. For example, the UK has four
denominations of exponentially increasing pound notes in circulation: £5, £10, £20, £50.
Because people are not accustomed to thinking about many environmental proposals in terms
of monetary value, the monetary expressions of value may encourage a WTP response that
reflects the standardised currency amounts. Studies have found that such WTP estimates are
significantly over-represented amongst valuations elicited from the general population
(Whynes, et al. 2007; Whynes, Philips and Frew 2005). This suggests that rather than
responding on an arbitrary continuous scale, as proposed by Kahneman et al. (1999), many
participants may only consider a WTP valuation that is based upon a handful of numbers.
Hertwig, Hoffrage and Martignon (1999) argue people are unable to make valuations based
on the full continuum of a money scale and therefore rely on a few numbers. If
denominations from the monetary system are over-represented in WTP response
distributions, this would suggest a lack of variation in how people interpret the money scale
rather than a large arbitrary variation (as suggested by Kahneman and colleagues). However,
such a finding would also provide strong evidence, for the primary hypothesis of the
contribution model, that positive WTP bids are offered in the spirit of a donation rather than
an acquisition.
The headline studies only empirically examine the rank correlation between attitude
pertaining to a specific proposal and WTP. If participants are offering WTP based on
contributory motives then there should also be a strong positive relationship between WTP
and general attitudes towards environmental protection. A strong correlation between WTP
measures and environmental protection attitudes would provide additional support to the
costs and benefits associated with the proposal. There are several scales that are able to
measure attitudes about environmental protection. For example, the Beliefs about the
Benefits of Environmental Protection (BBEP) scale which is a statistically superior
interpretation of the awareness of consequence scale (Ryan and Spash 2008) assesses whether
the respondent believes that environmental protection is beneficial (e.g. “Environmental
protection will provide a better world for me and my children”) or whether a lack of action to
protect the environment has costs (e.g. “Pollution generated here harms people all over the
earth”). An alternative attitudinal measure of environmental protection is the Political Action
(PA) scale (Stern, Dietz and Kalof 1993). The PA scale asks participants whether they would
partake in political action supporting various environmental causes (demonstrating, signing a
petition, refusing a job at a company harming the environment, volunteering to work for
nature conservation). If specific attitudes regarding a CVM proposal and environmental
protection attitudes are found to positively correlate with WTP, then this would support the
hypothesis that positive WTP bids are motivated by general contributory and political
motives rather than representing an assessment of the specific economic benefits to be
derived from the proposal.
III. RESEARCH DESIGN AND METHOD
The current study investigates the attitudinal hypothesis by means of a within-respondent
design, investigating datasets from two different CVM surveys. Participants in each of the
CVM studies were administered a WTP question and attitudinal scales. One of the
administered scales measured specific attitudes about an environmental change proposal,
while the other scale measured attitudes about environmental protection. In each study
participants were presented with a single proposal. Therefore, unlike the headline method
errors and biases affecting quick intuitive judgements should also affect more slowly formed
judgements (Kahneman and Ritov 1994). Data was collected from representative samples
without monetary incentives to participate, unlike some of the headline method studies.
Finally, rather than measuring attitudes with a single item, multi-item attitudinal scales were
administered. The methodology and sample used are therefore better suited to investigating
the attitudinal hypothesis than the headline method studies.
The attitudinal hypothesis is tested by examining whether there is a strong
within-respondent relationship between attitudinal scales and WTP. Kahneman and Ritov (1994),
noting the findings by McFadden and Leonard (1992), point out that the propensity to make
positive contributions and the size of these contributions may be essentially independent
characteristics of respondents. We therefore decided to separately investigate whether
attitudinal measures are able to predict: (i) the two bid type classifications of zero and
positive and (ii) the amount offered by positive bidders.
In addition, we aim to analyse whether the psychologists' definition of attitudes, as an
evaluative tendency which can be favourable or unfavourable, is broad enough to be able to
adequately define WTP as an attitudinal scale. The contention here is that there is more to
WTP responses than purely an attitudinal measure. We therefore employ factors from the
TPB, as discussed in Section 2, which represent non-attitudinal psychological variables. Two
aspects of the TPB are then added, namely, subjective norms and perceived behavioural
control.
Two datasets were collected from two different CVM surveys designed to measure
two different environmental proposals which were actually being considered by community
planners. In both surveys the data was collected by a market research company employing a
stratified random sampling procedure. Market research representatives recruited participants
administered consenting participants a face-to-face interview which initially involved the
presentation of a case study scenario that outlined an environmental proposal in need of
funding. The final versions of the survey were based upon pretesting and stakeholder
consultation.
Study 1 overview: 713 UK residents were recruited for Study 1. Participants were
asked to consider a proposal regarding the possible purchase by an existing regional charity
of a one square mile site in Eastern England currently used for crop farming. The charity was
interested in transforming the site into a wetland to provide sanctuary for rare species of birds
such as Bewick’s swan, the pintail, and gadwall. A request was made for a one-off payment
to a charitable trust. The focus on the behaviour of participants willingness to respond to the
monetary scale meant 218 participants were excluded because they either chose the ‘don’t
know’ option or refused to provide a response to the WTP question. 495 participants were
classified as giving a WTP bid (207 positive bids and 288 zero bids). Study 1 also
administered two environment protection attitudinal measures which were responded to on a
4-point scale. The two environmental protection attitudinal measures were the PA scale and
the BBEP scale (see Appendix). The PA scale reported a Cronbach α of 0.65. The BBEP
scale reported a Cronbach’s α of 0.83.
Study 2 overview: 1069 Scottish residents were recruited to participate in a CVM
survey assessing a proposal for the Tummel catchment region in Scotland. The introduction
of a compensation flow regime from the dammed lochs to mimic the natural flow in some of
the rivers within the catchment was being considered. The aim of the proposal was to restore
the diversity and abundance of species and habitats in the river catchment. Increasing river
flows from the hydro-system would potentially reduce electricity generation and increase
costs for the hydro-power companies. Such costs would then be transferred to electricity
quarter on electricity bills over the next year to restore biodiversity in the river Tummel and
its surrounding area from 14% to 70%. 336 participants were excluded answering ‘don’t
know’ or refusing to respond to the WTP question. 733 participants were classified as WTP
bidders (322 positive bidders and 411 zero bidders).
In Study 2, participants were administered two attitude scales. The first was the
BBEP scale administered in Study 1. The BBEP scale for Study 2 was answered on a 7-point
scale and reported a Cronbach’s α = 0.88. The second assessed specific attitudes about the
benefits arising from paying more for electricity in order to fund the Tummel catchment
scheme and the likelihood of such benefits. This scale was designed according to TPB
considerations (Ajzen 2006) and asked seven paired items (see Appendix). One of the paired
items asked participants to assess whether a proposed outcome for the project is good or bad
(e.g. “Enhancing water quality in the Tummel area is [1=extremely bad; 7=extremely
good]”). The other paired item asked participants to assess the likelihood of the proposed
outcome (e.g. “Paying more for electricity to restore biodiversity will enhance water quality
in the Tummel area [1=extremely likely; 7=extremely unlikely]”). The attitude score for
each item pair was based on a product score. The TPB attitude scale reported a Cronbach’s α
of 0.88.
Participants were also asked paired TPB subjective norm items, which were based on
assessing beliefs about the expectations of significant others (see appendices for items). One
of the paired items asked if the significant other expected them to offer a positive WTP bid
(e.g. “My friends would think that I [1=should; 7=should not] pay more for electricity to
preserve biodiversity in the Tummel area”). The other paired item asked the degree to which
the respondent felt pressured by the significant other (e.g. “Generally speaking, how much do
you want to do what your friends think you should do?”). The subjective norm score for each
Cronbach’s α of 0.73. A large portion of the study did not have children, a partner or parent
who was alive. A decision was made to average out the questions that were answered. If a
participant answered only 4 pairs of questions, their total score was divided by 4. If only 3
pairs were answered the total score was divided by 3. Twenty participants who answered
only 2 or less pairs of items were treated as missing data. Participants were also asked a
perceived behavioural control (PBC) item about their ability to pay (“I can easily afford to
pay more for my electricity”) on a 7-point scale.
IV. RESULTS
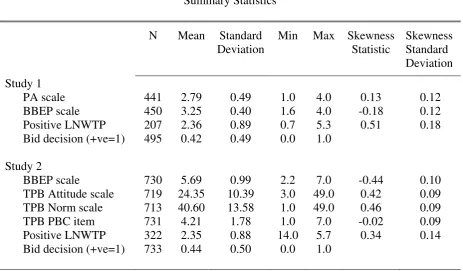
Both surveys administered an open-ended WTP question. As is usually the case, the WTP
distributions for Study 1 and Study 2 demonstrated a large positive skew. To improve the
normality of the distribution, positive bids were transformed using the log (WTP+1) formula,
which resulted in the LNWTP variable. Table 3 displays the summary statistics for the PA
[image:16.595.67.531.479.750.2]scale, the TPB scale, the BBEP scale and WTP responses.
TABLE 3 Summary Statistics
N Mean Standard Deviation
Min Max Skewness Statistic
Skewness Standard Deviation Study 1
PA scale 441 2.79 0.49 1.0 4.0 0.13 0.12
BBEP scale 450 3.25 0.40 1.6 4.0 -0.18 0.12
Positive LNWTP 207 2.36 0.89 0.7 5.3 0.51 0.18 Bid decision (+ve=1) 495 0.42 0.49 0.0 1.0
Study 2
BBEP scale 730 5.69 0.99 2.2 7.0 -0.44 0.10
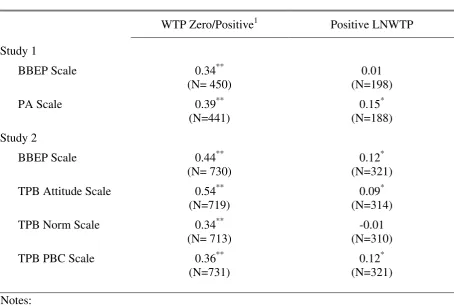
Table 4 displays the correlations between the psychological scales and the three indicators of
WTP. Notably, the correlation between positive LNWTP and the attitude scales were not
found to be high. Two of these correlations were significant at a .05 level only, while the
other two correlations were not significant. For the non-attitudinal scales, positive LNWTP
had a significant relationship with ability to pay at a .05 level only, and did not have a
significant relationship with perceived norms. At the same time, the results present in Table
4 clearly indicate that attitudinal scales had a strong relationship with the dichotomous “zero
or positive bid” variable, while also demonstrating that the “zero or positive bid” variable had
[image:17.595.72.527.352.658.2]a highly significant correlation with ability to pay and perceived norms.
TABLE 4
Correlations between Indicators of WTP and Psychological Scales
WTP Zero/Positive1 Positive LNWTP
Study 1
BBEP Scale 0.34** 0.01
(N= 450) (N=198)
PA Scale 0.39** 0.15*
(N=441) (N=188)
Study 2
BBEP Scale 0.44** 0.12*
(N= 730) (N=321)
TPB Attitude Scale 0.54** 0.09*
(N=719) (N=314)
TPB Norm Scale 0.34** -0.01
(N= 713) (N=310)
TPB PBC Scale 0.36** 0.12*
(N=731) (N=321)
Notes:
1 Point biserial correlation
* Significant at the 0.05 level (2-tailed) ** Significant at the 0.01 level (2-tailed)
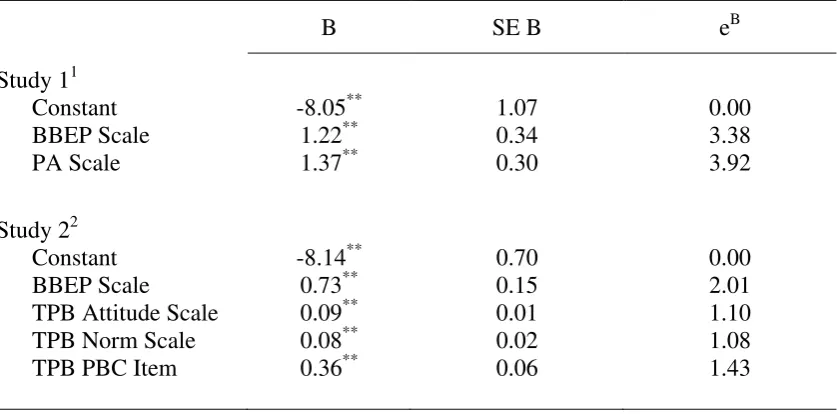
A logistic regression was run to test the influence of psychological variables in
regression for Study 1 and 2. In both cases, all of the psychological scales (attitudinal and
non-attitudinal) were found to have a highly significant and independent contribution to
predicting whether participants offer a positive or a zero bid. The Nagelkerke R2 and χ2
suggests a good model fit for a logistic regression based on only attitudinal measures (Study
1), and an even better model fit for a logistic regression based on combined psychological
[image:18.595.74.493.280.487.2]variables, which included attitudinal and non-attitudinal measures.
TABLE 5
Logistic Regression of WTP Bid Type on Psychological Scales
B SE B eB
Study 11
Constant -8.05** 1.07 0.00
BBEP Scale 1.22** 0.34 3.38
PA Scale 1.37** 0.30 3.92
Study 22
Constant -8.14** 0.70 0.00
BBEP Scale 0.73** 0.15 2.01
TPB Attitude Scale 0.09** 0.01 1.10
TPB Norm Scale 0.08** 0.02 1.08
TPB PBC Item 0.36** 0.06 1.43
Notes:
** Significant at the 0.01 level (2-tailed)
1N = 410; χ2 (2) = 79.67; Nagelkerke R2 = 0.24 2N = 701; χ2 (2) = 324.68; Nagelkerke R2 = 0.50
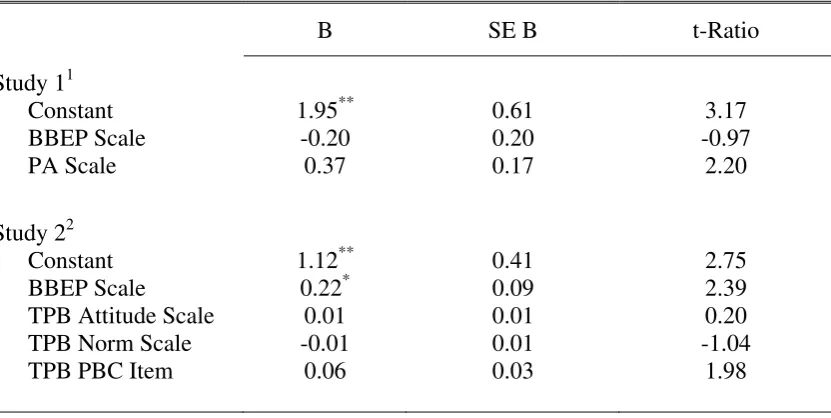
An Ordinary Least Squares (OLS) regression was run to analyse the influence of
attitudes to LNWTP for the positive bids, as shown in Table 6. The overall model for Study
1 was not found to be significant, F (2,180)= 2.43, p > 0.05. The overall model for Study 2
was significant at a 0.05 level, F (2,299) = 3.24, p < 0.05, but not at a 0.01 level. The
Adjusted R2 for both models is extremely low, suggesting that attitudinal scales cannot be
TABLE 6
OLS Regression of Positive LNWTP on Psychological Scales
B SE B t-Ratio
Study 11
Constant 1.95** 0.61 3.17
BBEP Scale -0.20 0.20 -0.97
PA Scale 0.37 0.17 2.20
Study 22
Constant 1.12** 0.41 2.75
BBEP Scale 0.22* 0.09 2.39
TPB Attitude Scale 0.01 0.01 0.20
TPB Norm Scale -0.01 0.01 -1.04
TPB PBC Item 0.06 0.03 1.98
Notes:
** Significant at the 0.01 level (2-tailed)
1 N = 182; R = 0.16; R2 = 0.03; Adjusted R2 = 0.01 2 N = 303; R = 0.20; R2 = 0.04; Adjusted R2 = 0.03
The weak correlations between attitudinal measures and WTP for positive bidders
supports the hypothesis that the monetary scale is a psychometrically poor measure. The next
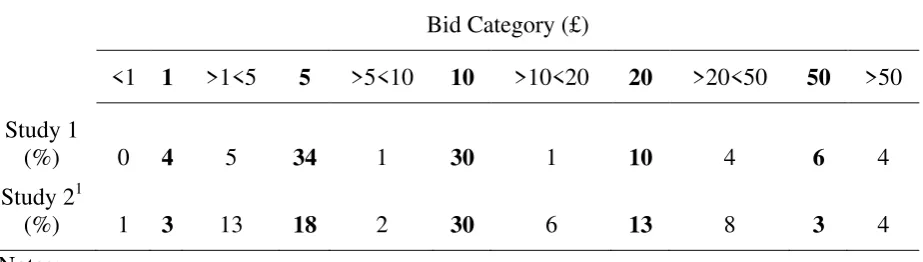
question is: how sensitive are people to the monetary scale? Table 7 displays the percentage
of responses that correspond with a currency value. 84% of the positive bidding participants
in Study 1 offered a contribution that had a corresponding currency value. A χ2 test found that
significantly more participants presented numbers that corresponded to a currency than
expected by chance, χ2 (1)=96.04, p<0.001. Furthermore, 64% provided a £5 or £10 estimate.
A χ2 test found that significantly more participants offered a £5 or £10 than any other
numerical option on the continuous money scale, χ2 (1)=14.61, p<0.001.
In Study 2 a total of 67% of the positive bidding sample offered a currency based
WTP estimate. A χ2 test found that significantly more participants used currency based
numbers compared to any other numerical option, χ2 (1)=38.96, p<0.001. In this case 48%
difference in the number of participants providing a £5 or £10 than any other positive bid
[image:20.595.73.535.171.302.2]number, χ2 (1)=0.45, p>0.05.
TABLE 7
Responses Relative to Currency Denominations
Bid Category (£)
<1 1 >1<5 5 >5<10 10 >10<20 20 >20<50 50 >50
Study 1
(%) 0 4 5 34 1 30 1 10 4 6 4
Study 21
(%) 1 3 13 18 2 30 6 13 8 3 4
Notes:
1 Adds to 101 due to rounding error
V. DISCUSSION AND CONCLUSIONS
We believe that the methodological designs of the studies reported here are more appropriate
to examining the attitudinal hypothesis than the headline method. Standard CVM design was
employed in these studies which were applied to positive environmental change scenarios.
The surveys investigated two different topics (converting farmland to a wetland and
increasing in-stream flows from hydro dam regulation) and had two different payment
mechanisms (a single individual contribution and an increase in electricity bills). These
studies were also administered to different populations. That consistent patterns were found
across two very different studies also adds to the robustness of the results.
The results partially support the attitudinal hypothesis. Notably there was a strong
relationship between attitude scales and the type of bid offered (positive or zero bid).
However non-attitudinal variables from the TPB were also administered. The significant of
these non-attitudinal variables suggests that the choice between offering a zero or positive bid
represents a more general psychological evaluation than being just an expression of attitude.
reliance upon a concept, namely attitudes, which has a considerably broader range of
application than the standard concept of economic preferences. However, conceptualising
WTP as an attitudinal measure appears an inadequate explanation. Other non-attitudinal
psychological variables appear to enhance prediction of whether a zero or positive WTP is
offered. As all general psychological evaluations are presumed to be constructed, this would
still suggest that respondents’ choice of WTP bid will be heavily influenced by contextual
effects which are not the result of defective methodological procedures.
The weak or insignificant relationship between attitudinal scales and the amount
offered by positive bidders suggests that the money scale is not a sensitive measure of
attitudes, supporting the argument by Kahneman and colleagues that this is a
psychometrically inferior measure. Although the money scale is technically a continuous
variable bounded by a zero, the majority of positive bidding participants in both CVM studies
offered a standard currency amount, which suggests they were treating the open-ended
money scale as a categorical scale rather than a continuous scale. The finding that a large
portion of participants offered either £5 or £10 is incompatible with the suggestion that the
absence of a guiding modulus, attached to the money scale, leads to large arbitrary
individualistic interpretations. If responses to the monetary scale are insensitive then
economists should question the ability of respondents to be able to perform an economic
trade-off to the point of indifference. The large portion of standardised bids suggests that the
money scale is too blunt a measure to account for variance in the welfare benefits of an
environmental proposal. This finding does, however, provide strong support for the main
substantive hypothesis of Kahneman and colleagues that WTP respondents are offering a
standardised bid compatible with a general contribution.
While the majority of positive bidders demonstrated an extreme lack of sensitivity, a
more sensitive as they did not reflect a standard currency amount. These participants may be
offering WTP bids based on economic rather than contributory motives. That is, the
contribution model may validly describe the behaviour of some CVM participants, while the
economic purchase model may validly describe the behaviour of other participants. This
suggests fundamental individual differences in how participants respond to the money scale.
Understanding more about the strengths and limitations of WTP scales can help guide
decision makers in how to assess community perceptions regarding social proposals. There
are a number of practical implications of the current study. First, the findings are consistent
with many people struggling to convert their environmental values into a monetary amount.
Thus money appears to be a poor scale for summarising environmental values. Second, as
the choice of a WTP bid is based on a general psychological appraisal, rather than just an
attitudinal assessment, using a procedure to obtain a monetary value from attitudinal scales,
as proposed by Kahneman and colleagues, seems inappropriate. Such an approach ignores
non-attitudinal factors. Converting attitude scores to a money amount based on a
standardised procedure would be as blunt an approach to economic valuation as the current
CVM approach. Understanding how people perceive social and environmental changes
involves more than can be obtained from an attitude scale or a CVM money scale. Thus,
interdisciplinary research on economics and psychology reveals that neither discipline alone
has the ability to offer a full picture of human behaviour in the context of environmental
valuation. This suggests looking to methodologies able to provide a broader context and
meaning to environmental values (e.g., non-aggregated social multi-criteria analysis or forms
of deliberative monetary valuation). The approaches needed must supply a more
descriptively rich summary of how a community perceives an environmental proposal than
the approaches so far on offer which rely upon aggregating attitudinal scores or intentions to
References
Ajzen, I. 1991. "The Theory of Planned Behavior." Organizational Behavior and Human Decision Making Processes. 50 (2): 179-211.
Ajzen, I. 2001. "Nature and Operations of Attitudes." Annual Review of Psychology. 52
27-58.
Ajzen, I. 2006. "Constructing a Tpb Questionnaire: Conceptual and Methodological
Considerations." http://people.umass.edu/aizen/pdf/tpb.measurement.pdf. Accessed 6th June 2009.
Andreoni, J. 1989. "Giving with Impure Altruism: Application to Charity and Ricardian Equivalence." Journal of Political Economy. 97 (6): 1447-58.
Arrow, K., R. Solow, P. Portney, R.,, E. Leamer, R. Radner and H. Schuman. 1993. "Report of the Noaa Panel on Contingent Valuation."
Bateman, I. J., R. T. Carson, B. Day, M. Hanemann, N. Hanley, T. Hett, M. Jones-Lee, G. Loomes, S. Mourato, E. Ozdemiroglu, D. W. Pearce, R. Sugden and J. Swanson. 2002. Economic Valuation with Stated Preference Techniques: A Manual.
Cheltenham, UK: Edward Elgar.
Eagly, A. H. and S. Chaiken. 1993. The Psychology of Attitudes. Fort Worth, Tx: Harcourt
Brace.
Eagly, A. H. and S. Chaiken. 2007. "The Advantages of an Inclusive Definition of Attitude."
Social Cognition. 25 (5): 582-602.
Fischhoff, B. 1991. "Value Elicitation: Is Anything There?" American Psychologist. 46 (8):
835-47.
Hertwig, R., U. Hoffrage and L. Martignon. 1999. "Quick Estimation: Letting the Environment Do the Work." In Simple Heuristics That Make Us Smart, ed. G.
Gigerenzer, P.M. Todd and ABC Research Group, 209-34. New York: Oxford University Press
Kahneman, D. and J. L. Knetsch. 1992. "Valuing Public Goods: The Purchase of Moral Satisfaction." Journal of Environmental Economics and Management. 22 (1): 57-70.
Kahneman, D. and I. Ritov. 1994. "Determinants of Stated Willingness to Pay for Public Goods: A Study in the Headline Method." Journal of Risk and Uncertainty. 9 (1):
5-38.
Kahneman, D., I. Ritov, K. Jacowitz and P. Grant. 1993. "Stated Willingness to Pay for Public Goods: A Psychological Perspective." Psychological Science. 4 (5): 310-15.
Kahneman, D., I. Ritov and D. Schkade. 1999. "Economic Preference or Attitude
Expression?: An Analysis of Dollar Responses to Public Issues." Journal of Risk and Uncertainty. 19 (1-3): 203-36.
Kahneman, D., D. Schkade and C. Sunstein. 1998. "Shared Outrage and Erratic Awards: The Psychology of Punitive Damages." Journal of Risk and Uncertainty. 16 (1): 49-86.
McFadden, D. and G. Leonard. 1992. "Issues in the Contingent Valuation of Environmental Goods: Methodologies for Data Collection and Analysis." In Contingent Valuation: A Critical Assessment, ed. J. A. Hausman, 165-208. Amsterdam: Elsevier Science
Publisher
Mitchell, R. C. and R. T. Carson. 1989. Using Surveys to Value Public Goods: The Contingent Valuation Method. Washington, DC: Resources for the future.
Monin, B. and D. A. Oppenheimer. 2005. "Correlated Averages Vs Averaged Correlations: Demonstrating the Warm Glow Heuristic Beyond Aggregation." Social Cognition. 23
Nickerson, C. A. E. 1995. "Does Willingness to Pay Reflect the Purchase of Moral Satisfaction? A Reconsideration of Kahneman and Knetsch." Journal of Environmental Economics and Management. 28 (1): 126-33.
Payne, J. W., J. R. Bettman and D. Schkade. 1999. "Measuring Constructed Preferences: Towards a Building Code." Journal of Risk and Uncertainty. 19 (1-3): 243-70.
Ryan, A. and C. L. Spash. 2008. Measuring “Awareness of Environmental Consequences”: Two Scales and Two Interpretations. Socio-Economics and the Environment in
Discussion CSIRO Working Paper Series 2008-10.
Schwarz, N. 2007. "Attitude Construction: Evaluation in Context." Social Cognition. 25 (5):
638-56.
Schwarz, N. and G. Bohner. 2001. "The Construction of Attitudes." In Blackwell Handbook of Social Psychology: Intraindividual Processes, ed. A. Tesser and N. Schwarz,
436-57. Malden, MA: Blackwell
Smith, V. K. 1994. "Lightening Rods, Dart Boards, and Contingent Valuation." Natural Resources Journal. 34 (1): 121-52.
Spash, C. L. 2000. "Ethical Motives and Charitable Contributions in Contingent Valuation: Empirical Evidence from Social Psychology and Economics." Environmental Values.
9 (4): 453-79.
Spash, C. L. 2006. "Non-Economic Motivation for Contingent Values: Rights and Attitudinal Beliefs in the Willingness to Pay for Environmental Improvements." Land
Economics. 82 (4): 602-22.
Stern, P. C., T. Dietz and L. Kalof. 1993. "Value Orientation, Gender, and Environmental Concern." Environment and Behavior. 25 (3): 322-48.
Whynes, D. K., E. J. Frew, Z. N. Philips, J. Covey and R. D. Smith. 2007. "On the Numerical Forms of Contingent Valuation Responses." Journal of Economic Psychology. 28 (4):
462-76.
Whynes, D. K., Z. Philips, N., and E. J. Frew. 2005. "Think of a Number...Any Number?" Health Economics. 14 (11): 1191-95.
APPENDICES
PA Scale
Item 1: I would participate in a demonstration against companies that are harming the environment
Item 3: I would sign a petition in support of tougher environmental laws
Item 4: I would take a job with a company I knew was harming the environment Item 5: I would never do voluntary work for nature conservation
Item 6: Environmental activists are a public nuisance whom I would never support
BBEP Scale
Item 1: Environmental protection will provide a better world for me and my children Item 2: Environmental protection is beneficial to my health
Item 3: A clean environment provides me with better opportunities for recreation Item 4: Environmental protection benefits everyone
Item 5: Environmental protection will help people have a better quality of life Item 6: Tropical rain forests are essential to maintain a healthy planet earth Item 7: The effect of pollution on public health are worse than we realise Item 8: Pollution generated here harms people all over the earth
Item 9: Over the next several decades, thousands of species will become extinct
1a. Paying more for electricity to restore biodiversity will increase the diversity and abundance of plant and animal species in the Tummel area (1 = extremely likely; 7 = extremely unlikely).
1b. Increasing the diversity and abundance of plant and animal species in the Tummel area is (1 = extremely bad; 7 = extremely good).
2a. Paying more for electricity to restore biodiversity will increase genetic diversity in the Tummel area (1 = extremely likely; 7 = extremely unlikely).
2b. Restoring genetic diversity in the Tummel area is (1 = extremely bad; 7 = extremely good).
3a. Paying more for electricity to restore biodiversity will increase river flows in the Tummel area (1 = extremely likely; 7 = extremely unlikely).
3b. Increasing river flows in the Tummel area is (1 = extremely bad; 7 = extremely good). 4a. Paying more for electricity to restore biodiversity will help restore the web of life in
the Tummel area (1 = extremely likely; 7 = extremely unlikely).
4b. Restoring the web of life in the Tummel area is (1 = extremely bad; 7 = extremely good).
5a. Paying more for electricity to restore biodiversity will enhance water quality in the Tummel area (1 = extremely likely; 7 = extremely unlikely).
5b. Enhancing water quality in the Tummel area is (1 = extremely bad; 7 = extremely good).
6a. Paying more for electricity to restore biodiversity will teach people to think more about the environmental impacts of industry (1 = extremely likely; 7 = extremely unlikely).
6b. Teaching people to think more about the environmental impact of industry is (1 = extremely bad; 7 = extremely good).
7a. Paying more for electricity to preserve biodiversity will restore the Tummel area to its natural state (1 = extremely likely; 7 = extremely unlikely).
7b. Restoring the Tummel area to its natural state is (1 = extremely bad; 7 = extremely good).
TPB Subjective Norm Scale
1a. My spouse/partner would think that I (1 = should; 7 = should not) pay more for electricity to preserve biodiversity in the Tummel area.
1b Generally speaking, how much do you want to do what your spouse/partner thinks you should do?
2a. My work colleagues would think that I (1 = should; 7 = should not) pay more for electricity to preserve biodiversity in the Tummel area.
2b Generally speaking, how much do you want to do what your work colleagues think you should do?
3a My children would think that I (1 = should; 7 = should not) pay more for electricity to preserve biodiversity in the Tummel area.
3b Generally speaking, how much do you want to do what your children think you should do?
4a My parents would think that I (1 = should; 7 = should not) pay more for electricity to preserve biodiversity in the Tummel area.
4b Generally speaking, how much do you want to do what your parents think you should do?
5a My friends would think that I (1 = should; 7 = should not) pay more for electricity to preserve biodiversity in the Tummel area.