Munich Personal RePEc Archive
University quality, interregional brain
drain and spatial inequality. The case of
Italy.
Ciriaci, Daria
European Commission - JRC IPTS
6 December 2009
UNIVERSITY QUALITY
,
INTERREGIONAL BRAIN DRAIN AND SPATIAL INEQUALITY.
T
HE CASE OFI
TALY.
Daria Ciriaci1
MARCH 2011
Abstract:
Universities are increasingly recognized as key driver of economic development through their role in knowledge production and human capital accumulation, and as attraction poles for talents. That is why this paper analyses the sequential migration behaviour of Italian students-graduates before their enrolment at university, and after graduation, and the role that university quality has in these choices. From a regional development perspective, a better understanding of the causes of Italian interregional brain drain may help to guide policy intervention aimed at reversing or partially compensating for its negative effects on the source regions. The results confirm ‘university quality’ as a «supply» tool for policy makers to counterbalance the negative effects of the brain drain on human capital accumulation.
JEL classification: R23; R58; J 24; J 61
Keywords: Brain-drain, labour mobility, university quality, regional economic disparities.
INTRODUCTION
Universities have come under increasing pressure to become key drivers of economic
development in the age of the knowledge economy (European Commission, 2010). Recent
research on their regional impacts pointed to three kinds of contributions made by these
institutions to their host regions: a direct economic impact, an indirect service provision, and
the quality upgrading of local economies and political systems (Benneworth et al., 2010).
From a demand point of view, their economic impact is mainly due to student spending power
which supports the local economy (Armstrong, 1993; Harris, 1997). From a supply side point
1
of view, since knowledge ultimately rests within individuals (Boschma et al., 2009) the
outcome of their decision about where to study and work contributes to the process of
regional human capital accumulation (Becker, 1964; Mixon and Hsing, 1994a) and
knowledge creation (and its externalities), which are fundamental for regional growth and
competitiveness (Lucas, 1988). Beside this knowledge transfer/creation argument (Faggian
and McCann, 2009), graduates’ mobility (and more in general labour mobility) also enables
regional structural change that is crucial for long-term growth (Boschma et al., 2009).
Therefore, better higher education facilities and institutions might enhance - ceteris paribus -
regional attractiveness and play a role in the decision of students and graduates to migrate
(Niedomysl, 2006; Baryla and Dotterweich, 2001). This argument may hold especially for
countries, such as Italy, characterized by persistent and significant regional per capita income
and labour market divergences (Ciriaci and Palma, 2008; Saraceno, 1983; Graziani, 1978),
and by low inter-generational mobility both in terms of educational level and employment
opportunities (Checchi, Ichino Rustichino, 1999), and where migration towards wealthier
regions makes the possibility of improving the standard of living more realistic. This in turn
might stimulate the accumulation of human capital not only in wealthier regions - which
attract new human capital -, but also in less industrialized regions as the possibility of
migration might foster local universities enrolments (Mountford, 1997).
So far, however, Italian empirical evidence suggested something different. Instead of acting
as an equilibrating mechanism, Italian interregional migration flows appear to enhance
existent cumulative economic processes (Fratesi and Percoco, 2009; Marinelli, 2010; Ciriaci,
provinces to richer Central Northern ones2. Furthermore, over the last decade both return
migration and university enrolments in Southern regions have decreased (SVIMEZ, 2009;
Ciriaci, 2005), rather than increased. Therefore, Italian human capital tends to accumulate in
wealthier Centre-North regions, which offer better employment opportunities than their
Southern counterparts.
Though the debate on the economic consequences of these flows is still an open one, the
literature shares the idea that the greater is the net inflow of newly-acquired human capital,
the greater are the specifically local regional returns to national higher educational policies
(Faggian and McCann, 2008; Bennet et al., 1995). Generally speaking, however, it is not
guaranteed that all types of knowledge inflows (or outflows) have necessarily a positive
(negative) effect on regional economic development (Boschma and Iammarino, 2009).
Following Boschma et al. (2009)3 and Boschma and Iammarino (2009), it can be argued that
the process of skilled mobility cannot be easily separated into a simple dichotomy of gain and
drain4 as labour mobility crossing regional boundaries is not necessarily good or bad for
2
In this paper Central-Northern provinces include those of Lazio, Tuscany, Umbria, Marche, Emilia-Romagna, Liguria, Valle d’Aosta, Piedmont, Lombardy, Trentino A.A., Friuli Venezia-Giulia, Veneto and Southern (or Mezzogiorno) provinces include those of Campania, Abruzzi, Molise, Puglia, Basilicata, Calabria, Sicily and Sardinia.
3
Boschma et al. (2009) analyzing the impact of skills portfolio and labour mobility on plant performance for the Swedish economy, found that labour mobility across regions has a positive impact on plants’ productivity growth only when this concerns new employees with related competences (but non similar to the existing knowledge base of the plant). They argue that the inflow of new skills in the region might contribute to avoid a lock-in problem, which “with labour inflow of skills that are already present in the plant, will only get worse when the new employees are recruited from the same region” (Boschma et al., 2009, p. 171). Similarly, investigating the effects of different types of trade linkages on regional growth in Italy, Boschma and Iammarino (2009) found out that when extra-region knowledge originated from sectors a region was already specialized in, it did not positively impact on regional growth as it did not add anything new to the existing base of the region.
4
regional competitiveness (Boschma et al., 2009; Boschma and Iammarino, 2009). The
positive or negative “competitiveness outcome” will depend on the extent to which these
inflows (outflow) of skills are complementary (or not) to existing competences in the region
of destination. Anyway, in the context of innovation studies there is evidence supporting the
potential knowledge transfer of human capital mobility (Faggian and McCann, 2009; Power
and Lundmark, 2004; Breschi and Lissoni, 2003)5, although there is no obvious dominant
causality between skilled labour migration and regional innovation (Faggian and McCann,
2009). There is also a body of empirical evidence showing that scientific excellence has
positive effects on local economic development processes, technology transfer, and firms’
innovation activity (Geuna and Muscio, 2009). Sterlacchini (2008) has shown that the recent
economic growth of the EU regions has been positively and significantly affected by their
knowledge base captured by the intensity of R&D expenditures and the share of adults with
tertiary education, although this effect was lower in the case of European southern regions. As
far as Italy is concerned, Fratesi and Percoco (2009) found out that over the period
1980-2001, the loss of human capital due to skilled migration outflows has been detrimental for
growth in the regions of origins.
With these considerations in mind, the purpose of this paper is to analyze the sequential
migration behaviour of Italian students-graduates before their enrolment at university, and
after graduation, and the role that university quality has in these choices. In both migration
cases, the analysis is carried out for graduates as a whole, namely it includes both migrants
and not migrants. Their migration choices may be influenced by university quality in two
graduates from other regions (Faggian and McCann, 2008). I am grateful to an anonymous referee for such a comment.
5
different ways: it may act as a “pull” factor when a student decides where to study - a student
may decide to migrate to study to look for a better university - and as a “signal” to firms when
the former student decides where to live after graduation. In the Italian case, for instance,
previous findings (Ciriaci and Muscio, 2010; Zinovyeva and Sylos Labini, 2008) suggests
that graduating from a better university significantly increases the probability to find a job in
the same region of the university. Therefore, the probability that after graduation the
individual will face the necessity to migrate to find a job will be lower. Furthermore, Di
Pietro and Cutillo (2006) found out that Italian graduates who graduated from
research-oriented universities are likely to achieve better labour-market outcomes than their peers who
graduated from a less research-active institution.
To analyze students’ ante and post lauream migration choices, I use data from the last survey
by the Italian National Statistics Institute (ISTAT) of labour market entry conditions three
years after graduation (2007) for Italians who finished their degrees in 2004. This database
has been matched using the university attended by the individual as merging variable with the
results of the national evaluation of Italian universities’ quality carried out by the CIVR
(Committee for Evaluation of Research, Italian Ministry of University and Research, 2007) in
2005. This evaluation covered the research activities conducted in the 2001-03, therefore
when the students/graduates interviewed by ISTAT were attending university. To my
knowledge, this is the first work which use this source - which at the moment is the only
official ministerial source of evaluation of academic institutions and are used by the Italian
government to assign financial resources to universities - to elaborate two indexes, one to
proxy research quality, and the other to proxy teaching quality, and using them to analyze
Italian students/graduates migration choices. If empirical evidence were to support the
students, and reducing their outflow), university quality would emerge as an additional policy
instrument to be used to enhance regional capabilities in attracting skilled and “learned”
people (Persons, 2004) and acting as nodes within a national system of student-graduate
mobility (Faggian and McCann, 2009).
Following the literature on migration modelling (Faggian and McCann, 2009; Hansen and
Niedomysl, 2009; Faggian et al., 2007; DaVanzo, 1976, 1983; Greenwood, 1972; Tuckman,
1970; Sjaastad, 1962) the individual migration choice is modelled controlling for individual
characteristics, field of study, wage differentials (Kwok and Leland, 1982), and of a number
of ‘push and pull’ socio-economic factors accounting for the relative attractiveness of the
potential destination in comparison to the origin location (Mixon and Hisng, 1994b). As there
is a large body of research that suggest that these two migration waves are partly
interdependent, namely the decision about whether to move to study or not influences
subsequent migration behaviour (Bacci et al., 2008; Faggian et al., 2007a; DaVanzo, 1976
and 1983), a system of two structural structural equations has been estimated in which the
first equation models the decision to move to study and is used to obtain the linear prediction
of the probability to move to study which enters the second equation - which explains the
decision to move after graduation - as latent variable.
The paper is organized as follows. Section 2 describes the datasets used, the empirical
framework, and the methodology. Section 3 discusses the results and their the empirical
relevance, while section 4 concludes and discusses the policy implications of the analysis.
2.EMPIRICAL ANALYSIS
The overarching aim of this article is to study the migration choices of Italian
students/graduates, focusing on if (and how) university quality affects them. The student
information used comes from the last survey administered by the Italian National Institute of
Statistics (ISTAT) on Italian graduate labour market entry conditions. This survey was
conducted in 2007 on a cohort of students who graduated in 2004 and comprised a total of
about 47,340 degree holders, interviewed by Computer-Assisted-Telephone-Interview
(CATI), with a response rate of 69.5%. The sample is stratified and derived by dividing the
population by sex, attended university and field of study (see ISTAT, 2009) and represents
17.3% of the cohort of 2004 Italian graduates (260,070 individuals). The respondents attended
university courses in 16 different scientific disciplines in 67 private and public universities.
ISTAT attributed to each individual in the sample a weight - the carry-over coefficient -,
namely the number of units of the population of the original universe represented by
individual i himself/herself. The ISTAT survey collects information on previous educational
attainment, degree results, employment status, and parents’ socio-economic status, as well as
a range of personal characteristics. Furthermore, the Italian National Institute of Statistics
provided me with the province of residence before the enrolment at the university, the
province of the university attended, and the province of residence three years after graduation
(in 2007). This information is then used to determine whether the individual has or has not
moved away to study or to look for a job, and to classify the sequential migration choices (see
next section).
The ISTAT database on the labour market entry conditions for 2004 Italian graduates was
matched with university-level data on Italian university quality using the university attended
as the merging variable. The information on the quality of the higher education sector in Italy
research activity (VTR), which has been conducted in 2005 by the Committee for Evaluation
of Research (CIVR) on the behalf Italian Government. This evaluation covered all the
research activities conducted in the period 2001-03 (MIUR, 2007) and was carried out at the
centralised level of the academic institution. To join it, each institution had to declare the
annual average number of full time equivalent (FTE) researchers over the period 2001-03.
Based on this FTE researcher number, each institution declared the number of products which
had to be evaluated by the CIVR. The VTR rates and ranks university research performance,
assessing a certain number of research outputs (journal articles, books, book chapters, patents,
art craft etc.) defined on the basis of university size (small universities: up to 10,000 students;
medium universities: 10,000 to 15,000 students; large universities: 15,000 to 40,000 students;
mega universities: over 40,000 students).6 Each research output is rated on the basis of a peer
review evaluation (excellent=1.0, good=0.8, acceptable=0.6, poor=0.2, not classifiable=0).
The weighted sum of the ratings divided by the number of products submitted to the
evaluation provides a score – a rating - for each academic institution reviewed. As evaluation
of research performance is conducted by scientific area, I calculated an average ‘university
ranking index’ for each university. Furthermore, the available data, allowed me to proxy the
university quality of teaching with the number of professors per student7.
In terms of local socio-economic characteristics, since the models are estimated with
individual students as the unit of observation, the more disaggregated resolution available –
(for which all data are consistent) was used. Therefore, the database on Italian
students-graduates was matched with NUTS-3 regional level data on quality of life (QoL) and standard
6
In the sample 36.3% of graduates attended a mega university, 48.0% attended a large university, 7.7% attended a medium university and 8.0% were enrolled at a small university. Enrolment of over 50% of the students interviewed by ISTAT was split across 15 university institutions.
7
of living (SoL) carried out each year by the Italian financial newspaper Il Sole 24ore to
account for “push and pull” regional factors8 (Niedomysl, 2006). In fact, several scholars (see
for instance Florida, 2002) have pointed out that young high skilled are attracted not only by
economically buoyant areas, but by the availability of cultural amenities too (Di Pietro, 2005).
The composite indicator of quality of life (QoL) is an arithmetic mean of 36 individual
indicators split into six groups: life standards (bank deposits, average monthly pension,
inflation index, gross domestic product, house price, average consumption per inhabitant), job
& business (defaulting firms, new economy firms on 100 inhabitants, new/dead enterprises,
per inhabitant protests, persons in search of a job on labour force, % employed aged 25-34),
environment & health (infrastructure index, road accidents, climate, school dispersion index,
quality of environment index, civil action speed), public order (car thefts on 100,000
inhabitants, thefts at home on 100,000 inhabitants, denounced minors on 1000 inhabitants,
robberies on 100,000 inhabitants, pocket robberies on 100,000 inhabitants, murder trend),
population (population density, percentage of foreign citizens, percentage of graduates on
1,000 inhabitants aged 25-30, births on 1000 inhabitants, registrations/cancellations, ratio of
population aged 15-29 to population aged 65 and over), and free time (book reading index,
bar and restaurants on 100,000 inhabitants, concerts on 100,000 inhabitants, sporting index,
associations of voluntary service on 1,000 inhabitants, cinemas on 100,000 inhabitants.
The index of standard of living is part of the QoL composite index, however, while in the case
of QoL the higher the value of the index, the higher the quality of life (the index is expressed
in levels), in the case of standard of living, the index gives the position of a province with
respect to others and goes from the best province (ranked 1) to the worst (ranked 103), hence
the higher the number, the lower the standard of living.
8
2.2. THE ECONOMETRIC APPROACH: ANTE AND POST LAUREAM MIGRATION DEFINITION
As already stressed, there are two students-graduates’ migration waves: before the enrolment
at the university, and after graduation. Clearly, the choices of migrating to study and to
live/work after graduation can hardly be considered as independent from each other. As
stressed by DaVanzo (1983), the post-degree choice will be influenced by the mobility choice
made by the student when he/she decided where to study: if the student has chosen to migrate,
the probability of moving residence again will likely be higher than if he/she did not. The
empirical evidence in this study is in line with what suggested by DaVanzo (1983): the
percentage of the Italian graduates who move after graduation is largely higher among those
students who already moved to study: 53.2% of those 2004 graduates who moved to study,
moved also after graduation versus 6.5% of those who did not move to study. These findings
are also supported by those of Bacci et al. (2008) who, analysing the mobility of Italian
graduates who completed their studies over the period 2000-02, found a strong association
between mobility flows for study and occupational reasons. This tendency towards mobility
for occupational reasons tends to decrease with the passing of time, given the tendency, by
some graduates, to go back eventually to their region of origin (Bacci et al., 2008).
Before explaining the methodology used to tackle with this issue, there is another
fundamental aspect that needs to be underlined. In Italy there are persistent disparities in
terms of per capita income and labour market outcomes between Sothern and
Central-Northern provinces (Ciriaci and Palma, 2008; Saraceno, 1983; Graziani, 1978). As clearly
shown by the data, three years after graduation, 65 out of 100 graduates in the southern region
are employed, while in the Central-Northern region the rate of employment is 11 points
higher - 76 out of 100. Furthermore, the empirical evidence also confirms that studying in a
unemployment among southern graduates who studied in a central-northern university is
28.9%, significantly lower than the 35.1% who attended a southern university (SVIMEZ,
2009). Therefore, following previous empirical literature (Ciriaci, 2006 and 2005; Jahnke,
2001), only students-graduates who moved from one province of macro area i to a province in
macro area j (i= 1, 2) are considered ‘migrants’.9 That is to say, I divided Italy in two
macro-regions (Centre-North and South), and I focus on interregional (or “between” macro area)
migration flows, not intraregional ones (van Ommeren et al., 1999). This choice is not only
motivated by the structural differences between the two macro regions, but also by the fact
that focusing on the South – Centre-North flow of human capital limits specification problems
due to commuting. In fact, commuting occurs mainly among the Northern provinces in the
form of a brain exchange and follows different patterns (SVIMEZ, 2009; Ciriaci 2006 and
2005) with respect to the between macro areas migration.
2.3. THE ECONOMETRIC APPROACH: THE MODEL
The modelling approach chosen is constituted by two stages. Firstly, I modelled the student’s
choice of whether to study in his province of origin or to migrate to a province belonging to
the other macro area using a standard migration probability model (AL equation in the system
of equations; Faggian et al., 2007a). Secondly, I modelled the graduate’s choice of whether to
remain in the province of location of the university where he/she graduated from or to migrate
to a province belonging to the other macro region (PL equation in the system of equations)
inserting the predicted value obtained at the first stage (AL*) as explanatory variable,
endogenizing the post-lauream choice with respect to the choice of migration to study.
Therefore the reduced form equations are as follows:
9
⎩ ⎨ ⎧ < + + = ≥ + + = = ⎩ ⎨ ⎧ < + = ≥ + = = 0 * * 0 0 * * * 0 * 0 0 * * PL PL PL PL PL PL PL PL AL AL AL AL AL AL z AL PL if z AL PL if PL PL z AL if z AL if AL AL ε β β ε β β ε β ε β
Where εAL, and εPL are normally distributed error terms with zero mean and respectively,
σAL, σPL standard deviations, and zAL and zPL are vectors of exogenous variables. Therefore,
the first equation describes the choice about whether or not to migrate in order to study:
ijur
AL takes the value 1 if the student originally resident in province r=1....R decides to enrol
at the university u=1....U located in a province in another macro area with respect to the
macro area of origin, and 0 if he/she does not migrate.10 Namely, it is the likelihood of
studying ‘abroad’, where ‘abroad’ is the other macro area. In the case of post-lauream
migration, the dependent variable is the likelihood of leaving after graduation the province of
origin and study r=1....R (belonging to macro area i) and migrating to a province belonging to
the macro-area j. In this case the dependent variable is the probability of leaving the region of
origin after graduation to move. In both migration cases, the analysis is carried out for
graduates as a whole (i.e. including both movers and stayers).
For the sake of simplicity in the following discussion I group the variable included in zAL and
zPL in three groups: (i) individual characteristics and family background, (ii) regional
characteristics and economic opportunities, and (iii) university quality variables. As within
groups the variables included as explanatory ones might vary according to the individual’s
choices analyzed (AL or PL), in the following I discuss them in details (the name of the
explanatory variables included is reported in brackets in italics).
10
The first group of variables (i) has been included to control for selection bias. As correctly
stated by the literature on self-selection (e.g. Chiswick, 2000; Borjas, 1987; Kwok and
Leland, 1982) certain characteristics/skills may make it more profitable for some individuals
to move and, therefore, they will be self-selected. It follows that the migrant ‘brains’ may not
be representative of a random sample of the source province population, but rather a sample
systematically selected from the relevant distribution. Among these individual characteristics
controls three are common to both equations: (1) student/graduate’s sex (sex), (2) age (age),
and (3) the level of education of the respondent’s father (father’s education). To this three
common variables, in the case of migration after graduation (PL) I added (4) a dummy for
pre-reform graduates (4 year course, see section 3.2); (5) a control for the level of degree
obtained (master level degree), which helps identifying who after graduation moved to
continue studying11, and not to work; (6) graduate’s university performance (degree mark);
(4) a set of 14 degree course dummies accounting for differences in terms of occupational
mobility dues to the field of study (Bacci et al., 2008).
Among the regional characteristics and economic opportunity controls (ii) in the AL equation
there are (1) the average value of the index of quality of life in the destination province over
the period 2001-04 (QoLd), (2) the average standard of living index in the province of origin
(SoLo) over the same period, (3) a control for cross-boarder students’ movements (contig_is),
and (4) the ratio between value added in the destination province and Italian value added
(value added ratio). The standard of living in the province of origin has been included for two
reasons. First of all, it is a proxy accounting for student’s family income (the survey does not
provide it). The higher the family income, the higher the probability the student can afford
11
moving or staying in another macro area. Secondly, it also controls for the level and quality of
information that a student may acquire before choosing where to study. In fact, information
concerning alternative locations is costly and fundamental for migrant's decision to move,
hence students with higher family incomes might be able to afford more (or better)
information (Greenwood, 1972) giving rise to self selection issue. Furthermore, the
probability to migrate could be systematically higher for those students living along the
“boarders” between the two macro areas. Given the fact that the definition of migration used
does not allow to insert a vector of distances between province of origin and destination – this
vector is perfectly collinear with the dependent variables12 - I controlled for cross-border
movements inserting a dummy (contig_is) for those individuals who before the enrolment at
the university where living in contiguous provinces located along the borders between the two
macro areas (Latina, Frosinone, Isernia, Caserta, Aquila, Teramo). Finally, the ratio between
value added in the destination province and Italian value added is inserted (value added ratio)
as a proxy for the attractiveness or economic size (Glaeser, 2008) of a province with respect
to the others.
In the case of migration after graduation (PL equation) among the regional and economic
controls13 there are (1) the average value of the index of quality of life in the destination
province (where the graduate declares to live in 2007; QoLd) over the period 2001-04 (the
migration choice is made from 2004 on), (2) the wage differential between the province of
origin (where the individual was living before university enrolment) and that of destination
(where the graduate declares to live in 2007).
12
To a positive distance between provinces belonging to the same macro area is always associated a zero value of the dependent variable, and to a distance different from zero, but related to provinces belonging to different macro areas is always associated a value of the dependent variable equals to “one”.
13
Since data on skilled labour wages at the geographic level needed are not available, I built a
wage differential based on the survey data.14 In fact, among the variables provided in the
survey, there is the net monthly wage that the employed graduate declares to earn. Clearly, as
using the graduate’s wage was not possible given its endogeneity, I calculated an average
NUTS-3 wage using the province where the graduates work in 2007 as grouping variable and
the carry-over coefficients of the original universe provided by the ISTAT as individual
weights (weight):
103 ... 1 1 1 = ∗ =
∑
∑
= = r weight weight w wage nr i nr i ir i= 1…33,850
where i is the graduate who in 2007 declares him/herself employed. Then, I introduced into
the PL equation a wage gap based on the difference between the weighted average wage in
the province of migration and in the province of origin. Hence:
300 , 47 ... 1 = −
=wage = wage = i
ential
wagediffer i r destination r origin
Finally, the third group of variables includes the proxies for university quality (iii). Among
these variables, two are included in both equations (AL and PL): (1) the ranking of the
university attended by the student (SAS_ratingtot), and the average number of professors per
student (lecturer_per_student). In the case of migration to study (AL), to account for the
quality of university supply in the source region I also included the average ranking
(AVG_ratingtot_o) and the average number of professors per student
(AVG_lecturer_per_student_o) of the universities located in the NUTS2 region to which the
province of origin of the student belongs. Finally, in both equations I control for the
14
dimension of the university (Dimension 1, Dimension 2, and Dimension 3).
Table 2
3.COMMENTS AND RESULTS
Before commenting on the effects of the explanatory variables included in the final model, it
might be useful to stress that several other variables have turned out to be not statistically
significant. Among them there are some individual and family background characteristics of
the graduate, such as secondary school-leaving certificate mark, bachelor final mark with
summa cum laude, and mother’s level of education and profession. Besides, some of the
explanatory variables which were significant at the first stage, turned out to be not significant
in the case of migration after graduation: graduates’ sex and residence in contiguous
provinces. These findings suggest that individuals were already being selected at the first
stage on the base of these characteristics.
Table 2 reports a description of all the variables included in the final system of equations.
Table 3 illustrates the estimation results for migration to study (AL), while table 4 provides
those for migration after graduation (PL). Both tables report coefficients and marginal effects
of the explanatory variables, together with their standard errors. As robustness check, in the
case of AL migration table 3 reports the results of the estimation of three different models,
while in the case of PL migration, table 4 reports results for five different models. In both
cases, the first model is a “control” one, as only the variables accounting for university quality
have been inserted. In the second model, individual characteristics and family background are
added. In the following models, control variables for regional characteristics and economic
study (only in the post-lauream migration model) are added. The number of observations
reported in the tables refers to the survey sample for which all information was available,
though estimate results can be extended to the whole universe of 2004’ Italian graduates
(about 260,000 graduates) as I used the carry-over coefficients of the original universe
(ISTAT, 2009) as individual weights15. As heteroschedasticity is endemic with individual
data, a robust estimator is used. In what follows, results are commented separately for the two
sequential migration choices analyzed.
3.1. ANTELAUREAM MIGRATION CHOICE
Results strongly confirm university research and teaching quality as fundamental explanatory
variables of student’s migration choice. Firstly, the higher the quality of university research
and the number of professors per student (AVG_ratingtot and AVG_prof_per_stud) in the
region (NUTS2) of origin of the student, the lower his/her migration probability. The
corresponding marginal effects indicates that (1) a 1-point increase in the average rating of the
universities located in the region of origin of the student provides a 0.8 point decrease of
his/her probability to migrate to study elsewhere, while (2) a 1-point increase in the average
number of lecturer per student provides a 3 point decrease. At the same time, the probability
the student will migrate is positively affected by the research and teaching quality
(SAS_ratingtot and prof_per_stud) of the University of destination. The corresponding
marginal effects indicate that a 1-point increase in VTR rating provides a 0.7 point increase in
the probability of migrating after graduation. At the same time, a 1-point increase in the
number of lecturers per student decreases the probability of migrating by 1.2 points.
Migration research suggests that the probability of a student-graduate moving between
regions will be positively related to his/her human capital characteristics (Faggian et al.,
15
2007a and 2006; Sjaastad, 1962), as well as to interregional differences in both regional
employment and wage opportunities, and quality of life in the region of destination (Faggian
et al., 2007a; Faggian and McCann, 2006). In line with the findings of these empirical works,
the results reported in Table 3 confirm the role of student’s characteristics and family
background. The probability of migrating to study decreases as student’s age increases (e.g.,
Gross and Paul, 1986; Demet and Tansel, 2009), and is lower for female students. The
slightly lower likelihood of female migration is confirmed by previous empirical evidence on
Italian graduates (Bacci et al., 2008; SVIMEZ, 2009; Ciriaci, 2006 and 2005). These results
however are at odds with recent empirical evidence on the UK (Faggian et al., 2007b), but
this is likely due to country-specific reasons such as the extent to which migration may
partially compensating for gender differences in the ease of accessing labour markets
(Faggian et al., 2007b), or by country differences in returns to migration, and by cultural
reasons.
Father's level of education has an interesting impact on the ante-lauream migration choice:
the higher the level of education attained by the student's father, the higher the incentive to
migrate. In general, this suggests that the family ‘push’ factor is likely due to socio-economic
reasons: the higher the level of father's education, the higher the family income.
TABLE 3
In terms of push and pull variables, the results suggest that the probability that an individual
will migrate is strongly influenced by the quality of life in the destination province (QoLd).
Moreover, the higher the standard of living in the province of origin of the student (SoLo), the
more likely the individual will migrate to the other macro area to study. In other words,
families. Ceteris paribus, the higher the standard of living in the source province, the higher
the probability the family can afford the cost of supporting the student to study ‘abroad’.
Furthermore, as expected giving the role of distance in migration choices, students living in
contiguous provinces, namely along the “boarder” between the two macro area, are more
likely to migrate. The importance of the socio-economic environment is corroborated by the
significance of the ratio between value added in the destination province and Italian value
added. This last variable could be seen as a proxy for the attractiveness or economic size
(Glaeser, 2008) of a province with respect to the others. Hence, the higher the relative value
added of the province where the university is located, the higher the probability the individual
will migrate there.
3.2. POST LAUREAM MIGRATION CHOICE
In line with previous works (Dotti et al., 2010; Bacci et al., 2008; Faggian et al., 2007a;
DaVanzo, 1983 and 1976; DaVanzo and Morrison, 1981; Vanderkamp, 1971), the choice
made at the moment of choosing where to study is highly and positively correlated with
subsequent migration behaviour. Namely Italian graduate’s likelihood to migrate after
graduation is higher if the individual already migrated to study: the latent variable introduced
to consider the ante-lauream choice is positive and significant (see Table 4). Besides, results
confirm the explanatory power of university quality for student’s migration choice: both
research quality (SAS_ratingtot) and teaching quality (Lecturer_per_student) of the university
attended by the graduate are significant and enter the equation with a negative sign. That is to
say, the higher the research quality of the university attended and the quality of teaching, the
lower the probability he/she will leave the province where he/she studied. In line with
2008), these results suggest that university quality act as a signal to firms affecting positively
the probability that the individual finds a job in the province where he/she studied, and
reducing the need to migrate. Di Pietro and Cutillo (2006) found for instance that those Italian
graduates who graduated from more research-oriented universities obtain better results in
terms of employability that those graduated from less research-oriented ones. Clearly, my
results also imply that the relevant migration decision is that made at the moment of deciding
where to study. Students who move away from their province of residence to pursue
university studies in the other macro-area are much more likely to find employment there
(generally in the Centre-North of the country; see Bacci et al., 2008).
If we compare the marginal effects of the university quality variables obtained estimating
model 4 and model 5, we observe quite a significant reduction in the latter. This is due to the
introduction of a control for the economic size/attractiveness of the province where the
student graduated from. Therefore it suggested that the two university quality variables used
were actually picking up some of the variance due to differences in regional characteristics,
which in Italy are strong and persistent. This last point is confirmed also by the fact that if you
graduate from a ‘mega’ or big university (e.g. University of Rome La Sapienza), there is a
higher probability of staying where you studied. In fact, this result might be interpreted as the
sign of an ‘aggregation effect’ (Kanbur and Rapoport, 2005; Venables, 2005) as the biggest
universities (in terms of number of students) are generally located in the biggest and
wealthiest cities, where the opportunities offered to skilled and young graduates are relatively
higher. In any case, the variable SAS ratingtot is strongly significant and negative and the
corresponding marginal effect indicates that a 1-point increase in VTR rating provides a 0.11
point decrease in the probability of migrating after graduation. At the same time, a 1-point
point, an effect that is even larger that of the economic size of the province where the student
graduated.
The individual variables which were found to be highly significant are the degree mark,
student’s age, and being married. The positive selection bias due to the degree mark is in line
with previous empirical findings (Ciriaci, 2005 and 2006; Jahne, 2001) and with those of the
literature on international migration of highly skilled workers (Borjas and Bratsberg, 1996)
which shown that the percentage of migrating graduates is higher among the “best” of them.
This result, however, must be interpreted carefully as the dummy included in the model to
control for those who graduated with a final mark of 110/110 with summa cum laude turned
out to be not significant. At the same time, the sign of coefficient of students’ age might
suggest that (1) a graduate firstly looks for a job where he/she studied, and only after a while
decides to migrate to look for a job somewhere else, and/or (2) an older graduate - who
needed a longer than average period to graduate finds – found it more difficult to obtain a job.
As a whole, the likelihood of mobility tends to increase linearly over the years: Bacci et al.
(2008) found that with each additional year after graduation the probability to migrate of
Italian graduates increases by 12%. Therefore, what the results suggest is not that the best
students are more likely to migrate, but that a higher degree mark works as a signal to firms:
the likelihood of migrating after graduation, and after having spent time looking for a job in
the province where the university is located, just increases with the degree mark.
In relation to university background, students who graduated after a first degree course are
less likely to migrate at the conclusion of their studies. This result might be due to the effect
of ‘Bologna process’ which has changed the Italian degree structure. In fact, from 2000 on
Italian universities changed from offering a four year module to a 3+2 model, hence
graduated from a first degree course as they enrolled at the latest most in 1999 (although some
Italian universities have yet to introduce the reform). Therefore, ceteris paribus, students
graduating from a first degree course in our study are likely to be younger and to have
graduated in a shorter time than those who finished a four year course, resulting in smaller
incentive to move and a better change of finding a job in their province of origin. Moreover, it
is likely that students graduating from a three year course will prefer to continue to study
(+2), rather than moving somewhere else to start working. In terms of family background,
while mother’s profession and qualifications are not significant, if the student’s father is an
entrepreneur the probability that the graduate will migrate after graduation is higher,
confirming the scarce social mobility that characterizes Italian society (Censis, 2006).
In line with the theoretical and previous empirical evidence, the wage gap between province
of destination and province of origin is significant and enters the equation with the expected
sign: the higher the wage gap, the higher the probability a graduate will choose to migrate
after graduation. Furthermore, the quality of life in the province of destination positively
influences the probability of migration.
TABLE 4
4.CONCLUSIONS AND POLICY IMPLICATIONS
The empirical evidence in this study suggests that the quality of universities’ research
activities and of teaching are fundamental explanatory variables in the migration choice of the
most young and skilled part of Italian labour force. Obviously, enhancing university quality is
source regions. Wage differentials, geographical differences in young labour force
‘employability’, differences in quality of life and, more generally, in the social and economic
environment in the host and source provinces, are all important determinants of migration
choices.
The reported findings also suggest that the most relevant migration decision for
regional human capital accumulation is that made at the moment of choosing the university
where to study, as students tend, after graduation, to stay and work where their completed
their education (generally in the Centre-North of the country). For instance, about one quarter
of those students who, before the enrolment at the university were resident in South Italy
enrol in a Centre-Northern university and, after graduation, only one third of them returns
“home”, while the remaining two thirds remain in the Centre-North. As clearly shown by the
data, the higher the quality of the university supply in the region to which the province of
origin of the student belongs the lower the probability he/she will choose to migrate to study
in the other macro-area. That is to say, if the student can choose a “good” university close to
his province of origin, he/she will remain there. Similarly, the higher the quality of the
university a student graduated from, the lower the probability he/she will move after
graduation. These findings imply that, ceteris paribus, investing in the quality of university
supply may contribute to “keep” young skilled students and graduates in loco. Given the fact
that Southern graduates are those more likely to move to study and to work to Centre-North
Italy, investing in the quality of Southern universities may contribute to enhance South Italy
attractiveness and a brain exchange among the two Italian macro areas, bearing in mind the
potential impact of Italian interregional labour mobility on local growth (Fratesi and Percoco,
2009).
through the design of measures aimed at increasing skilled workers’ «employability» and
attracting students and return migrants. Systemic interventions are needed first to stimulate
demand for skilled labour through proper fiscal policy measures, second to favour a stronger
interaction between universities and firms within the «space». The task will not be easy and
will take time. Many of the benefits for source regions, in fact, can only be realized in the
longer term and require investment in science and technology infrastructure and the
development of opportunities for young skilled workers. As stressed in the literature on
national and international brain drain, developing centres of excellence for scientific research
and framing the conditions for innovation and high tech entrepreneurship can make a region
attractive to both home and foreign young students. Such policies embrace promotion of
entrepreneurship, training and education, mechanisms influencing the allocation of capital,
public research and its links with business. There is the need, in source regions, to develop an
adequate technological, scientific and business environment that will provide satisfying
opportunities for returning individuals who have upgraded their skills abroad and/or serve to
persuade these skilled people to remain in their home regions. High quality universities in
peripheral regions, such as Southern ones in Italy, would help to produce highly qualified and
young labour force as well as new knowledge to be used and adapted by local firms.
Bibliography
Armstrong, H.W. (1993), ‘The Local Income and Employment Impact of Lancaster University’, Urban Studies, n. 10, pp. 1653–1668.
Bacci, S., Chiandotto B., Di Francia A., Ghiselli S. (2008), ‘Graduates job mobility: a longitudinal analysis’, Statistica, n. 3-4.
Baryla E.A., Dotterweich D. (2001), ‘Student migration: do significant factors vary by region?’, Education economics, vol. 9, n. 3.
Bennewort, P. S., Charles, D. R. & Madnipour, A. (2010) ‘Universities as agents of urban change in the global knowledge economy’ European Planning Studies (forthcoming).
Borjas, G.J. (1987), ‘Self-Selection and the Earnings of Immigrants’ American Economic Review, vol. 77, n. 4, pp. 531-553.
Boschma, R., Eriksson, Lindgren U. (2009) ‘How does labour mobility affect the performance of plants? The importance of relatedness and geographical proximity’Journal of Economic Geography , n. 9, pp. 169–190.
Brunello, G., L. Cappellari (2007), ‘The Labour Market Effects of Alma Mater: evidence from Italy’, Marco Fanno Working Papers 0040, Dipartimento di Scienze Economiche ‘Marco Fanno’.
Censis (2006), Meno mobilità, più ceti, più classi, Roma.
Chiswick, B. R (2000) ‘Are Immigrants Positively Self-Selected? An Economic Analysis’
IZA Discussion Paper n. 131,IZA Bonn.
Ciriaci, D. (2005) ‘La fuga del capitale umano qualificato dal Mezzogiorno: un catching-up
sempre più difficile’, Rivista Economica del Mezzogiorno, n. 2.
Ciriaci, D. (2006), ‘Opportunità di occupazione, soddisfazione e fuga dei laureati meridionali’, La Questione Agraria, n. 4, pp. 55-82.
Ciriaci, D., Muscio A. (2009), ‘University Quality as a determinant of Italian Graduates’ Labour Market Performance’,mimeo.
DaVanzo, J., (1976), ‘Differences between return and nonreturn migration: an econometric analysis’, International Migration Review, vol. 10, pp. 13-27.
DaVanzo, J., (1983), ‘Repeat migration in the United states: who moves back and who moves on?’, Review of Economics and Statistics, vol. 65, pp. 85-101.
DaVanzo, J., Morrison, P. A. (1981), “Return and other consequences of migration in the US, 18, pp. 85-101.
Dotti, N.F., Fratesi, U., Lenzi C., Percoco M. (2010), ‘Local labour markets and the interregional mobility of Italian university students’, working paper.
Eliasson, K., U. Lindegren, O. Westerlund (2003), ‘Geographical labour mobility: migration or commuting?’, Regional Studies, vol. 37, pp. 827-837.
European Commission (2010), ‘Europe 2020 A strategy for smart, sustainable and inclusive growth’, Brussels.
Faggian A. and McCann P. (2009), ‘Universities, Agglomerations and Graduate Human Capital Mobility’, Journal of Economic and Social Geography (TESG), vol. 100, n. 2, pp. 210-223.
Faggian A. and McCann P. (2009), ‘Human capital, graduate migration and innovation in British Regions’, Cambridge Journal of Economics, vol. 33, pp. 317-333.
Faggian A., McCann P. and Sheppard S. (2007b) ' Some evidence that woman are more mobile than men: gender differences in UK graduate migration behaviour, n. 3, pp. 517-539. Fratesi U. and Percoco M. (2009), ‘Selective migration and regional growth: evidence from Italy’, Bocconi working paper.
Glaeser, E. L., (2008), Cities, Agglomeration and Spatial Equilibrium, Oxford, Oxford University Press.
Greenwood, M.J. (1972), ‘The Geographic Mobility of College Graduates, The Journal of Human Resources, vol. 8, n. 4, 506-515.
Güngör N.D. and A. Tansel (2009), ‘Brain Drain from Turkey: an investigation of students’ return intentions, Applied Economics, vol. 40, pp 3069-3087.
Hansen H.K., Niedomysl T. (2009), ‘Migration of the creative class: evidence from Sweden’,
Journal of Economic Geography, vol. 9, pp. 191-206.
Harris, R.I.D. (1997), ‘The Impact of the University of Portsmouth on the Local Economy’,
Urban Studies, vol. 34, pp. 605-626.
Heckman, J.J. (1978), ‘Dummy endogeneous variables in a simultaneous equation system’,
Econometrica, n. 4, p. 931-59.
Jahnke, H. (2001), ‘Mezzogiorno e knowledge society: i rischi di spreco e fuga delle risorse umane’, Rivista Economica del Mezzogiorno, p. 749-62, n. 4.
Kaldor, N. (1981), ‘The Role of Increasing Returns, Technical Progress and Cumulative Causation in the Theory of International Trade and Economic Growth’, Economie Appliquée, Tome XXXIV.
Kanbur, R., H. Rapoport (2005), ‘Migration selectivity and the evolution of spatial inequality’, Journal of Economic Geography, n. 5, pp. 43-57.
Kwok, V., H. Leland (1982), ‘An economic model of the brain drain’, American Economic Review, n. 72, pp. 91-100.
Lucas, R. E. (1988), ‘On the Mechanics of Economic Development’, Journal of Monetary Economics, vol. 22, pp. 3-42.
Mazziotta, M., A. Pareto (2009), ‘Measuring Quality of Life: an Approach Based on Non-Substitutability of Indicators’, ISTAT.
Mixon F.G. (1992), ‘Factors Affecting College Student Migration across States’,
International Journal of Manpower, vol. 13, pp. 25-32.
Mixon, F., Jr., Hsing, Y. (1994a), ‘College Student Migration and Human Capital Theory: a Research Note’, Education Economics, vol. 2, n. 1, pp. 65-73.
Mixon, F., Jr., Hsing, Y. (1994b), ‘The Determinants of Out-of-State Enrollments in Higher Education: a Tobit Analysis’, Economics of Education Review, vol. 13, n. 4, pp. 329-335 Miyagiwa, K. (1991), ‘Scale economies in education and the brain drain problem’,
International Economic Review, vol. 32, n. 3, pp. 743-59.
Mountford, A. (1997), ‘Can a brain drain be good for growth in the source economy?’,
Journal of Development Economics, vol. 53, pp. 287-303.
Niedomysl, T. (2006), ‘Migration and place attractiveness’, Department of Social and Economic Geography, Uppsala University.
OCSE (2006), Education at a glance.
Piras, R. (2005), ‘Il contenuto di capitale umano nei flussi migratori interregionali: 1980-2002’, Politica Economica, n. 3, pp. 461-91.
Sjastad, L. A. (1962), ‘The cost and returns of human capital migration’, Journal of Political Economy, vol. 70, pp. 80-93.
Sterlacchini, A. (2008), ‘R&D, higher education and regional growth: uneven linkages among European regions’, Research Policy, n. 37, pp. 1096-1107.
SVIMEZ (2009), Rapporto Svimez 2009, Il Mulino, Bologna.
SVIMEZ (2007), ‘Le migrazioni interne’, Informazioni Svimez, n. 1, pp. 29-34.
Tuckman, H.P., (1970), ‘Determinants of College Students Migration’, Southern Economic Journal, vol. 37, n. 1, pp. 183-195.
Vanderkamp, J. (1971), ‘Migration flows, their determinants, and the effect of return migration, Journal of Political Economy, n. 79, pp. 1012-1031.
Van Ommeren J., Rietveld, P., P. Nijkamp (1999), ‘Job moving, residential moving, and Commuting: a search perspective’, Journal of Urban Economics, vol. 46, pp. 230-253.
Table 1. Correlation coefficients.
Sas ratingtot
Avg ratingtot
Avg_lecturer per_student
Lecturer
per_student QoL SoL
Value added ratio
Wage differential
Contig_is Sas_ratingtot 1.0000
Avg_ratingtot 0.6100 1.0000
Avg_lecturer_per_student 0.4433 0.7260 1.0000
Lecturer_per_student 0.4860 0.3544 0.4878 1.0000 QoLd 0.4309 0.5204 0.4368 0.2241 1.0000
SoLo -0.4859 -0.7370 -0.5622 -0.2399 -0.6782 1.0000 Value added ratio 0.2639 0.1396 -0.0071 -0.1214 0.3357 -0.3693 1.0000 Wage differential 0.0619 0.0576 0.0426 0.0058 0.3131 -0.0531 0.0852 1.0000
Table 2. Definition of variables.
Variable Description Source
AL migrant Dummy variable taking on the value one if the individual migrate to study, zero otherwise. ISTAT, 2009.
PL migrant Dummy variable taking on the value one if the individual migrate after graduation, zero otherwise. ISTAT, 2009.
Sas_ratingtot Average rating of the University attended MIUR, CIVR, 2007
Avg_ratingtot Average rating of the Universities located in the region (NUTS2) of origin of the individual. MIUR, CIVR, 2007
Avg_lecturer_per_student
Average number of professors per student of the
Universities located in the region (NUTS2) of origin of the
individual. MIUR, CIVR, 2007
Lecturer_per_student Average number of professors of the University attended. MIUR, CIVR, 2007
University_private Dummy variable taking on the value one if the university is private, zero otherwise. MIUR, CIVR, 2007
Dimension 1 Dummy variable taking on the value one if the university is small (up to 10,000 students), zero otherwise. MIUR, CIVR, 2007
Dimension 2 Dummy variable taking on the value one if the university is small (10,000 to 15,000 students), zero otherwise. MIUR, CIVR, 2007
Dimension 3 Dummy variable taking on the value one if the university is small (15,000 to 40,000 students), zero otherwise. MIUR, CIVR, 2007
Dimension 4 Dummy variable taking on the value one if the university is small (more that 40,000 students), zero otherwise. MIUR, CIVR, 2007
Gender Dummy variable taking on the value one if the individual is a female, zero otherwise. ISTAT, 2009. Age Age of the individual in classes (increasing from 1 to 8) ISTAT, 2009.
Married_or_divorced Dummy variable taking on the value one if the individual is a married or divorced/separated, zero otherwise. ISTAT, 2009.
Father’s profession Dummy taking on the value one if the individual's father is a self employed or entrepreneur, zero otherwise. ISTAT, 2009.
Father’ education Indicator of the level of education attained by the individual's father. ISTAT, 2009.
Master level degree Dummy taking on the value one if the individual concluded a 3+2 course of study, zero otherwise. ISTAT, 2009.
3 year course Dummy taking on the value one if the individual concluded a first level degree, zero otherwise. ISTAT, 2009. Degree mark Mark obtained by the graduate. ISTAT, 2009. Scientific_area Set of 14 dummy variables. Field of study of the graduate. ISTAT, 2009.
Wage differential
Differential in terms of average individual's monthly wage between the county of origin and that of destination after graduation.
ISTAT, 2009.
Value added ratio Ratio between the value added of the county where the individual studied and the national value added. ISTAT, various years
QoL
Index of the quality of life in the county where the individual is resident at the moment of the interview,
namely the present residence. Il sole24 ore, various years
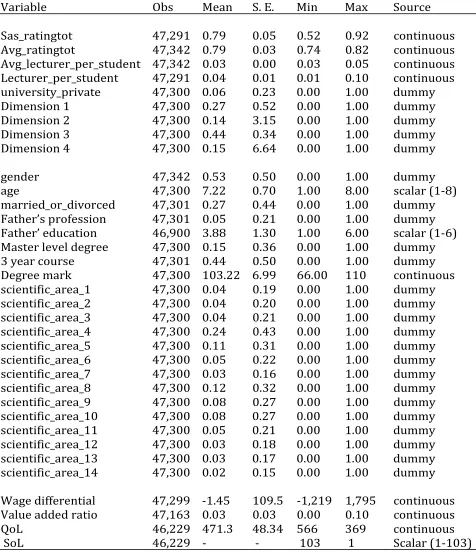
Table 3. Descriptive statistics.
Variable Obs Mean S. E. Min Max Source
Sas_ratingtot 47,291 0.79 0.05 0.52 0.92 continuous
Avg_ratingtot 47,342 0.79 0.03 0.74 0.82 continuous
Avg_lecturer_per_student 47,342 0.03 0.00 0.03 0.05 continuous
Lecturer_per_student 47,291 0.04 0.01 0.01 0.10 continuous
university_private 47,300 0.06 0.23 0.00 1.00 dummy
Dimension 1 47,300 0.27 0.52 0.00 1.00 dummy
Dimension 2 47,300 0.14 3.15 0.00 1.00 dummy
Dimension 3 47,300 0.44 0.34 0.00 1.00 dummy
Dimension 4 47,300 0.15 6.64 0.00 1.00 dummy
gender 47,342 0.53 0.50 0.00 1.00 dummy
age 47,300 7.22 0.70 1.00 8.00 scalar (1-8)
married_or_divorced 47,301 0.27 0.44 0.00 1.00 dummy
Father’s profession 47,301 0.05 0.21 0.00 1.00 dummy
Father’ education 46,900 3.88 1.30 1.00 6.00 scalar (1-6)
Master level degree 47,300 0.15 0.36 0.00 1.00 dummy
3 year course 47,301 0.44 0.50 0.00 1.00 dummy
Degree mark 47,300 103.22 6.99 66.00 110 continuous
scientific_area_1 47,300 0.04 0.19 0.00 1.00 dummy
scientific_area_2 47,300 0.04 0.20 0.00 1.00 dummy
scientific_area_3 47,300 0.04 0.21 0.00 1.00 dummy
scientific_area_4 47,300 0.24 0.43 0.00 1.00 dummy
scientific_area_5 47,300 0.11 0.31 0.00 1.00 dummy
scientific_area_6 47,300 0.05 0.22 0.00 1.00 dummy
scientific_area_7 47,300 0.03 0.16 0.00 1.00 dummy
scientific_area_8 47,300 0.12 0.32 0.00 1.00 dummy
scientific_area_9 47,300 0.08 0.27 0.00 1.00 dummy
scientific_area_10 47,300 0.08 0.27 0.00 1.00 dummy
scientific_area_11 47,300 0.05 0.21 0.00 1.00 dummy
scientific_area_12 47,300 0.03 0.18 0.00 1.00 dummy
scientific_area_13 47,300 0.03 0.17 0.00 1.00 dummy
scientific_area_14 47,300 0.02 0.15 0.00 1.00 dummy
Wage differential 47,299 -1.45 109.5 -1,219 1,795 continuous
Value added ratio 47,163 0.03 0.03 0.00 0.10 continuous
QoL 46,229 471.3 48.34 566 369 continuous
Tabl e 4. Ante La ure am Mig rat ion choice. We igh ted probit robust results.
Coefficients M arginal effects Coe fficients M arg inal effects C oe ffici ent s Pseudo R2
Univ ersity qua lity
SAS_ rati ngtot 10.45 6*** (.4 37) 1.437** * (.055) 10.5 08*** (.44 3) 1.431*** (.055) 7.488*** (.571)
Lectu rer_pe r_stude nt 26.63 8*** (1.827) 2.538*** (.154) - - 13.334*** (1.828)
AVG_ ratingtot -1 4.305** * (.819 ) -1.966*** (.112) -14 .351 *** (.82 7) -1.954*** (.112) -8.457*** ( 1.022) AVG_ lec ture r_per_s tud ent -9 8.839** * (5.06 ) -13.582 *** (.668) -98 .849 *** (5.1 21) -13.464*** (.668) -33.783*** (5.579
Dim_stud1 .521*** (.043 ) .098*** (.010) .525 *** (.0 43) .098*** (.010) .523*** (.044)
Dim_stud2 .349*** (.042 ) .059*** (.008) .350 *** (.0 42) .059*** (.008) .349*** (.041)
Dim_stud3 .051* (.027) .007* (.004) .060 ** (.02 7) .007** (.004) .058** (.032)
S tud ent 's char acte ristics an d fa mil y ba ck gro und
Age - - -.04 1** (.0 18) -.005** (.002) -.101*** (.020)
G ender - - -.04 9** (.0 24) -.007** (.003) -.136*** (.026)
Father's educat ion - - .054 *** (.0 10) .007*** (.001) .036*** (.011)
Father's profession - - ns ns ns
Regi ona l ch ara cte rics an d e con om ic o ppo rtu niti es
Contig_i s - - - - 1.000*** (.053)
Value added rat io - - - - 8.816*** (.500)
QoLd - - - - .006*** (.000)
SoLo - - - - .025*** (.001)
Obs. DF AIC B IC
***Si gnifica nt a t 0.001 ; **S ignifica nt at 0.05; *Sig nificant at 0.1 0. Robu st stan dard error s in bra ckets.
0.18 0.33
M ode l 1 M odel 2
47291 46891
26 847 .47 2 650 1.511
Table 5. Post Lauream Migration choice. Weighted probit robust results.
Coefficients Marginal effects Coefficients Marginal effects Coefficients Marginal effects Coefficients Marginal effects Coefficients Marginal effects
Pseudo R2
Latent variable .533*** (.019) .027*** (.001) .615*** (.036) .017*** (.002) .647*** (.037) .014* ** (.001) .626*** (.029) .013*** (.002) .773*** (.063) .010** * (.002)
Wage differential .006*** (.000) .0003* ** (.000) .006*** (.000) .00 01*** (.000) .006*** (.000) .0001*** (.000) .002*** (.001) .00005* ** (.000) .006*** (.000) .00008*** (.000)
Univer sity quality
SAS_ratingtot - - -10.849* ** (.662) -.291** * (.027) -10.95*** (.65 7) -.237*** (.024) -14.09** * (.799) -.293*** (.030) -8.54** * (.730) -.110* ** (.024)
Professo r_per_student - - -16.293* ** (2.648) -.438*** (.070) -15.16*** (2.637) -.333*** (.058) -24.87*** (3.940) -.517*** (.065) -23 .54* ** (2.835) -.305* ** (.071)
Dim_stud1 - - -.566*** (.098) -.009** * (.001) -.552** * (.099) -.007*** (.001) -1.039*** (.145) -.009*** (.001) -.348*** (.800) -.003* ** (.001)
Dim_stud2 - - -.354*** (.072) -.007** * (.001) -.352** * (.073) -.0002*** (.001) -.605*** (.094) -.007*** (.001) -.362*** (.069) -.003* ** (.001)
Dim_stud3 - - ns ns ns ns -.089* (.053) -.002* (.001) -.189* (.052) -.0 03* (. 001)
Student's char ac ter istics and fam ily backgr ound
Age - - - - .201*** (.031) .005*** (.001) .186*** (.031) .004*** (.001) .279*** (.034) .004** * (.001)
Married o r divorced - - - - .341*** (.479) .009*** (.002) .308*** (.052) .008*** (.002) .325*** (.051) .052** * (.002)
3 year course - - - - -.143** * (.471) -.034*** (.001) -.162*** (.0 51) -.003*** (.001) -.197*** (.049) -.002* ** (.001)
Master level degree - - - - -.184** * (.068) -.003*** (.001) -.182*** (.074) -.003*** (.001) -.122* (.069) -.001* (. 000)
Father's education - - - - -.099** * (.018) -.002*** (.000) -.117*** (.020) -.002*** (.004) -.083*** (.019) -.001* ** (.000)
Father's profession - - - - .176** (.070) .005** (.023) .176** (.079) .004** (.003) .184** (.073) .003** (.003)
Degr ee mark - - - - .131*** (.004) .0003 *** (.000) .012** (.004) .0002** (.000) .010** (.003) .0001** (.000)
Scientific ar ea 1 - - - - .310** (.106) .010** (.004) .276** (.102) .008** (.004) .238** (.107) .004** (.003)
Scientific ar ea 2 - - - - ns ns ns ns ns ns
Scientific ar ea 3 - - - - ns ns ns ns ns ns
Scientific ar ea 4 - - - - ns ns ns ns ns ns
Scientific ar ea 5 - - - - .204** (.099) .005** (.003) .140* (.098) .003* (.003) .240** (.100) .004* (.002)
Scientific ar ea 6 - - - - ns ns ns ns ns ns
Scientific ar ea 7 - - - - ns ns ns ns ns ns
Scientific ar ea 8 - - - - ns ns ns ns ns ns
Scientific ar ea 9 - - - - ns ns ns ns ns ns
Scientific ar ea 10 - - - - ns ns ns ns ns ns
Scientific ar ea 11 - - - - ns ns ns ns ns ns
Scientific ar ea 12 - - - - ns ns ns ns ns ns
Scientific ar ea 14 - - - - -.079** * (.203) -.008*** (.001) -.979*** (.216) -.008 (.001) -.579*** (.177) -.004 (.001)
Regio na l char acter ics and eco nom ic o ppo rtunities
QoLd - - - .011*** (.001) .0002*** (.000) - -
Value added ratio - - - -15.95* ** (1.932) -.206* ** (.03 9)
Obs. DF AIC BIC
***Significant at 0.001; * *Significant at 0.05; *Significant at 0.10. Robust standard error s in brackets.
0.32 0.35
Mo del 1 Model 2 Model 3 Model 5
0.39
45389 45389 45389 45389 45389