Infrastructure regulation: what works,
why, and how do we know?
Clifton, Judith and Díaz-Fuentes, Daniel and Fernández
Gutiérrez, Marcos and Revuelta, Julio
Universidad de Cantabria, Spain
2009
Online at
https://mpra.ub.uni-muenchen.de/33046/
CHAPTER 2
Infrastructure Regulation: What Works,
Why, and How do we Know?
Judith Clifton, Daniel Díaz-Fuentes, Marcos
Fernández-Gutiérrez and Julio Revuelta
Public infrastructure services have been subject to dramatic regulatory reform since the 1980s in the European Union, particularly privatization, at the national level, and increased liberalization and deregulation, via the Single Market Programme. Despite this ambitious reform pro-gramme, there are signs that regulation does not always work. The Commission has recognised the limitations of reform undertaken so far. Recently, it generated a list of 23 sectors which were crucial for economic growth and “malfunctioning” in the Single Market. This list included major public infrastructure services — energy, gas, telecommunications and transportation. Attempts are being made to identify the causes of this “malfunctioning” and it is expected that new regulation will be implemented to improve this situation. As part of efforts to make these markets perform better, policy-makers are turning their attention to bet-ter understand the consumer. Previously, regulation was based on the economic theory which assumed that consumers were rational and selfish. However, this is now being questioned using insights from Behavioural Economics. The Directorate General for Health and Consumers is mov-ing towards a more eclectic approach to economics. In this light, this paper analyses regulatory reform of public infrastructure services from a user-consumer perspective. Stated (derived from the Eurobarometer) and
revealed (derived from Household Budget Survey) preferences of con-sumers with respect to public services are analyzed to enable a better understanding of consumer behaviour. By contrasting stated and revealed preferences, new insights into consumer behaviour can be gained. These insights may be useful in future regulation of infrastruc-ture services in many countries worldwide. The new evidence generated can be used as a basis for the development of new consumer or user-related regulation.
1. Introduction
and provides insights into the dynamics of the user-service relationship. These insights may give rise to innovations in regulation, which in turn will ensure that users are informed and empowered, thus enabling com-petition, quality and innovation.
In the light of gaining a better understanding of the user while fram-ing regulation, this paper evaluates public infrastructure services and their reform from the user perspective. The second section of the paper analyses how and why a common European position on evaluating infra-structure services from the demand-side was forged during the 1990s. Recent thinking in the Commission and its implications in terms of pol-icy design, particularly its new emphasis on understanding consumer behaviour is discussed. The main tools used to evaluate infrastructure services from the demand-side are described, including an analysis of the main improvements and limitations for the better understanding of the effects of reform on users. The third section discusses the empirical analy-sis. In order to gain insight into user satisfaction with infrastructure services, the relevant data available is analysed with respect to Spanish consumers in the European context. It should be noted that the same methodological approach could be applied to countries around the world. This is the future intention of the authors. Particular attention is paid to issues of universality, accessibility, affordability, service use and non-use, perceived importance of the services, consumer protection and so forth from the perspective of disaggregated data on users. Because stated prefer-ences can be difficult to compare across cultures and countries and, in order to check these declarations, patterns of expenditure on these services are analysed through the Household Budget Surveys (HBS). Contrasting stated and revealed preference is an innovative methodology applied to user satisfaction. Keeping in view the current approach to demand-side evaluation, the conclusions in the fourth section summarise the insights gained into the relationship between infrastructure services and users, and conclude that some of these insights could form a basis for improved demand-side regulation.1
1We acknowledge the Spanish Ministry for Science and Technology (ECO2008–06243) for
2. The Political Economy of Reforming Infrastructure
Regulation
2.1.
From State to Market: Establishing Citizen Rights
to Public Services
Privatization, liberalization, deregulation and internationalization of enterprises that were previously national monopolies for several decades raise complex questions about regulation for users (Clifton, Díaz-Fuentes and Revuelta 2010). From a political economy perspective, regulatory reform shifts the old balance between winners and losers. Theoretically, consumers are set to gain from these reforms, due to expected price reduc-tions and increases in service performance and choice, whilst labour may lose as working conditions are subject to more competition.2Usually,
gov-ernments decide the policies they wish to implement and they choose the ones that best suit their political economy interests. An additional factor in the case of the EU is the ‘Single Market,’ that is prevalent eversince liberal-ization and deregulation policies were introduced, as well as the introduction of new regulation in certain fields; and ´“lock-in” national governments to European reform.
In the face of the dramatic reform of public services in the EU from the 1990s, the need to establish regulation from the user perspective was agreed, although there was a dispute on elements that were supposed to be regulated. After some conflict, an “European compromise” was settled between France and the UK. Whilst the French position sought to regulate the user by establishing citizen rights or entitlements at the EU level inscribed in a charter or Directive, UK remained optimistic about the capacity of the market to resolve problems, though it conceded that some small measures may be required to protect consumers. From the begin-ning of the 21st century, the failure of the legal project to establish a Constitution for European citizenship sounded the death knell for the continental project. Moreover, efforts were made to find economic
2See the outputs of the PIQUE (Privatization of Public Services and the Impact on Quality,
solutions, rather than legal solutions, with regard to regulating from the user perspective. This section examines the contested development of demand-side regulation from the 1990s and explains the position reached at the beginning of the 21st century.
From the 1980s, as part of the Single Market Programme, the European authorities agreed to implement liberalization and deregulation of infrastructure services. Privatization, in contrast, was a national affair: some countries, such as the UK, had been early privatizers, though most Member States embarked on privatization programmes later on, from the 1990s (Clifton, Comín and Díaz-Fuentes, 2003, 2006). As reform deepened and extended, however, pressure accumulated from representatives of the European political elite as well as from consumer and labour organizations due to their concern with the consequences of these reforms. These con-cerns crystallised around the fear that if the regulatory reform of infrastructure services was left unchecked, users could experience bad service quality than they did before the reform. Member States charac-terised by continental legal traditions, whereby universality, accessibility and non-discrimination were inscribed as citizens’ rights, as well as numerous consumers’ associations, and social partners, were particularly important representatives of this position.
service regimes across Europe included the kinds of activities that had been operated and managed by public enterprises, a resistance to allow-ing market forces to govern these activities, and the introduction of similar laws on how these services should be run (such as monopolies, concessions, exclusive or special laws). When public services had been provided by the State, citizens had a “voice” via a universal right to vote nationally and locally for a political manifesto, in which public services were always central. Politicians were accountable to citizens for public service provision. Under privatised ownership and market-driven rules, it was feared that commercial interests would be pursued over and above the public interest, which could negatively affect public service obliga-tions, universal service, quality, price and continuity of supply, blurring who would be taken as accountable for these services (CEEP and ETUC, 2000). As firms in the communications, transportation, water and energy sectors became increasingly internationalised, fears were voiced by consumer associations and other NGOs that basic public services that were once understood to “belong” to the nation would now be owned and controlled by distant foreign interests motivated by short-term profits because of the principal-agent problem (Balanyá et al. 2000). Considering much internationalization was by foreign national govern-ments, another concern was geopolitics: in Europe, the main threat was Russia’s perceived energy interests (Clifton, Comín and Díaz-Fuentes, 2007; Goldstein, 2007).
As privatization and liberalization of the infrastructure services gained importance, actors — led particularly by France and Belgium — began to express their fundamental concerns. Whilst liberalization was a clearly defined policy, the nature and role of “Services of General Interest” or SGI3— which could be legible for state-aid and exemption from
liber-alization — was less clearly defined. In general, these actors were not against reform per se. However, they insisted whether on or not public
3“Services of General Interest” (SGI) is the official EU terminology for a range of public
services fell in to private or public hands, the user needed written guaran-tees about their rights, which should be included in a European Directive or Charter. In 1994, Jacques Delors, the President of the European Commission (EC) commissioned two of the EU social partners — the “European Centre of Enterprises with Public Participation and of Enterprises of General Economic Interest” (CEEP), and the European Trade Union Confederation (ETUC) — to draft a Charter for SGI as a basis for a Framework Directive, which was published six years later after many rounds of consultation (CEEP and ETUC, 2000, EC, 2003b, EC, 2004). This development was also championed by the European Parliament and supported by the German government (Prosser, 2005). The draft Charter urged for a “bottom-up” approach to social regulation. This draft mentioned that citizens — not users or consumers — are more important and argued that all citizens should be guaranteed rights to: equal access, no discrimination, continuously working, quality and adapt-able services, universal provision, safety, fair pricing, efficiency levels that could be verified objectively, transparency, participation and democratic control. In this way, public services would be a foundation for a ‘Social Europe’ characterised by solidarity, territorial and social inclusion, quality of life and a dynamic economy (Van de Walle, 2006). A logical extension of guaranteeing rights to public services was the establishment of a European citizenship — part of the objective behind the failed European Constitution.
governments in Australia, UK and the United States, as well as interna-tional organizations such as OECD (McGuire, 2002). Though diverse in scope and objectives, most service charters emphasize issues about con-sumer empowerment and performance benchmarking. New Public Management basically suggests that market mechanisms can be intro-duced into business where privatization is not feasible or desirable. Though the concept of New Public Management has been criticised as being over-stretched (Hood, 2001), it is often associated with tech-niques such as contracting out and downsizing. From the consumer perspective, users may pay for good information about service per-formance, levels of satisfaction, and have channels to voice their discontent (Hirschman 1970; Clifton, Comín and Díaz-Fuentes, 2005). There are several important differences between the “citizen-centred” and “consumer-centred” approaches (Clarke et al., 2007), but perhaps the most fundamental one is that the “continental” perspective addresses citizens (the entire population) whilst the “Anglo-Saxon” per-spective begins with the point of consumption; little is said about those who fall outside this market exchange.
emphasised the need for a proper definition of SGI as well as a clarifi-cation that the Member States could use discretion in order to organise and fund them as required (Prosser, 2005). The resulting White Paper, published two years later, only contained “soft” instruments with regard to regulation for two main reasons: First, due to the lack of con-sensus about the way in which user rights to these services should be regulated, second, because overshadowing all these developments was the process whereby the European Constitutional Treaty was to come into force, granting rights to a long-awaited European citizenship. When the Constitutional Treaty was rejected and, as the EU entered an institutional crisis, the project to establish of rights to these services linked to citizenship faded away.
If, in the mid-1990s, it looked possible that a Directive could be passed that focused squarely on establishing citizens’ rights to these services, it seems that the EU has quietly abandoned the aim of protecting citizens through “positive integration.” Any rights to services will be guaranteed at the national level, or will be promoted by the European authorities through “soft” instruments (Clifton and Díaz-Fuentes, 2010).
2.3.
Evaluating Regulation: What do we Know, and How?
From the 1980s, the rhetoric of reformist policy-makers centred on the ideas of augmenting choice and quality of infrastructure services for users. Paradoxically, systematic research on whether users are more satisfied after reform has not always been prioritised. Most policies have focused on supply-side concerns, and it is only more recently that attention is being paid to demand-side issues. Better information about users’ opinions forms the crux this new approach.
those surveyed. For methodological reasons, the first survey, published in 1997, is not directly comparable to the proceeding ones. However, from 2000, the methodology is homogenous. Therefore, results can be directly compared.
The first dedicated survey was conducted by the Eurobarometer47.1 (EC, 1997). This is different from the proceedings ones, because it focused on views of citizens in the face of the prospective exposure of public monopolies to competition. To this extent, it is the only survey of opinions about public services “before” they are subject to significant regulatory change or at a relatively early stage in regulatory reform, though regulatory change was already advanced in some Member States and relatively more advanced in telecommunications than in other public service sectors. There are two striking features of this survey (Clifton, Comín and Díaz-Fuentes, 2005): First, the 1997 survey is concerned with the opinions of “citizens” as opposed to “users” — questions focus on perceptions two citizens have about the opening of monopolies with regards to prices, access, quality, choice and consumer protection, as well as questions about what benefits they had already noticed. The influence of the continental approach is thus revealed: for instance, in the 121-page document, “citi-zen” is used 303 times. The other striking thing is the survey results: levels of citizen satisfaction depend heavily on 1) the country a citizen resides in and 2) the sector being evaluated.
The proceeding surveys on satisfaction are more directed at user sat-isfaction. Thanks to the efforts by the Commission to deploy the same methodology, the surveys from 2000 onwards are directly comparable making the evaluation of satisfaction over time possible. Each of these sur-veys consists of in-depth analyses of consumer satisfaction with SGI, in the EU-15 (EC, 2000; EC, 2002), the new EU-10 (EC, 2003a) and the EU-25 (EC, 2005; EC, 2007b). EC (2000), EC (2002), EC (2003a) and EC (2005) measure satisfaction with access, price, information and other contract indicators for electricity, gas, water, fixed telephony, mobile telephony, postal services, urban transport and railways. EC (2007b) covers these sec-tors plus internet and banking.
of the survey results. The problem with this exclusion is that the results on satisfaction are biased as they do not include those who cannot afford them, do not have sufficient information about them, or do not want them for a variety of reasons. To a great extent, this policy reflected the influence of New Public Management’s focus on the consumer. This pol-icy was changed in the 2004 and 2006 surveys: here, the survey respondents were grouped into two categories at the outset: consumers and non-consumers of a given service. Both categories were analysed in order to gain a deeper understanding of items consumed people. Questions of access were stressed for both categories, and, once identi-fied, non-consumers were surveyed further on issues such as accessibility, affordability-price, quality, consumer rights’ protection and consumer relations. Non-consumers who potentially had service provi-sion were asked about accessibility, affordability and knowledge of the quality and reliability of the services. In addition, for the first time, addi-tional socio-economic variables of respondents were considered in the analysis, including gender, age, education, household composition and urbanisation. These efforts towards better understanding consumer behaviour, including the behaviour of “non-consumers” differed from the earlier attempt to study citizens’ opinions. These changes reflect a better understanding of consumption patterns in the first few years of the 21st century as discussed in the fourth section.
Now, while the Eurobarometerprovides rich statistical data on citizens’ opinions and perceptions with regard to infrastructure services, they have not been used sufficiently in the design and implementation of regulatory policies until now. In addition, there has been a lack of empirical and ana-lytical research to uncover what can be learnt about stated preferences for evaluating an infrastructure reform. One exception is a study by Clifton, Comín and Díaz-Fuentes (2005) that analysed patterns in stated user sat-isfaction across the EU-25 for six services based on Eurobarometers
attitudes about these services. Fiorio and Florio (2008) conclude that insti-tutional circumstances should be borne in mind while designing regulatory policies, since it is misleading to assume that a single, homoge-neous regulatory framework will have the same results in different contexts.
The objective of research based on stated preferences is to empirically analyse questions previously studied from the theoretical perspective. This justifies the need to evaluate institutional aspects and the quality of public policy, as well as the net effect in terms of winners and losers (Frey and Stutzer, 2002). However, a large literature exists which points to the biases that may arise in the expression of stated preferences. This has led to scep-ticism in deploying data on user satisfaction as a means of improving the design of service regulation. Stated preferences have traditionally been compared with revealed preferences (user behaviour) as an instrument to explain consumer behaviour. The utility inference derived from real con-sumer behaviour has been dominant, due to its ascribed objectivity, when comparing comparatively household welfare from the economic point of view. Despite this, there is a lack of research on the evaluation of regula-tory reform of infrastructure services, perhaps due to a lack of homogenous data at the European level. Recently, more attention has been paid to evidence of empirical anomalies in human behaviour which that utility can be inferred from revealed preferences (Frey and Stutzer, 2002). This could imply that when regulation is evaluated from the demand-side, possible biases in user behaviour, which are crucial to the new economic approach detailed in the next section, should be taken into account. Thus, stated and revealed preferences could be considered as complementary sources, which when combined, will enrich the analysis of user behaviour.
2.4.
Implications for Designing a Regulatory Framework:
New Regulatory Policies in the OECD and EU
Anglo-Saxon governments, became influential within European authori-ties during the 1990s, in the first few years of the 21st Behavioural Economics was promoted by the same countries and organizations.
vis-à-vis infrastructure could be explained using data on the social context or their social role.
Patterns in user behaviour could be useful in explaining how markets function. Of late, it is argued that these insights could have important con-sequences for regulatory design. In this regard, from the practitioner perspective, one powerful suggestion is that rather than separating com-petition policy (supply-side) and consumer policy (demand-side) institutionally, these regulations could — and should — be combined. This is recommended by the new “Fair Trade Policy” at the UK Office of Fair Trading (Fletcher, 2008). By merging demand and supply-side regulation, aspects of consumer behaviour, such as inertia, limited memory, myopia, choice overload and so on can be addressed through better regulation.
DG SANCO argues that incorporating consumer behaviour into the design of regulatory frameworks for infrastructure could be a means of improving regulatory quality. A better understanding user behaviour as part of a demand-side consideration, combined with supply-side considerations, could be incorporated into a better, higher quality, regulatory policies. Improved regulation of these issues can make con-sumers and non-concon-sumers alike more knowledgeable about products and services, thus making them more “empowered,” “active” and “confident” in the marketplace (Fletcher, 2008). Improving our under-standing of consumer behaviour could mean consumers benefit more from the potential advantages of competition policy. From a political point of view, it should be noted that this solution is of interest to the Commission because, while it has historic competence in competition policy, it has lesser competence and experience in consumer policy. An attempt to merge elements of consumer policy with competition policy could increase the Commission’s competence in consumer policy. Because of that, particularly active in this project was the newly-established Directorate for Health and Consumers, also known as DG SANCO.
market. A list of 23 sectors — which were both important for the European economy and which displayed significant problems with refer-ence to obstacles to a Single Market was identified. Unsurprisingly, all the main public — infrastructure services were included on this list. With ref-erence to supply-side regulation, an in-depth analysis was done to quantifying characteristics such as market power, competition, prices, mark ups and so on, with the aim of reconsidering the optimum policy response (DG SANCO, 2008). However, this is also being complemented by a demand-side analysis, as the Commission, in accordance with the OECD, states that interactions between consumers and the market may exhibit problems that may not be addressed by the supply-side regulation. Thus, the Commission is seriously studying the benefits of demand-side regulation, if analysis indicates this is required.
In order to signal increased attention to understanding the consumer, a new tool known as the “Consumer Market Scoreboard” (DG SANCO, 2008) was launched in 2008. The idea was to produce a highly visible and accessible document that contains aspects such as consumer use and satis-faction with products and services across the EU on an annual basis. Since the Commission had been producing detailed surveys and reports on satis-faction with infrastructure services since 1997, the approach and data used in these surveys and reports dominated the work done so far. In order to gather similar information on user satisfaction for the other sectors, the Commission and DG SANCO have to coordinate the collection of national data on consumer satisfaction and behaviour from national authorities.
3. Exploring Patterns of Infrastructure Use
b1065
Infr
ast
ru
ctur
e R
egulation
t al.
Sample 1006 19435
size
Level of Individuals Households
analysis
Main Individual characteristics Reference person characteristics variables
Marital status Marital status
Education (1) Education (1)
Sex Sex
Status in employment Status in employment
Age (1) Age (1)
Nationality Nationality
Area of residence
Household size Household characteristics
Household type Climate characteristics
Political ideology Area of residence
Household size
Service satisfaction Household type
Accesibility Size of municipality
Affordability Population density
Service importance (2) NUTS1/NUTS2
Ease to compare offers (2) Total spending Consumer protection perceptions Total income
[image:17.488.107.641.90.375.2]b1065
Infr
ast
ru
ctur
e R
egulation
1st R
eading
Infr
ast
ru
ctur
e R
egulat
ion
[image:18.488.113.605.158.288.2]17
Table 1: (Continued)
Declared preferences (Eurobarometer) Revealed preferences (SHBS)
Electricity Gas Water Fixed tel. Mobile tel. Internet Electricity Gas Water Fixed tel. Mobile tel. Internet
Use 93.44 61.13 91.95 81.21 73.86 35.19 98.47 56.38 95.34 82.82 (3) 67.54 (3) 31.03 Non use- Age <35 Rural Age <25 Age <25 Age >65 Age >65 Age <25 Rural Rural Age >30 Age >65 Age >65
related Urban area Rural Low Low Foreigner area area Foreigner 1 or 2 Low factors area Age >65 area studies studies One- Age >70 Age <30 One- member studies (4) Self- Low One- Small Rural member One- Age >70 member household Rural employed education member households area household member 1 or >4- household Low area
Mean households Small household member studies
One-analysis Unemployed household household member
Low education household
(1) Not exactly comparable
(2) Only in fixed telephony, mobile telephony and Internet (3) 95.2 % considering jointly fixed and mobile telephony (4) Only individual and household characteristics
SGI are derived from the Eurobarometer(EC, 2006). These are compared with revealed preferences, or consumption patterns of particular services, derived, in this case, from the Spanish Household Budget Survey(Encuesta de Presupuestos Familiaresor SHBS) of the same year (INE, 2006). Clearly, this analysis could be extended to the rest of the EU using the Household Budget Survey (EUROSTAT, 2009). Both surveys include data on the use of diverse services, including, for our purposes, electricity, gas, water, fixed and mobile telephony and internet services. The Spanish survey sample is 19,435 households, while the Eurobarometersample is 1,006 individuals. Socio-economic characteristics which are comparable across the two sur-veys are marked in bold.4There are other characteristics included in one
survey but not in the other, such as political position (in the
Eurobarometerbut not in SHBS), or total household income (in SHBS but not in the Eurobarometer). Whilst the Eurobarometer indicates whether individuals state they use a service, SHBS reveals consumption through expenditure. Service use is revealed when the amount spent is positive.
A preliminary and an important observation is that the stated and revealed use for all six services is highly consistent. Electricity and water are universal services, fixed and mobile telephony are near-universal, whereas gas and internet are less-universal services. Revealed use is higher than the stated use for universal or near-universal services, whilst the stated use is higher than the revealed use for two less-universal ones. Therefore, the stated use and the revealed use can be calculated according to the most relevant control variables in the survey, thus identifying the most important factors explaining the non-use of services. These factors are listed by declining importance under each sector. There is also a high degree of consistency with regard to factors explaining non-use. Age appears repeatedly as a significant factor. Lower educational attainment appears to be relevant for usage of gas, mobile telephony and internet while rural areas are relevant for usage of gas, fixed phone and the inter-net people above 65 are less likely to use mobile telephony, interinter-net and gas; whilst younger people are less likely to use electricity, water and fixed telephony. Rural dwellers are less likely to use gas and internet, whilst
4Climate considerations have also been introduced to better understand consumption
people with lower educational attainment are less likely to use mobile telephony and internet.
Using information on the stated use of services, Table 2 analyses the factors that best explain the use of the six sectors. Both personal charac-teristics of the person surveyed, as well as their satisfaction with different aspects of service provision, are tested for their influence on service use. In order to do so, probit estimations and marginal effects of the following models are used:
Yi=α + βXi+εi (1)
Yi=α + γZi+εi (2)
Yi=α + βXi+γZi+εi (3)
where:
Yi =Service use: 1 =Use, 0 =Non-use.
Xi = Personal control variables such as age, sex, educational attainment and so on, as listed in Table 2.
Zi =Control variables about the services with reference to satisfaction with accessibility, satisfaction with affordability, perception of the services as being important, perception of the service as being very important, ease with which offers can be compared and satisfaction with consumer protection.
b1065
Infr
ast
ru
ctur
e R
egulation
t al.
Foreigner −0.3067**
Left 0.0717***
Single −0.1301***
Nostudies −0.1202*** −0.0923**
Women −0.0386* −0.1003***
> 65 0.1308*** −0.2171*** −0.1390***
Selfemployed 0.0394*** 0.1137*** 0.1341*** 0.1561*
Unemployed 0.1493*
Student 0.1649**
Rural −0.1367*** −0.1159*** −0.1843***
Householdsize 0.0533** 0.0423**
Children −0.0886*** −0.0535**
Unipersonal 0.0344***
Oneparent 0.3406***
Tempjan 0.0117***
Tempjuly 0.0214*** 0.0083*** 0.0099**
Accessibility 0.4898*** 0.6391*** 0.4744*** 0.2152*** 0.3080*** 0.2769*** Affordability 0.0339* 0.3466*** 0.0567*** 0.1106*** 0.1289*** 0.1648***
Important 0.3046*** 0.3859*** 0.2848***
Vimportant 0.1043*** 0.2072***
Easyoffer −0.0621***
Protection 0.0556*
[image:21.488.106.644.79.399.2]Reinforcing the universality of electricity and water as shown in Table 1, personal characteristics intervene only weakly in explaining usage as provision is non-discriminatory. Accessibility to electricity and water is by far the most explanation for usage (48.98% and 47.44% respectively). Affordability comes second, though it is much less impor-tant in explaining the usage (3.39 and 5.67% respectively). Gas services are available to around 60% of households. With respect to usage of elec-tricity and water, the most satisfactory explanation for usage is accessibility (63.91%) followed by affordability (34.7%). Associations with affordability are stronger than those found in the other five sectors. Personal characteristics of the respondents also matter: one-parent fam-ilies or the ones with people above 65 are more likely to use gas (34.1% and 13.08% respectively), whilst negative associations are found for for-eigners (−30.7%), rural dwellers (−13.8%) and two-parent families with children (−8.86%).
(14.93%) are also more likely to use internet. Personal characteristics also affect usage in a negative way: for fixed phones, these include rural dwellers (−11.59%) and females (−3.86%); for mobile phones, these are people above 65 (−21.71%) and those with lower educational attainment (−12.02), and for the internet, rural dwellers (−18.45%), the over 65s (−13.9%), singletons (−13.01%), females (−10%) and those with lower educational attainment (−9%).
The revealed use is derived from the SHBS (INE, 2006) as shown in Table 3. Average spending on the service in question of the population is measured (Gij). In addition, the variation coefficient of Giis calculated, in
order to analyse the extent to which this is homogenous. Next, the average service expenditure by household users is calculated (Gij|Gi>0). The relative
importance ofGij/ Giis calculated in relation to total household expenditure,
to discount the income effect. The absolute and relative importance is finally analysed by a comparison of means, according to the control variables in the SHBS. The estimation of the factors explaining service expenditure: an Ordinary Least Squares regression is performed where the dependent vari-able is household expenditure on a particular service (Gij) and the
independent variables are regional (Ri), territorial (Ti), household type (Hi),
characteristics of the bread-winner (Si) or economic situation (Ei),
From the applied model:
Gij=α + βRi+γTi+δHi+ζSi+ηEi+ εi
where i=representative person and j=the service in question. It is derived:
β, indicates regional differences in expenditure
γ, indicates differences related to territorial accessibility
δ, indicates differences according to household characteristics
ζ, indicates the effects due to characteristics of the bread-winner. These include: age, non-monetary effects of employment, non-monetary effects of education, etc.
η, indicates the effect of income, associated with levels of spending (Gi)
and/or total income.
Table 3a: Estimations of effects on revealed spending
Electricity Gas Water
Importance 377.47 326.59 135.87
(average spending)
Spending CV 0.47 0.96 1.41
Average spending (users) 383.34 326.59 135.87
Regression results βstand. βstand. βstand.
Income
TOTAL SPENDING 0.464*** 0.212*** 0.375***
TOTAL INCOME −0.017**
Sex 0.015**
WOMEN RP Age
AGE RP 0.028*** −0.026*** 0.067***
RP <25 −0.011***
RP <30 −0.033***
Marital status 0.015**
SINGLE Nationality
FOREIGN-RP 0.055*** 0.025*** 0.151***
EU-RP 0.027*** 0.020*** −0.015**
Education Employment
UNEMP-RP 0.013**
SELFEMP-RP 0.033***
Household type
SIZE 0.052*** 0.014** 0.039***
5MEMBERS −0.026*** −0.013*
ONEPARENT −0.017*** −0.012**
WOMAN>65 0.029***
TWO>65 0.018** −0.017***
Territorial 0.043***
variables 0.032*** −0.028***
SEMIPOB
SCPOB 0.024***
URBANLUX −0.030*** 0.028***
URBANHIGH −0.013*
Table 3a: (Continued)
Electricity Gas Water
RURAL −0.016***
MUN50000 −0.035***
MUN20000 −0.029***
MUN10000
MUN>10000 −0.061***
Regional variables
NOREAST −0.040***
CATALONIA 0.133*** 0.171*** 0.261***
CVALENC 0.131*** 0.092***
MADRID 0.168*** 0.247*** 0.225***
ANDALUCIA 0.177*** 0.152***
CANARIAS 0.113***
BALEARIC ISLANDS 0.045***
EXTREMADURA 0.032***
CLAMANCHA 0.023***
MURCIA 0.062***
TEMPJAN −0.076***
Source: Authors information based on INE (2006). RP = Reference person.
Signification: * >90 %, ** >95 %, *** >99 %.
relative ease of purchasing electricity due to income differences. Despite this, stated affordability was not very strongly linked with usage (as shown in Table 2) because demand is inelastic. Higher expenditure is associated with dwellers of less densely populated zones, foreigners, the unemployed and self-employed, and the older a person the more the expenses on elec-tricity. One-parent families spend less on elecelec-tricity. It also appears that expenses on electricity is higher in large cities that experience hot temper-atures during the summer.
Table 3b: Estimations of effects on revealed spending
Fixed Mobile Total
telephony telephony telephony Internet
Importance (average spending) 240.23 350.62 590.85 77.85
Spending CV 1.17 1.96 2.52
Average spending (users) 290.12 519.13 620.69 250.89
Regression results βstand. βstand. βstand. βstand.
Income
TOTALSPENDING 0.321*** 0.427*** 0.480*** 0.291***
TOTALINCOME 0.033*** 0.024*** 0.018**
Sex
WOMENRP 0.022*** 0.028*** 0.026***
Age
AGE-RP 0.131*** −0.078*** −0.024**
RP <25 −0.017**
RP <30 −0.041***
RP <35 0.041*** 0.039***
Marital status
SINGLE 0.020*** 0.017***
Nationality
FOREIGN-RP −0.027*** 0.102*** 0.081*** −0.018**
EU-RP 0.081*** −0.042*** −0.011* 0.039***
Education
SECONDARY 0.018***
PREUNIV 0.022*** −0.012** 0.054***
PROFEDUC −0.023*** −0.013** 0.037***
UNIV1 0.019*** −0.024*** −0.012* 0.053***
UNIV2&3 0.030*** −0.049*** −0.028*** 0.081***
Employment
LESS2OCC −0.027*** −0.020*** −0.026***
NONOCC −0.030***
SELFEMPRP 0.029*** 0.016***
Household type
SIZE 0.042*** 0.073*** 0.064*** 0.070***
ONEMEMBER 0.048*** 0.028*** 0.025**
5MEMBERS −0.023*** −0.037***
ONEPARENT −0.015**
WOMAN>65 0.030*** 0.031*** 0.018**
TWO>65 −0.025***
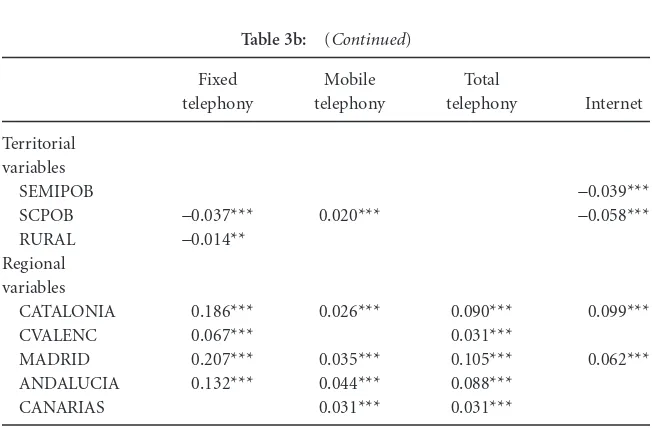
Table 3b: (Continued)
Fixed Mobile Total
telephony telephony telephony Internet
Territorial variables
SEMIPOB −0.039***
SCPOB −0.037*** 0.020*** −0.058***
RURAL −0.014**
Regional variables
CATALONIA 0.186*** 0.026*** 0.090*** 0.099***
CVALENC 0.067*** 0.031***
MADRID 0.207*** 0.035*** 0.105*** 0.062***
ANDALUCIA 0.132*** 0.044*** 0.088***
CANARIAS 0.031*** 0.031***
Source: Authors information based on INE (2006). RP = Reference person
Signification: * >90 %, ** >95 %, *** >99 %
are associated with greater expenditure, whilst one-parent families are associated with less expenses on water. Water services may be granted for free in some rural areas with abundant water resources, particularly in northern Spain. Smaller municipalities are associated with lower levels of expenditure on water.
Gas is a considerable expense for those households which use it. Expenditure is negative for households in rural and less populated areas, and older people. While expenditure on electricity increases during the summers, expenditure increases during the winters (TEMPJAN). Households in Madrid and Catalonia spend more perhaps because net-works are established in these large urban areas (as will also be seen for the internet).
of education, as expenditure on voice telephony is inversely related to education: the higher the level of education received, the less the expenses. Moreover, the highly educated spend relatively more on fixed phones and relatively less on mobile phones. Likewise, the older the person, the more likely he/she will spend more on fixed phones and less on mobile phones. In contrast, younger users spend more on mobile telephony, often, as a substitute for fixed phones. Rural households also substitute fixed phones for mobile telephony. Foreigners also spend more on mobile telephony rather than on fixed phones, though EU foreigners are an exception to this. Singletons spend relatively more on mobile telephony. One-parent households also spend relatively less on fixed phones. Self-employed spend more on fixed phones. The social history of telecommunications shows that women tend to spend more on this service compared to men.
Users’ expenditure on internet services is intermediate when com-pared to the other services and the variations are much higher than other sectors. There is a clear, positive, relationship between level of education attainment and internet use. Households with more educated members spend relatively less on voice telephony but more on the internet. Rural dwellers spend relatively less as do households with less than two jobs. Increased age is associated negatively with expenditure on the internet. Non-EU foreigners spend less on internet and EU nationals spend more (a pattern reinforced by their expenditure patterns on fixed phones).
4. Discussion and Conclusions
Measuring Regulatory Outcomes and Effectiveness:
What do we know?
Economics in policy-making, there is increased interest among interna-tional organizations such as the EU, the OECD and nainterna-tional governments in combining supply-side with demand-side regulation.
This chapter sought to examine the demand-side for a better regula-tion. Contrasting stated and declared preferences shows that both sources can be complementary, and their combination can provide a better under-standing of user behaviour. When analyzed individually, stated and revealed preference-based analysis has limitations. A combined analysis of stated and revealed preferences adopts an innovative approach which helps to partially overcome these limitations. At the same time, informa-tion problems which occur in the policy-making process can be partially improved adopting this approach. It is often these informational problems which affect the efficient functioning of the market with respect to infra-structure services. It is important to have a better understanding of consumer behaviour so as to improve regulation during the design and implementation stages. It should also promote increasing consumer con-fidence to take advantage of the potential benefits that arise due to competition and liberalization. The empirical work here focused on Spain in the context of the reform of EU-wide regulatory policies. This analysis is part of a wider research project and focused on the evaluation of regu-latory reform in different countries and regions.
Implications for Regulatory Design: Effectiveness and Operation
Contrasting stated and revealed preferences reveals that both gas and internet are services that exhibit territorial accessibility problems. This problem does not exist in the case of water, since its lower cost is the explanatory factor for the lower spending in rural areas. Territorial acces-sibility is not a key aspect either in telephony services, as mobile phones increasingly substitute for fixed phone use and expenditure.
Revealed preference-based analysis shows relevant effects of individual related characteristics on expenditure on the universal services such as electricity and water. In general, a positive relation is observed between being a foreigner and expenditure on electricity and water, on the one hand, and between age and expenditure on water, on the other. In contrast, one-parent families are associated with lower expenditure on electricity and water. In telecommunications, where the possibility of choice is greater, fixed phone expenditure is directly related to age. This holds even when mobile telephony expenditure is included as an explanatory vari-able. Additional expenditure ranging between 2.4 and 2.6 Euros for each additional year is estimated. This age-related effect is greater in telecom-munications than in the other services. Moreover, the Eurobarometerdata shows that the older a person is, the more likely he/she will exhibit a pas-sive attitude towards telecommunications and experiences difficulty when comparing different offers between telecommunications firms. In addi-tion, when fixed and mobile phones are considered in tandem with each other, an inverse relation is observed between expenditure and educational attainment. Annual savings in telecommunications are estimated at 33 Euros for people that have received Further Education. This increases to 36 Euros for graduates and to 77 Euros for those studying advanced graduate studies. Educational attainment is not a relevant variable when explaining expenditure on services where there is less choice (electricity, water and gas). Moreover, the Eurobarometer data shows that individuals with lower educational attainments claim they have greater difficulties when compar-ing different options available among telecommunications firms. They also state that in the case of mobile telephony, a more passive attitude towards the service, lower satisfaction with contract conditions and lower perception of consumer interest protection.
with other effects estimated. First, inertia is important, through personal-related variables, explaining the use of substitutive services as fixed and mobile phones. Secondly, a family support effect is observed — there is less expenditure in households with a younger reference person — in the context of a Latino-Mediterranean Welfare State (Guillén and Álvarez 2004). Last but not least, the incidence of personal attributes such as employment or marital status on individual preferences is observed, reflected in expenditure on some services. The results obtained show a relationship between expenditure and certain personal-related variables. Many of these patterns are consistent with those derived from stated pref-erences. These results show how psychological and socio-economic elements affect consumer behaviour vis-à-vis infrastructure services. This reinforces the argument that better understanding the consumer from this perspective can improve regulatory quality.
Lessons for Regulators: What Works, What doesn’t?
Analysis of the development of infrastructure regulation over time, and the presentation of results after examining revealed and stated preferences support the argument that regulators would do well to design and imple-ment policies jointly based on competition policies (the supply-side perspective) in addition to consumer policies (the demand-side perspec-tive). Improved regulation, as a result of better understanding consumers, may help consumers in benefitting more from the potential advantages of liberalization and competition of services. Ideally, better regulation should diminish cases where citizens do not take the optimal decision when con-suming these services, such as inertia to switch.
and are affected by the social context surrounding them. Some fixed phone providers has begun to offer special discounts to particular groups such as the unemployed or foreigners. Spanish Telefónica has a tariff called “We Help You,” while Vodafone in Italy has a reduced tariff for foreigners. Clearly, these tariffs are not altruistic. Rather, they implement price dis-crimination in order to avoid losing customers, particularly in the prevailing times of crisis. In contrast, policy-makers are slow to implement new regulatory policies based on concepts such as consumer heterogene-ity and behavioural dimensions. Indeed, the current crisis only emphasises the importance of consumer’s social and economic situation, which when understood dynamically, can affect consumption patterns. Regulators should move more quickly, with different objectives to firms, to address issues of service consumption from the demand-side in order to improve regulatory quality and service consumption.
References
Australian Government, Productivity Commission (2007). Conference Behavioral Economics and Public Policy.8–9 August.
Australian Government (2008). Productivity Commission Inquiry into Australia’s Consumer Policy Framework.Available at http://www.treasurer.gov.au/DisplayDocs. aspx?pageID=&doc=pressreleases/2006/133.htm&min=phc.
Bacchiocchi, E, M Florio and M Gambaro (2008). Telecom Prices, Regulatory Reforms and Consumers’ Satisfaction: Evidence for 15 EU Countries. Working Paper, 2008–10, Dipartimento di Scienze Economiche Aziendali e Statistiche, Univertisá degli Studi di Milano.
Balanyá, B, A Doherty O Hoedeman, A Ma’anit and E Wesselius (2000), Europe Inc: Regional and Global Restructuring and the Rise of Corporate Power. London: Pluto Press. CEEP (European Centre of Enterprises with Public Participation and of Enterprises of General Economic Interest) and ETUC (European Trade Union Confederation) (2000).
Proposal for a Charter for Services of General Interest. Available at http://www.ceep. org/en/documents/ceep_projects_studies/charterSGI_En.pdf.
Clarke, J, J Newman, N Smith, E. Vilder and L Westmarland (2007).Creating Citizen-Consumers:Changing Publics and Changing Public Services. London: SAGE.
Clifton, J, F Comín and D Díaz-Fuentes (2003).Privatization in the European Union: Public Enterprise and Integration. Dordrecht: Kluwer.
Clifton, J, F Comín and D Díaz-Fuentes (2006). Privatization in the European Union: Ideological, Pragmatic, Inevitable? Journal of European Public Policy, 13(5), pp. 736–756. Clifton, J, F Comín and D Díaz-Fuentes (eds.) (2007).Transforming Public Enterprise in Europe and North America: Networks, Integration and Transnationalization. New York/London: Palgrave.
Clifton, J and D Díaz-Fuentes (2010). Evaluating EU Policies on Public Services: A Citizen’s Perspective.Annals of Public and Cooperative Economics, 81(2), pp. 279–306.
Clifton, J, D Díaz-Fuentes and J Revuelta (2010). The Political Economy of Incumbent Internationalization in the Single Market.Journal of European Public Policy,17(7) (In print).
DG SANCO (2008). How Can Behavioural Economics Improve Policies Affecting Consumers?, Conference held in Brussels, 28 November.
EC (1997).Eurobarometer 47.0: L´Europe des Consummateurs, Les Citoyens face a l´ouver-ture a la concurrence des monopoles de services public.Brussels: EC.
EC (2000).Communication on Services of General Interest in Europe.Brussels: EC. EC (2002).Eurobarometer 58: Consumers´ Opinions About Services of General Interest.
Brussels: EC.
EC (2003a).CCEB Eurobarometer European Consumers and Services of General Interest.
Brussels: EC.
EC (2003b). Green Paper on Services of General Interest. Brussels: EC. Available at http://www.europa.eu.int/eur-lex/en/com/gpr/2003/com2003_0270en01.pdf.
European Commission (EC) (2004).White Paper on Services of General Interest.Brussels: EC. Available at http://europa.eu.int/comm/secretariat_general/services_general_ interest/docs/com2004_374_en.pdf.
EC (2005).Eurobarometer 219.Brussels: EC.
EC (2006).Eurobarometer Special: Services of General Interest, Nº260, Wave 65.3.Brussels:
EC.
EC (2007a). Communication from the Commission to the Council, the European Parliament and the European Economic and Social Committee, EU Consumer Policy strategy 2007–2013. Empowering consumers, enhancing their welfare, effectively pro-tecting them. Available at http://ec.europa.eu/consumers/overview/cons_policy/ doc/EN_99.pdf on Accessed 15 August 2009.
EC (2007b).Eurobarometer 260.Brussels: EC.
Eurostat (Statistical Office of the European Communities) (2009). Household Budget Surveys.Available at http://europa.eu.int/estatref/info/sdds/en/hbs/hbs_base.htm. Federal Trade Commission (2007). Behavioural Economics and Consumer Policy.
Conference sponsored by the Bureau of Economics Federal Trade Commission. New Jersey, 20 April.
Fiorio, CV and M Florio (2008). Do you Pay a Fair Price for Electricity? Consumers’ Satisfaction and Utility Reform in the EU.Working Paper, 2008–12, Dipartimento di Scienze Economiche Aziendali e Statistiche, Univertisá degli Studi di Milano.
Fletcher, A (2008). What do Policy-makers Need from Behavioural Economists?”
Unpublished paper delivered at the DG SANCO Conference “How can Behavioural Economics Improve Policies Affecting Consumers?” Brussels, 28 November.
Frei, BS and A Stutzer (2002). What Can Economists Learn from Happiness Research?
Journal of Economic Literature, XL, pp.402–435.
Galambos, L (2000). State-owned Enterprises in a Hostile Environment: The U.S. Experience. In The Rise and Fall of State-Owned Enterprise in the Western World,
Toninelli, PA (ed.), pp. 273–302. Cambridge: Cambridge University Press.
Goldstein, A (2007). Multinational Companies from Emerging Economies. New York: Palgrave Macmillan.
Guillén, A and S Álvarez (2004). The EU’s impact on the Spanish Welfare State: The Role of Cognitive Europeanisation. Journal of European Social Policy, 14(3), pp. 285–299.
Hermann, C, K Verhoest, M Andersson, T Brandt, I Hofbauer, T Schulten and C Thörnqvist (2007). Varieties and Variations of Public-service Liberalisation and Privatisation in Europe. Vienna: FORBA, Forschungs und Beratungsstelle Arbeitswelt. Hirschman, AO (1970). Exit, Voice, and Loyalty: Responses to Decline in Firms,
Organisations, and States. Cambridge MA: Harvard University Press.
Hood, C (2001). A Public Management for all Seasons?,Public Administration, 69(1), pp. 3–19.
INE (Instituto Nacional de Estadística) (2006). Encuesta de Presupuestos Familiares.
Madrid: INE.
Kahneman, D (2002). Maps of Bounded Rationality: A Perspective on Intuitive Judgement and Choice,Nobel Prize Lecture, 8 December.
Louis, VJ and S Rodrigues (2006).Les services d´intérêt économique général et l´Union européene. Brussels: Bruylantm.
Mangenot, M (ed.) (2005).Administrations publiques et services d’interêt général: quelle européanisation. Maastricht: European Institute of Public Administration.
McGuire, A (2002). Service Charters — Global Convergence or National Divergence? A Comparison of Initiatives in Australia, the United Kingdom and the United States.
Public Management Review, 4(1), pp. 493–524.
Mulholland, JP (2007). US perspective: Behavioural economics and the Federal Trade Commission, Working Paper Series, Westport63 Consulting.
OECD (2007). Roundtable on Demand-Side Economics for Consumer Policy Summary Report. Paris: OECD.
OECD (2008).Enhancing Competition in Telecommunication: Protecting and Empowering Consumers. Paris: OECD.
Prosser, T (ed.) (2005).The Limits of Competition Law: Markets and Public Services. Oxford: Oxford University Press.
Van de Walle, S (2006). The Impact of Public Service Values on Services of General Interest Reform Debates.Public Management Review, 8, pp. 183–205.