Application of GIS and Remote Sensing to Groundwater
Exploration in Al-Wala Basin in Jordan
Jawad T. Al-Bakri1, Yahya Y. Al-Jahmany2 1
Department of Land, Water and Environment, Faculty of Agriculture, The University of Jordan, Amman, Jordan 2
Department of Civil Engineering, College of Engineering, Majmaah University, Majmaah, Saudi Arabia Email: jbakri@ju.edu.jo, y.yaseen@mu.edu.sa
Received July 22, 2013; revised August 26, 2013; accepted September 27,2013
Copyright © 2013 Jawad T. Al-Bakri, Yahya Y. Al-Jahmany. This is an open access article distributed under the Creative Commons Attribution License, which permits unrestricted use, distribution, and reproduction in any medium, provided the original work is properly cited.
ABSTRACT
Exploration of groundwater in countries with scarce water resources requires the implementation of effective tools that save time and money. In this study, geographic information systems (GIS) tools and remote sensing data were used to prepare and analyze digital layers of lithology, geological structure, drainage and topography to detect the most pro- mising sites for groundwater exploration in an arid basin in Jordan. A separate map of existing wells was intersected with the generated maps to calculate the percentage of wells in each interval of density and count of lineaments and drainage. Different GIS functions of intersection and spatial query were then applied to produce the final map for the most promising sites for groundwater exploration. The possibility of using digital classification of remote sensing data for mapping the most promising sites for groundwater exploration was also investigated by applying unsupervised clas- sification to a Landsat ETM+ image. Results showed that spatial distribution of the most promising sites for groundwa- ter exploration was dependent on the interrelated factors of lithology, topography and geologic structure. The most promising sites were distributed within 4% of the study area. The highest percentage of groundwater wells was within the alluvial and wadi sediments, which were accurately detected by the digitally classified ETM+. The study showed that remote sensing and GIS provided efficient tools for mapping promising sites for groundwater exploration. However, the data of groundwater wells would contribute to refining the final locations of the most promising sites.
Keywords: GIS; Remote Sensing; Groundwater; Jordan
1. Introduction
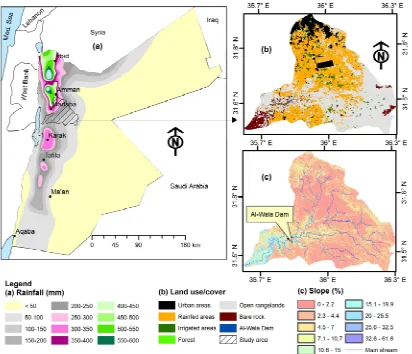
Development of water resources represents a challenge for planners and decision-makers in countries with high population growth and water scarcity. In Jordan, the problem of water scarcity is being faced in all sectors and the current share of water is extremely low (145 m3 per capita per year), as the country is dominated by an arid climate with low annual rainfall (Figure 1) [1]. There- fore, a considerable part of the agricultural production in the country depends on the available groundwater re- sources. The estimated safe annual yield from all renew- able groundwater is 275 million cubic meters (MCM) while the annual withdrawal is 418 MCM [2]. The non- renewable fossil aquifers are also providing 143 MCM per year for the coming 50 years [3].
At a population growth of 2.4%, an obvious increase in water demand is expected and the problem of water shortage will worsen with time [2,3], particularly under
the adverse impacts of the expected climate change in the near future [3]. Without developing water resources, the expected annual water deficit will reach 488 and 769 MCM in years 2030 and 2050, respectively [3].
Currently, groundwater provides more than 45% of the total water resources in Jordan. The development of groundwater resources requires studies and surveys that identify areas with high potential for exploration to an- ticipate the inevitable geophysical surveys, which are expensive and time consuming. Groundwater exploration, however, has many problems such as the paucity of ex- isting data and the high cost of data gathering [4]. There- fore, the integration of geologic and hydrogeological surveys with remote sensing data and geographic infor- mation systems (GIS) can contribute efficiently to these studies [4-6].
Figure 1. Location of the study area (a) and its land use/cover (b) and topography (c).
for creating maps of geological structures [4,13,14]. Maps of lithology, slope and drainage patterns can be also extracted from remote sensing data of aerial pho- tography and medium to high resolution satellite imagery, depending on the scale of the study and the available re- sources. Conversion of maps into digital layers will en- able the analysis of these maps by GIS tools. Implemen- tation of spatial functions, query and intersection will produce maps of potential locations for groundwater ex- ploration, based on different criteria that integrate maps of lineaments, topography, and lithology.
One approach for identifying potential sites for groundwater exploration is based on analyzing length density, frequency of lineament and drainage lines den- sity to reflect different probabilities of groundwater po- tential in various parts of the area under consideration [7-9]. This approach was used in Jordan to identify pro- mising sites with high potential for groundwater explora- tion [8,15]. Another approach for identifying these pro- mising sites is based on analyzing hydro-geomorpho- logical conditions to locate potential zones for ground- water recharge after applying a qualitative classification
to the final map [11,14]. Reference [16] showed that this approach was useful in identifying areas for artificial recharge of groundwater, known as managed aquifer recharge (MAR).
In this study, remote sensing techniques and GIS tools are implemented to identify sites for groundwater explo- ration in Al-Wala basin in Jordan. The study aims to identify promising sites for groundwater exploration based on hydrogeological data. Also, it adds to the pre- vious studies and efforts in Jordan by correlating loca- tions with high potential with spectral classes derived from the digital classification of remotely sensed data of Landsat Enhanced Thematic Mapper Plus (ETM+). In terms of GIS approach, the study utilizes ground data to refine the selection of sites based on groundwater yield of the existing wells.
2. Study Area
2.1. Location and Climate
The basin has a flat topography in the east and steep slopes in the west. Altitude of study area varies from 321 m below sea level at the eastern shoreline of the Dead Sea (lowest point on earth) to 997 m in the eastern parts of the study area.
The basin is dominated by an arid Mediterranean cli- mate with relatively cold winters and hot summers. The mean monthly air temperature ranges from 6˚C in Janu- ary up to 22˚C in August, with a mean annual air tem- perature of 15.0˚C. With exception to northwestern parts, the mean annual rainfall is 100 - 200 mm, occurring mainly during winter season (October-April). The mean annual potential evaporation ranges from 1600 mm in the western parts to 2000 mm in the east and 2200 mm at the outlet near the Dead Sea. In terms of land use, about 47% of the basin is used as open rangelands. Agricultural ac- tivity is also taking place in the basin where rainfed cul- tivation of wheat and barley is practiced in 38% of the basin (Figure 1). Irrigated areas form 3% of the total area of the basin, while 7% of the basin is urban.
2.2. Geology
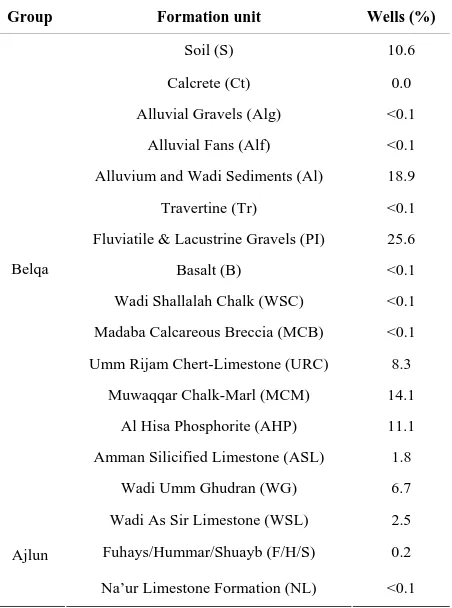
[image:3.595.61.287.432.736.2]The basin is characterized by the strata of Belqa group and partly of Ajlun group (Table 1). The groups are mainly dominated by cretaceous carbonate rocks that
Table 1. Lithostratigraphic units and formations of the study area with percentage wells in each formation.
Group Formation unit Wells (%)
Soil (S) 10.6
Calcrete (Ct) 0.0
Alluvial Gravels (Alg) <0.1
Alluvial Fans (Alf) <0.1
Alluvium and Wadi Sediments (Al) 18.9
Travertine (Tr) <0.1
Fluviatile & Lacustrine Gravels (PI) 25.6
Basalt (B) <0.1
Wadi Shallalah Chalk (WSC) <0.1
Madaba Calcareous Breccia (MCB) <0.1
Umm Rijam Chert-Limestone (URC) 8.3
Muwaqqar Chalk-Marl (MCM) 14.1
Al Hisa Phosphorite (AHP) 11.1
Amman Silicified Limestone (ASL) 1.8 Belqa
Wadi Umm Ghudran (WG) 6.7
Wadi As Sir Limestone (WSL) 2.5
Fuhays/Hummar/Shuayb (F/H/S) 0.2 Ajlun
Na’ur Limestone Formation (NL) <0.1
outcrop in most of the study area [17]. The oldest rock that outcrops in the study area is the upper Wadi As Sir Limestone (WSL) formation, deposited in an agitated marine environment, from the Turonian age. The lower part is composed of marl, marly limestone, coquina, mic- rite, sand and dolomicrite with chert nodules that has an average thickness of 62 m. The upper part is composed of limestone, dolomitic limestone and fossiloferous lime- stone with an average thickness of about 4.5 m [18].
An abrupt change in sedimentation resulting from an extensive Coniacian marine transgression marks the base of Belq group where a predominantly chalky unit of Wadi Umm Ghudran (WG) formation of Coniacian- Santonian age overlies Ajlun group. This formation con- sists of Mujib Chalk, brecciated dolomitic limestone, and Dhiban Chalk with fish teeth outcropping all over the basin area. The formations of Belqa group include Al Hisa Phoshorite formation (AHP), (Campanian age), which consists of dark grayish chert, marly limestone and phosphate, and the Muwaqqar Chalk Marl formation (MCM) (Maastrichtian age), which consists of marl and chalk with chalky and micritic limestone concretions. Also, it includes Madaba Calcareous Breccia (MCB) (M. Eocene age), which consists of brecciated and partly conglomeratic clasts of phosphate, limestone, chert and chalk in a mudstone matrix located on hills, slopes and along some wadis in Madaba area.
The geology of the study area has some unique forma- tions that include basaltic flows of Pleistocene, as vol- canic tuffs restricted to the upper courses of Wadi Al Haidan. Quaternary Superficial Deposits (Pleistocene age) of Fluviatile and Lacustrine Gravels (PI) cover most of the wadis of the basin, particularly in the east. Aridic soils are dominating the low rainfall zones, while dark brown Mediterranean soils are dominating the high rain- fall zones.
2.3. Hydrogeology
Groundwater of the basin flows from the eastern and northern highlands towards south and west till it reaches its downstream in the Dead Sea (Figure 2). Drainage pattern in the study area is modified by the direction of topographic displacement caused by the major faults so that it is directed towards faulted areas. The main wadis flow only in winter season and are directed ultimately westwards (Figure 1). The most important aquifers in the area are those within the upper cretaceous of Amman- Wadi As Sir Limestone formations, with the intervening Wadi Umm Ghudran and overlaying Muwaqqar Chalk Marl formations, forming aquicludes [17,18].
Figure 2. Major geological structures, groundwater wells and direction of groundwater movement in Al-Wala basin.
1) Amman-Madaba, which is the main recharge sys- tem in the basin that includes the northwestern mountains in the basin. Groundwater of this recharge system flows southwards to Wadi Al-Wala and Al-Haidan (Figure 2). 2) Libb-Thiban, in which groundwater flows from the east and south towards Al-Haidan and through Al-Wala main stream.
Ground water is the main source of water that is util- ized for agriculture and municipal uses. The official re- cords of Ministry of Water and Irrigation (MWI) for year 2010 show that the study area has 590 groundwater wells [19]. Fourteen springs are found in the downstream area in Al-Haidan. Water extracted from springs is used for both irrigation and domestic purposes.
Groundwater of the basin is highly important as water is pumped from Al-Haidan groundwater wells to supply drinking water to Madaba and southern parts of Amman. The MWI constructed Al-Wala dam, which became op- erational in the year 2003, to improve groundwater re- charge. The current capacity of the dam is 9 MCM and the stored water is naturally and artificially recharging groundwater of Al-Haidan and other wells that are util- ized for drinking and irrigation.
The future plan of MWI is to raise the height of the dam to store 26 MCM. The water will mainly be utilized for groundwater recharge in Al-Haidan and in the up- stream area in the middle and the southern parts of the basin. Also, about 6 MCM will be utilized for irrigating fodder crops in the Jordan Valley [20]. Therefore, iden- tifying the areas with high potential for groundwater ex- ploration is of high importance for supporting agricul- tural activities in the area and for developing drinking water resources for the cities of Madaba and Amman.
3. Methodology
The methodology of this study was based on two ap- proaches. The first was based on GIS, where layers of lithology, drainage patterns and lineaments were used to derive the most promising sites for groundwater explora- tion, as described by References [5,8]. Additionally, data on water quality and quantity were used to verify sites for groundwater exploration. The second part of the stu- dy was based on digital image processing (DIP) of re- mote sensing data to identify the spectral class that was highly correlated with the sites identified by the GIS tools. The first approach is based on the hypothesis that lineaments and drainage patterns would be the most im- portant factors for evaluating the potential concentration of water in the fracture zone aquifer, while the second approach was proposed as a rapid method with minimum inputs for groundwater exploration. The following sec- tions describe the methodology in more details.
3.1. Data Collection and Preparation
Hard copy maps of geology, topography and hydrology, covering the study area at a scale of 1:50,000, were ac- quired, scanned and geo-referenced in GIS. A satellite image of Landsat 7 ETM+ covering study area, except a small part in the east, was downloaded from the USGS website. The ETM+ imagery data which were used in this study included the visible (1, 2 and 3), the shortwave infrared (SWIR), the middle infrared (MIR) and the pan- chromatic bands. The spatial resolutions for these bands were 30 m for the visible to infrared and 15 m for the panchromatic. Geometric correction was carried out for the image using ground control points (GCP’s) collected by a global positioning system (GPS). In total, fifteen points were used to correct the image using a second order transformation and the nearest neighbor resampling method [21].
A digital elevation model (DEM) at 30 m resolution, available from the data of the Advanced Spaceborne Thermal Emission and Reflection Radiometer (ASTER), was downloaded from the website of the provider (http:// asterweb.jpl.nasa.gov/gdem.asp). The DEM was used to generate a layer of streams network of the basin. The layer was overlaid over the geo-referenced topographic maps in GIS to correct the positional shifts. Line smooth- ing functions were also applied and manual editing was carried out for some of the streams which were either incorrectly delineated or had positional shifts. Data edit- ing and improvement were also carried out for the layer of lineaments features (faults) using the panchromatic band of the ETM+, which was utilized to increase the details of this GIS layer.
included the coordinates of wells, salinity of water and yield of well in cubic meters per hour (m3/h). The yield was classified into three intervals following the criteria of the MWI for groundwater wells used in irrigation. The intervals were 35 m3/h or less for low, 35 - 70 m3/h for the medium and above 70 m3/h for the high yield. The spreadsheet was transferred into a point layer in GIS and included the records for 560 wells.
3.2. Application of GIS
The output digital maps included layers of lineaments, stream (drainage) network and lithological formations with all attributes associated with each layer. Figure 2
shows the lineament map, produced from this stage, and included all types of faults and strikes in the study area. The digital map of lineament was analyzed within GIS to identify types of structures in relation to ground water existence. Following this stage, all maps were rasterized to derive count (per·km2) and length density (m/km2) for both lineaments and stream network. Each of the output maps was reclassified into a new map with ten equal in- tervals of count and density.
The map of wells was intersected with the density maps of lineaments and drainage lines. The intersection results were then summarized in spreadsheets to calculate percentages of wells within each density interval of structure lines and drainage patterns. The same procedure of intersection was applied to determine the number and percentage of wells in each lithological unit. The inter- vals of count and density with maximum number of wells and the units of lithology were intersected to identify possible sites for groundwater exploration based on data of both medium and high yield wells. The output sites were based on the existence of 50% of wells or more within an interval or two for the medium and high yield groundwater wells. Wells with high levels of water salin- ity were excluded from the analysis. The final map was refined after considering altitudes, derived from the DEM, with maximum occurrence of medium and high yield of groundwater wells.
3.3. Application of Remote Sensing
The ETM+ imagery was transformed into three Principal Components (PC’s), known as “Eigen Channels”, which accounted for all variations of the selected bands of the ETM+. This was mainly performed to reduce data auto- correlation and dimensionality into fewer interpretable bands [21,22]. The unsupervised image classification was then applied to the output PC’s using the Iterative Self-Organizing Data Analysis Technique (ISODATA) clustering algorithm to group the ETM+ grey levels into fewer classes, which were then identified in relation to lithological units using the existing geological maps and
field visits.
The overall accuracy of the classification was assessed through a confusion matrix [21] by comparing a number of random points of classified pixels with existing geo- logical maps and ground data. The output layer from the digital classification was intersected with the layer of the promising sites of groundwater wells to identify the class where most of these sites were located. The unsupervised classification was used as a rapid method that would automatically identify all possible spectral classes that corresponded to lithological formations in the study area. Therefore, results from DIP were intersected with results from GIS analysis of layers of lineaments and streams to assess the degree of agreement between the two methods.
4. Results and Discussion
4.1. Lithology and Geological Structures
Results of intersecting the maps of wells and lithological formations are summarized in Table 1. Results showed that less than 26% of the wells were distributed in the fluviatile and lacustrine gravels, while about 19% of the wells in the study area existed in Alluvium and sur- rounding Wadi sediments (Table 1).
The intersection results also showed that about 76% of wells in the above mentioned formations were character- ized by medium and high water yields. These results agreed with References [7,23] who found that most po- tentially excellent aquifers were found in valleys with thick sand or gravels covers. In Jordan, results of this study also confirmed the findings of References [8,15] who concluded that wells with high yield were found in thick coarse grained alluvial materials. These formations were expected to act as conduits for groundwater from deep to shallow aquifers. Therefore, most of the wells with good yield were found in these formations.
Analysis of lithological formation showed that struc- ture features were observed above ground with consid- erable displacements found in Paleozoic formations. These were totally or partially absent in Mesozoic or Cretaceous lithological formations. This could be attrib- uted to the stronger effect of stresses and faulting on older rock formations, as explained by Reference [5]. The stresses caused a deformation in the rock layers and produced geological structures that were identified and mapped as lineaments on the ETM+ imagery. Summary of the major fault in the study area is shown in Table 2.
Table 2. Major fault groups in the study area.
Fault group name Description
Wadi Zarqa Main Fault Linear strike slip fault changes from a reverse to normal while moving from east to west.
Rumeil Fault Normal fault extending for about 9 km with a downthrown of about 250 m near Wadi Rumeil area.
Wadi Al-Wala Normal and reverse sets of faults with a downthrown to the south.
Az-Zafaran
A strike slip fault with dextral movement, starts with a reverse displacement and changes to a normal while moving from east to west. Displacement is more than 150 m near the desert highway where Muaqqar chalk
marl is faulted against Amman Silicified Limestone formation.
Wadi Al Falij Numerous small faults trending northeast-southwest in marble deposits.
imagery. All these structures were expected to form zones of high permeability layers which would recharge groundwater aquifers.
4.2. Distribution of Wells within Count and Density Intervals
Results showed that wells with high yield were mainly located in Al-Haidan in the downstream area, while wells with low and medium yields were distributed all over the study area (Figure 3). Results of intersecting wells with counts and densities of lineaments and streams are pre- sented in Table 3. In terms of lineaments count, wells were mainly found within the intervals of low count. Although this was unexpected, however it could be at- tributed to the fact that the lineaments count was already very low (less than 3.4 lineaments per km2). On the other hand, the relationship between lineaments density and groundwater wells showed that 50% of groundwater wells were located within the lowest density interval. This could be explained by factor of topography, as many of the low and medium yield wells were located in flat areas in the northern part of the study area (Figure 3), where geological structures were not detected. In this part of the study area slope was less than 2% which would promote water infiltration and groundwater re- charge [8,24]. In addition to topography, the high rainfall and the lithological formations (Holocene-recent alluvial and wadi sediments) enhanced groundwater recharge.
Although a considerable number of wells were found in the northern parts of the study area, however, most of the wells were characterized by low or medium yield. The high yield wells, on the other hand, were mainly within the moderate to high density of lineaments in the middle parts of the study area or in the low lineament density in the downstream area. In the middle parts of the study area, the high densities of lineaments were acting as points of groundwater recharge. In both locations, 69% of the wells were located in areas with an altitude of 650 - 750 m above sea level. None of the wells with high yield, on the other hand, occurred in altitudes of more than 750 m. This could be attributed to the direction of groundwater movement which was towards the south-
western parts of the study area (Figure 2). Similar find- ings of the impacts of topography on groundwater re- charge were also indicated by References [11,15].
The combined impacts of topography, the high density of lineament and the alluvial deposits resulted in the presence of high yield wells in the middle parts of the study area around the main stream of Al-Wala. These results agreed with References [8,15] which indicated strong relationships between lineament density and loca-tions of groundwater wells. In this study, none of the medium to high yield wells occurred in intervals that succeeded 5725 m/km2 (Interval 6) (Table 3).
Querying groundwater wells with the map of drainage density showed that most of the groundwater wells were within the intervals of moderate drainage count and den- sity (Table 3). The medium yield wells were mainly lo- cated within interval 5, while the high yield wells were mainly located within interval 4. Generally, drainage pattern is a reflection of the infiltration/precipitation ratio. This ratio is also controlled largely by permeability, which is in turn a function of the rock type and fracturing of the underlying rock or surface bedrock [7]. When comparing two terrain types, the one that contains the greatest drainage density is usually less permeable [7]. Therefore, this fact would imply that in groundwater ex- ploration it would be important to combine the lineament map with drainage and lithological formations maps to identify the target sites of groundwater exploration, as explained in the next section. By this, variations in lithol- ogy, geologic history and response of bedrocks to stress- es from folding to fracturing would be considered in groundwater exploration.
4.3. Intersection of Maps for Identifying Promising Sites
Results of intersecting the intervals of lineament and drainage count and density with the lithology and altitude are presented in Figure 4. The output of intersection presents the locations of promising sites for groundwater exploration. The map includes two classes that present medium and high probability sites based on the data of
Figure 3. Distribution of groundwater wells within the layers of lineament count (a); lineament density (b); stream count (c) and stream density (d).
Table 3. Percent of wells within the different intervals of lineament and stream counts (per·km2) and densities (m/km2).
Interval Lineament count
Wells (%)
Lineament density
Wells (%)
Stream count
Wells
(%) Stream density
Wells (%)
1 0.00 - 0.34 36.7 0 - 954 50.3 0.00 - 0.75 1.3 0 - 866 1.9
2 0.34 - 0.67 12.2 954 - 1908 20.2 0.76 - 1.49 4.3 867 - 1733 5.6
3 0.68 - 1.02 20.5 1909 - 2862 12.0 1.50 - 2.24 8.0 1734 - 2599 15.7
4 1.02 - 1.35 9.6 2863 - 3816 7.2 2.25 - 2.98 14.7 2600 - 3466 33.1
5 1.36 - 1.68 12.2 3817 - 4770 5.3 2.99 - 3.73 24.5 3467 - 4332 23.2
6 1.69 - 2.02 5.3 4771 - 5725 3.7 3.74 - 4.47 28.0 4333 - 5199 13.1
7 2.03 - 2.36 2.4 5726 - 6679 0.8 4.48 - 5.22 14.9 5200 - 6065 5.6
8 2.37 - 2.70 0.5 6680 - 7633 0.3 5.23 - 5.96 3.2 6066 - 6931 1.6
9 2.71 - 3.03 0.5 7634 - 8587 0.0 5.97 - 6.71 0.8 6932 - 7798 0.5
[image:7.595.58.538.556.736.2]Figure 4. Locations of promising sites for groundwater ex- ploration in Al-Wala based on the intersection of linea- ments, lithology, drainage and altitude.
Results from this GIS approach showed that promising sites for groundwater exploration were distributed in dif- ferent parts of the study area. However, most of the high yield sites were in the middle part of the study area on the main stream of Al-Wala. This part of the study area, mainly located within the formations of the fluviatile and lacustrine gravels (PI), was characterized by medium density of lineaments and streams, with altitudes ranging between 680 to 710 m. A small area of high yield was predicted in the southwestern part of the study area near Al-Wala dam. This area was classified as a high yield site due to its lower altitude and its occurrence on allu- vial deposits (PI) with relatively moderate lineament densities (2863 - 3816 m/km2).
The medium yield sites, on the other hand, were mainly distributed within the alluvium and wadi sedi- ments (Al) and at altitudes range of 750 - 850 m. In terms of areas, the high yield sites had a total area of 26 km2 while the medium yield sites had a total area of 50 km2. These figures represent 1.4% and 2.6% of the study area for both high and medium yield sites, respectively.
4.4. Digital Classification of ETM+
Initial results of the unsupervised classification of the first three PC’s, which accounted for all variations in the ETM+ image, produced a layer with ten spectral classes. The output layer (Figure 5) was compared with the map of lithological formations in the study area, and subse- quently the final number of classes in the output layer was merged to 5, after considering class separation using
Figure 5. Distribution of alluvial formations and the most promising sites for groundwater exploration within the spectral classes of the unsupervised classification of the ETM+ image.
the method of transformed divergence [21]. Table 4
summarizes the final classes and the major lithological units represented by each class. Classification accuracy varied from one class to another, with an overall accu- racy of 76%. The variation in class accuracy was mainly attributed to the spectral mixing between classes and the accuracy of the original geologic maps.
Distribution of groundwater wells within the classified PC image (Table 4) showed that about 28% of ground- water wells were mainly located within class 5, repre- senting alluvial formations and mapped with high accu- racy. This figure was very close to results obtained from map intersection within GIS, which showed that 30% of groundwater wells were located within the alluvial for- mations.
Results showed that 71% and 52% of the promising sites for medium and high yield, respectively, were lo- cated within class 5. Also, 65% of the alluvial formations were located within this class. Therefore, outputs from digital classification would provide important thematic layers that could serve the purpose of identifying prom- ising sites for groundwater exploration in basins similar to Al-Wala, particularly in locations where digital layers of geology might not be available. Other factors and data, however, should complement the DIP techniques. This was evident by the results of this study as the outputs from the unsupervised classification were not related to promising locations in the downstream area, where to- pography and lineament density were the main factors in identifying promising sites for groundwater exploration.
5. Conclusions and Recommendations
[image:8.595.305.539.82.271.2]Table 4. Lithological description of the major classes produced from the unsupervised classification of principal components and the percentage of wells in each class.
Class Description Lithological Formations Mapping Accuracy (%) Wells
+
(%)
Wells* (%)
1 Lithologic formations of late Cretaceous. WG, ASL, AHP, MCM 73.8 29.8 33.7
2 Ajlun Group formations from Cenomanian to Turonian. NL, F/H/S, WSL 68.9 7.5 2.7
3 Lithologic formations of the Pleistocene sediments of
the geologic age, middle to upper Belqa Group. PI, Tr 66.7 20.7 25.6
4 Lithologic formations of Tertiary (middle part of Belqa Group). URC, MCB, WSC, B 70.8 14.1 8.3
5 Holocene-Recent alluvial and wadi sediments. Al, Alf, Alg, S 95.0 27.9 29.5
+
Based on intersection with thematic classes of unsupervised classification; *Based on intersection with lithological map (Table 1).
GIS tools and remote sensing data in identifying promis- ing sites for groundwater exploration. The study pro- vided an example that integrated real data on groundwa- ter quantity and quality to refine the selection of the tar- get sites. These data showed that sites with possible high yield were related to moderate intervals of lineament and stream densities. The other important data that affected the spatial distribution of the promising sites were lithol- ogy and topography. The study showed that GIS tools were very useful in refining the intervals of lineament and stream densities and in identifying the most promis- ing sites based on data of existing groundwater well. Remote sensing data, on the other hand, could provide important information on geology and topography. There- fore, these tools and data sources would be recommended for groundwater exploration, as they would provide timely and cost effective tools for identifying and nar- rowing the target areas for groundwater exploration be- fore carrying out further investigations.
6. Acknowledgements
This publication was supported by the NATO’s Science for Peace Program, project SfP-983368 (2009-2012) “Assessment and monitoring of desertification in Jordan using remote sensing and bioindicators”.
REFERENCES
[1] “Annual Report of Jordan Meteorological Department,” JMD (Jordan Meteorological Department), Amman, 2010.
[2] “Water for Life: Jordan’s Water Strategy 2008-2022,” MWI (Ministry of Water and Irrigation), Amman, 2009. [3] J. T. Al-Bakri, M. Salahat, A. Suleiman, M. Suifan, M. R.
Hamdan, S. Khresat and T. Kandakji, “Impact of Climate and Land Use Changes on Water and Food Security in Jordan: Implications for Transcending ‘The Tragedy of the Commons’,” Sustainability, Vol. 5, No. 2, 2013, pp. 724-748. http://dx.doi.org/10.3390/su5020724
[4] A. Shaban, “Support of Space Techniques for Groundwa- ter Exploration in Lebanon,” Journal of Water Resource
and Protection, Vol. 2 No. 5, 2010, pp. 469-477. http://dx.doi.org/10.4236/jwarp.2010.25054
[5] R. M. Teeuw, “Groundwater Exploration Using Remote Sensing and a Low-Cost Geographical Information Sys- tem,” Hydrogeology Journal, Vol. 3, No. 3, 1995, pp. 21- 30. http://dx.doi.org/10.1007/s100400050057
[6] C. Travaglia and O. Ammar, “Groundwater Exploration by Satellite Remote Sensing in the Syrian Arab Repub- lic,” FAO Publications, Rome, 1998.
[7] A. Edet, C. Okereke, S. Teme and E. Esu, “Application of Remote Sensing Data to Groundwater Exploration: A Case Study of the Cross River State, Southeastern Ni- geria,” Hydrogeology Journal, Vol. 6, No. 3, 1998, pp. 394-404. http://dx.doi.org/10.1007/s100400050162 [8] A. El-Naqa, N. Hammouri, K. Ibrahim and M. El-Taj,
“Integrated Approach for Groundwater Exploration in WadiAraba Using Remote Sensing and GIS,” Jordan Journal of Civil Engineering, Vol. 3, No. 3, 2009, pp. 229-243.
[9] I. A. Dar, K. Sankar and M. A. Dar, “Remote Sensing Technology and Geographic Information System Model- ing: An Integrated Approach Towards the Mapping of Groundwater Potential Zones in Hardrock Terrain, Ma- mundiyar Basin,” Journal of Hydrology, Vol. 394, No. 3-4, 2010, pp. 285-295.
http://dx.doi.org/10.1016/j.jhydrol.2010.08.022
[10] M. Gupta and P. K. Srivastava, “Integrating GIS and Re- mote Sensing for Identification of Groundwater Potential Zones in the Hilly Terrain of Pavagarh, Gujarat, India,” Water International, Vol. 35, No. 2, 2010, pp. 233-245. http://dx.doi.org/10.1080/02508061003664419
[11] N. Hammouri, A. El-Naqa and M. Barakat, “An Inte- grated Approach to Groundwater Exploration Using Re- mote Sensing and Geographic Information System,” Journal of Water Resource and Protection, Vol. 4 No. 9, 2012, pp. 717-724.
http://dx.doi.org/10.4236/jwarp.2012.49081
[12] S. Mukherjee, “Role of Satellite Sensors in Groundwater Exploration,” Sensors, Vol. 8, No. 3, 2008, pp. 2006- 2016. http://dx.doi.org/10.3390/s8032006
[14] S. Ganapuram, G. T. Vijaya Kumar, M. Krishna, E. Ka- hya and M. Cüneyd Demirel, “Mapping of Groundwater Potential Zones in the Musi Basin Using Remote Sensing Data and GIS,” Advances in Engineering Software, Vol. 40, No. 7, 2009, pp. 506-518.
http://dx.doi.org/10.1016/j.advengsoft.2008.10.001 [15] A. Al-Dababseh “An Integrated Approach to Groundwa-
ter Exploration of Northern Wadi Araba Basin Using Remote Sensing and Geographic Information System,” MSc Thesis, The University of Jordan, Amman, 2003. [16] M. Alraggad and H. Jasem, “Managed Aquifer Recharge
(MAR) through Surface Infiltration in the Azraq Basin/ Jordan,” Journal of Water Resource and Protection, Vol. 2 No. 12, 2010, pp. 1057-1070.
http://dx.doi.org/10.4236/jwarp.2010.212125
[17] NRA (Natural Resources Authority, Jordan), “Geological Map of Madaba, Sheet 3153 II, Scale 1:50000,” National Geological Mapping Project 1988-1990, NRA, Amman, 1992.
[18] N. Al-Hunjul, “The Geology of Madaba Area,” Natural Resources Authority Press, Jordan, 1995.
[19] MWI (Ministry of Water and Irrigation, Jordan), 2010.
http://www.mwi.gov.jo/mwi/homepage.aspx
[20] MWI (Ministry of Water and Irrigation, Jordan), “Sus- tainable Fodder Crop Production,” MWI, Jordan Valley Authority (JVA), Community Action Plan of the Badia Restoration Program (BRP), Ministry of Environment, Jordan, 2013.
[21] J. R. Jensen, “Introductory Digital Image Processing: A Remote Sensing Perspective,” 3rd Edition, Prentice Hall, Upper Saddle River, 2005.
[22] R. A. Schowengerdt, “Remote Sensing: Models and Me- thods for Image Processing,” 3rd Edition, Academic Press, London, 2006.
[23] F. El-Baz, “Groundwater Concentration beneath Sand Fi- elds in the Western Desert of Egypt: Indications by Radar Images from Space,” Egyptian Journal of Remote Sensing and Space Sciences, Vol. 1, 1999, pp. 1-24.
[24] N. S. Rao, “Groundwater Potential Index in a Crystalline Terrain Using Remote Sensing Data,” Environmental Ge- ology, Vol. 5, No. 7, 2006, pp. 1067-1076.