http://dx.doi.org/10.4236/ojmi.2016.62005
How to cite this paper: Murase, K., Kusakabe, Y. and Miyazaki, S. (2016) Quantitative Assessment of the Effect of Nitric Oxide Synthase Inhibition on Tumor Vascular Activity Using Dynamic Contrast-Enhanced Computed Tomography. Open Journal of Medical Imaging, 6, 42-52. http://dx.doi.org/10.4236/ojmi.2016.62005
Quantitative Assessment of the Effect of
Nitric Oxide Synthase Inhibition on Tumor
Vascular Activity Using Dynamic
Contrast-Enhanced Computed Tomography
Kenya Murase
*, Yoshinori Kusakabe, Shohei Miyazaki
Department of Medical Physics and Engineering, Division of Medical Technology and Science, Faculty of Health Science, Graduate School of Medicine, Osaka University, Osaka, Japan
Received 16 April 2016; accepted 20 June 2016; published 23 June 2016
Copyright © 2016 by authors and Scientific Research Publishing Inc.
This work is licensed under the Creative Commons Attribution International License (CC BY).
http://creativecommons.org/licenses/by/4.0/
Abstract
Purpose: The purpose of this study was to develop a method to quantitatively assess the effect of nitric oxide synthase (NOS) inhibition on tumor vascular activity using dynamic contrast-enhanced computed tomography (DCE-CT) and to investigate its usefulness using animal experiments. Mate-rials and Methods: The DCE-CT studies were performed in anesthetized Fisher rats bearing tumors using a 4-row multi-slice CT. The scanning started 4 s before a bolus injection of iodinated contrast agent (CA) (150 mgI/kg) from the tail vein using an automatic injector and lasted 60 s at 1-s in-tervals. The contrast enhancement (CE) images were generated by subtracting the CT images be-fore and after the administration of CA. First, the DCE-CT studies were performed bebe-fore and 15, 30, and 45 min after administration of N-nitro-L-arginine (L-NNA) (1, 3, and 10 mg/kg) or vehicle, and the relative CE values were calculated by normalizing the CE image at each time point by that obtained from the first DCE-CT study. Second, we investigated the case when L-arginine (L-ARG) (200 mg/kg) and L-NNA (1, 3, and 10 mg/kg) were administered after the first and second DCE-CT studies, respectively. Third, we investigated the case when L-NNA (1, 3, and 10 mg/kg) and L-ARG (200 mg/kg) were administered after the first and second DCE-CT studies, respectively. Finally, we investigated the case when L-NNA (1, 3, and 10 mg/kg) and L-ARG (200 mg/kg) were administered simultaneously after the first DCE-CT study. Results: The relative CE value significantly decreased after L-NNA administration in a dose-dependent manner (p-values = 0.0074 and <0.0001 for 0 vs. 3 mg/kg and 0 vs. 10 mg/kg, respectively, at 15 min, 0.0003 and <0.0001 for 0 vs. 3 mg/kg and 0 vs. 10 mg/kg, respectively, at 30 min, and 0.0367 and 0.0004 for 0 vs. 3 mg/kg and 0 vs. 10 mg/kg, respectively, at 45 min). When L-ARG was administered prior to the administration of 1 mg/kg L-NNA, the relative CE value at 45 min was significantly higher than that at 15 min. When L-ARG
was administered after L-NNA administration, there was no significant difference between the relative CE values at 15 min and 45 min. These results suggest that when using L-NNA in combina-tion with L-ARG, their effect on tumor vascular activity differs depending on the order of their ad-ministration. When L-NNA and L-ARG were administered simultaneously, there was a tendency for the relative CE value to be higher than that when only L-NNA was administered, at all injected doses of L-NNA. Conclusion: Our method using DCE-CT is useful for monitoring the effect of NOS inhibition on tumor vascular activity and for determining the optimal injected dose and timing of NOS inhibitors for anticancer therapy.
Keywords
Nitric Oxide Synthase, N-Nitro-L-Arginine, L-Arginine, Tumor Vascular Activity, Dynamic Contrast-Enhanced Computed Tomography, Contrast Enhancement
1. Introduction
It has been reported that angiogenesis correlates with tumor growth, invasion, and metastasis [1]-[4]. Tumor blood flow increases as a result of angiogenesis, and it plays a key role in tumor growth and formation of me-tastasis [5].
Nitric oxide (NO) is a multifunctional gaseous molecule and a highly reactive free radical. It is synthesized from the substrate L-arginine (L-ARG), nicotinamide adenine dinucleotide phosphate (NADPH), and oxygen, catalyzed by mammalian enzyme: nitric oxide synthase (NOS). As a signaling molecule, NO regulates various physiological and pathophysiological processes such as vascular functions including angiogenesis, blood flow, vascular permeability, leukocyte-endothelial interaction, platelet aggregation, and microlymphatic flow [6]. If tumor blood flow and hence tumor oxygenation can be manipulated by altering NO availability, this would pro-vide a novel approach to enhancing the efficacy of conventional anticancer therapy. In particular, increasing tu-mor hypoxia brought about by reduced tutu-mor blood flow could enhance the activity of bioreductive cytotoxic agent [7], hyperthermia [8], and some chemotherapeutic agents [9]. Competitive inhibition of NOS using ana-logues of L-ARG results in a decrease in tumor blood flow as a result of vasoconstriction [10]. Therefore, NO is an attractive target for anticancer therapy.
The NOS inhibitor N-nitro-L-arginine (L-NNA) has been shown to selectively reduce tumor blood flow in tumor-bearing BD9 rats [10]. In human beings, inhibition of NOS resulted in a reduction in tumor blood volume [11]. Because of the importance of NO in vasodilation, neuronal signaling, platelet aggregation, and many other physiological functions, there has been considerable research effort to better understand mechanisms responsible for regulation and activation of NOS. To the best of our knowledge, however, development of a method that al-lows us to quantitatively and simply evaluate the effect of NOS inhibition on tumor vascular activity has not been yet carried out sufficiently.
Dynamic contrast-enhanced computed tomography (DCE-CT) acquires CT images serially after the adminis-tration of intravenous contrast agent (CA). Recently, DCE-CT has become a major imaging technique and has been widely used for diagnosing normal tissue and benign and malignant tumors as well as for monitoring treatment effectiveness during and after therapy [12] [13]. Perfusion CT using DCE-CT is a technology that enables depiction of tumor vascular physiology [14]. In addition to the widespread availability of CT scanners and being noninvasive and fast, perfusion CT can be repeated sequentially to assess temporal changes in tumor blood flow, which is likely to be of clinical importance for monitoring tumor response to antiangiogenic thera-pies and other treatments [12] [13].
The purpose of this study was to develop a method to quantitatively monitor the effect of NOS inhibition on tumor vascular activity using DCE-CT and to investigate its usefulness using animal experiments.
2. Materials and Methods
2.1. Animal Experiment Protocol
A total of 90 male Fischer 344 rats (8 weeks old) weighing 250.0 ± 22.4 g [mean ± standard deviation (SD)] were used. They were purchased from Charles River Laboratories Japan, Inc. (Yokohama, Japan). The animals had free access to food and water, and were kept under standard laboratory conditions of 23˚C room temperature and around 50% humidity. Minced MTLn3 mammary adenocarcinoma with approximately 1 × 10⁶ cells was implanted subcutaneously in the right thigh or hip of the rat. The rats were used for experiments several weeks after implantation when all three orthogonal diameters of tumors measured approximately 10 mm, including skin thickness.
2.2. DCE-CT Protocol
The rat was anesthetized with 50 mg/kg sodium pentobarbital (Nembutal, Dainippon-Sumitomo Seiyaku Co., Ltd., Osaka, Japan) and was placed in a prone position on the patient couch of the CT scanner. The rat was fur-ther restrained to a plastic board using surgical tape to prevent any unnecessary motion. A 26-gauge cannula was catheterized into the tail vein for the intravenous injection of CA or other drugs.
The DCE-CT studies were performed using a 4-row multi-slice CT (Asteion, Toshiba Medical Systems Co., Tochigi, Japan). For selection of the appropriate transverse level for DCE-CT studies, unenhanced scout scan-ning through the tumors was performed with a tube voltage of 120 kV and a tube current of 80 mA. After selec-tion of the transverse level, the DCE-CT studies were performed with the same tube voltage and tube current used for scout scanning. The matrix size was 512 × 512 and a field of view (FOV) was 90 mm × 90 mm. Four slices with a thickness of 3 mm were acquired with a gantry rotation speed of 1 s. For the DCE-CT study, CT scanning was initiated 4 s before administration of CA. The 4-s duration before the administration of CA al-lowed for the acquisition of unenhanced baseline images. A bolus of 150 mgI/kg iodinated CA [Iopamiron 300 (300 mgI/mL), Bayer Schering Pharma, Osaka, Japan] was administered at a rate of 0.125 mL/s via the 26- gauge tail vein catheter using an automatic injector of our own manufacture. Dynamic scanning lasted 60 s, and transverse images were reconstructed at 1-s intervals, resulting in 60 consecutive images per slice.
2.3. Generation of Contrast Enhancement Images
[image:3.595.217.412.445.670.2]The DCE-CT data include both the images before and after the administration of CA. Figure 1 illustrates how to generate the images representing the contrast enhancement (CE). They were generated by subtracting the CT
images before and after the administration of CA. The images before the administration of CA were obtained by averaging the first 5 images from the start of scanning, whereas the images after the administration of CA were obtained by averaging the images between 50 s and 60 s. We call the new images generated by subtracting the CT images “the CE images”.
2.4. Study Design
We performed 5 studies illustrated inFigure 2 to investigate the effects of L-NNA alone, L-ARG alone, and their combination on tumor vascular activity. L-NNA and L-ARG were purchased from Sigma Chemical Co. (St. Louis, MO, USA).
In Study 1, L-NNA or vehicle (saline acidified with a few drops of hydrochloric acid) was administered by intravenous bolus injection into a catheterized tail vein 5 min after the first DCE-CT study. The second, third, and fourth DCE-CT studies were performed 15 min, 30 min, and 45 min after the administration of L-NNA or vehicle. This time schedule for DCE-CT studies was determined based on the results of our previous study [15]. The injected dose of L-NNA was varied as 0 mg/kg (vehicle) (n = 8), 1 mg/kg (n = 6), 3 mg/kg (n = 6), and 10 mg/kg (n = 13). These doses were selected in reference to Tozer et al. [10].
In Study 2, L-ARG (200 mg/kg) controlled at the neutral pH was administered 5 min after the first DCE-CT study (n = 5). The second, third, and fourth DCE-CT studies were performed 15 min, 30 min, and 45 min after the administration of L-ARG, respectively.
In Study 3, L-ARG (200 mg/kg) was administrated 5 min after the first DCE-CT study and L-NNA was ad-ministrated immediately after the second DCE-CT study. The second, third, and fourth DCE-CT studies were performed 15 min, 30 min, and 45 min after the administration of L-ARG, respectively. In this case, the injected dose of L-NNA was varied as 1 mg/kg (n = 5), 3 mg/kg (n = 6), and 10 mg/kg (n = 5).
In Study 4, L-NNA was administered 5 min after the first DCE-CT study and L-ARG was administered im-mediately after the second DCE-CT study. The injected dose of L-NNA was varied as 1 mg/kg (n = 5), 3 mg/kg (n = 5), and 10 mg/kg (n = 7), whereas that of L-ARG was fixed at 200 mg/kg.
In Study 5, both L-NNA and L-ARG were administered simultaneously 5 min after the first DCE-CT study. As in Study 3 and Study 4, the injected dose of L-NNA was varied as 1 mg/kg (n = 5), 3 mg/kg (n = 8), and 10 mg/kg (n = 6), whereas that of L-ARG was fixed at 200 mg/kg.
Figure 2. Study protocol. DCE-CT: dynamic contrast-enhanced computed tomography, L-NNA: N-nitro-L-arginine, and
[image:4.595.167.462.437.696.2]2.5. Data Analysis
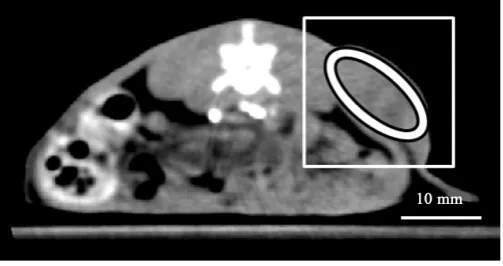
[image:5.595.189.441.561.694.2]Regions of interest (ROIs) were manually drawn on tumors in all slices (four slices) in each rat as illustrated in
Figure 3. To draw ROIs, we selected the regions in which the tumor demonstrated the maximal enhancement
(tumor rim) to avoid adjacent normal and necrotic areas.
The relative CE value (CErel) in the tumor ROI after administration of agents was calculated as follows:
after
before
rel
CE CE
CE
= (1)
where CEbefore and CEafter represent the CE value before and after administration of agents, respectively. These analyses were performed for the DCE-CT data acquired before and 15 min, 30 min, and 45 min after administra-tion of agents.
2.6. Statistical Analysis
Data were represented as mean ± standard error (SE). The paired Student’s t-test was used to test the significant difference in the relative CE value versus the baseline. Differences in the relative CE values among groups were analyzed by one-way analysis of variance (ANOVA). Statistical significance was determined by Tukey’s mul-tiple comparison test. A p-value less than 0.05 was considered significant.
3. Results
First, we investigated the effect of L-NNA on the CE in the tumor in comparison with that of vehicle (Study 1).
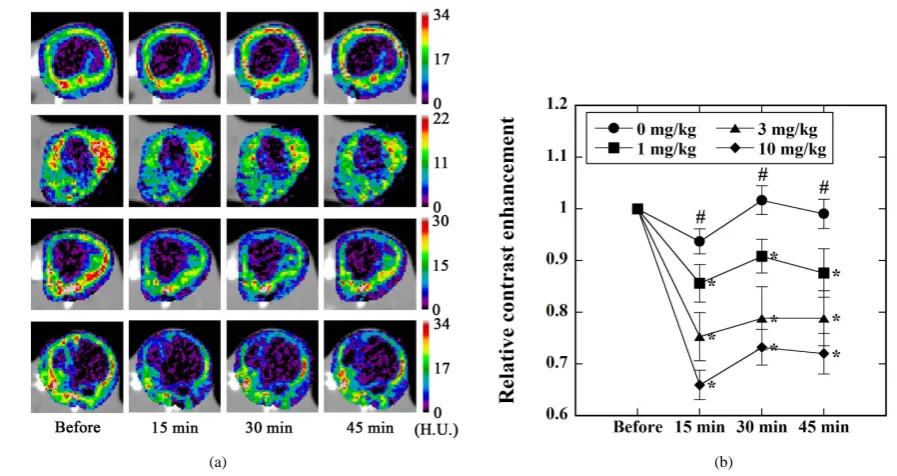
Figure 4(a)shows typical examples of the CE images before and 15 min, 30 min, and 45 min after vehicle or
L-NNA administration when the injected dose of L-NNA was 0 mg/kg (vehicle) (top row), 1 mg/kg (second row), 3 mg/kg (third row), and 10 mg/kg (bottom row). Figure 4(b) shows the relative CE values calculated from Equation (1) before and 15 min, 30 min, and 45 min after vehicle or L-NNA administration (● for 0 mg/kg, i.e., vehicle, ■ for 1 mg/kg, ▲ for 3 mg/kg, and ♦ for 10 mg/kg). As shown by * in Figure 4(b), when L-NNA was administered, the relative CE value significantly decreased as compared with that before the administration of L-NNA in a dose-dependent manner. The decrease in the relative CE value was the largest at 15 min after L- NNA administration. On the other hand, when the vehicle was administered, there were no significant differ-ences as compared with the baseline. As shown by # inFigure 4(b), when the injected dose of L-NNA was 3 mg/kg and 10 mg/kg, the relative CE values were significantly lower than those in the case when the vehicle was administered, at 15 min, 30 min, and 45 min.
Second, we investigated the effect of L-ARG on the CE in the tumor (Study 2).Figure 5(a) shows a typical example of the CE images before and 15 min, 30 min, and 45 min after L-ARG administration, whereas Figure 5(b)shows the relative CE values before and 15 min, 30 min, and 45 min after L-ARG administration. Although there was a tendency for the relative CE values to decrease with time, the CE values after L-ARG administration showed no significant differences as compared with those before L-ARG administration [Figure 5(b)], indicat-ing that L-ARG alone has no effect on the CE in the tumor.
Figure 3. Illustration of a region of interest (ROI) drawn on the tumor rim (white ellipse). Note that a white square
(a) (b)
Figure 4.(a) Typical example of the CE images before and 15 min, 30 min, and 45 min after the administration of vehicle
(top row) and L-NNA at doses of 1 mg/kg (second row), 3 mg/kg (third row), and 10 mg/kg (bottom row) in Study 1 (Figure 2). H.U. stands for Hounsfield Unit; (b) Relative CE values before and 15 min, 30 min, and 45 min after the administration of vehicle (●, n = 8) and L-NNA at doses of 1 mg/kg (■, n = 6), 3 mg/kg (▲, n = 6), and 10 mg/kg (♦, n = 13) in Study 1 (Figure 2). Data are represented as mean ± standard error (SE) and are normalized by those before vehicle or L-NNA ad-ministration. *: p < 0.05 versus the values before vehicle or L-NNA administration when analyzed by paired Student’s t-test. #: p < 0.05 between ● and ▲ and between ● and ♦ when analyzed by one-way analysis of variance (ANOVA).
(a) (b)
Figure 5. (a) Typical example of the CE images before and 15 min, 30 min, and 45 min after the administration of L-ARG in Study 2 (Figure 2). The injected dose of L-ARG was fixed at 200 mg/kg. H.U. stands for Hounsfield Unit; (b) Relative CE values before and 15 min, 30 min, and 45 min after the administration of L-ARG in Study 2 (Figure 2). The injected dose of L-ARG was fixed at 200 mg/kg. Data are represented as mean ± SE for n = 5 and are normalized by those before L-ARG administration.
Third, we investigated the case when L-ARG was administered prior to the administration of L-NNA (Study
3). Figure 6(a)shows typical examples of the CE images before and 15 min, 30 min, and 45 min after the
[image:6.595.102.534.410.593.2](a) (b)
Figure 6.(a) Typical example of the CE images before and 15 min, 30 min, and 45 min after the administration of L-ARG in
Study 3 (Figure 2). The injected dose of L-ARG was fixed at 200 mg/kg, whereas that of L-NNA was varied as 1 mg/kg (top row), 3 mg/kg (middle row), and 10 mg/kg (bottom row). H.U. stands for Hounsfield Unit; (b) Relative CE values before and 15 min, 30 min, and 45 min after the administration of L-ARG in Study 3 (Figure 2). The injected dose of L-ARG was fixed at 200 mg/kg, whereas that of L-NNA was varied as 1 mg/kg (●, n = 5), 3 mg/kg (■, n = 6), and 10 mg/kg (▲, n = 5). *: p < 0.05 versus the values before L-ARG administration when analyzed by paired Student’s t-test. #: p < 0.05 between ● and ▲
when analyzed by ANOVA.
dose of L-NNA was 1 mg/kg, the relative CE value significantly decreased as compared with the baseline 15 min after L-ARG administration, but it recovered almost to the baseline 45 min after L-ARG administration. When the injected dose of L-NNA was 3 mg/kg, the relative CE value significantly decreased as compared with the baseline at 15 min and 30 min, but it slightly increased and a significant difference versus the baseline dis-appeared at 45 min. When the injected dose of L-NNA was 10 mg/kg, the relative CE value significantly de-creased as compared with the baseline at 30 min and 45 min. As shown by # inFigure 6(b), there was a signifi-cant difference in the relative CE value between cases administered 1 mg/kg and 10 mg/kg L-NNA, at 45 min.
Fourth, we investigated the case when L-NNA was administered prior to the administration of L-ARG (Study
4). Figure 7(a)shows typical examples of the CE images before and 15 min, 30 min, and 45 min after L-NNA
at doses of 1 mg/kg (top row), 3 mg/kg (middle row), and 10 mg/kg (bottom row) were administered.Figure 7(b)shows the time courses of the relative CE values for various injected doses of L-NNA (● for 1 mg/kg, ■ for 3 mg/kg, and ▲ for 10 mg/kg). As inFigure 4(b), the relative CE value significantly decreased as compared with that before the administration of L-NNA in a dose-dependent manner, except for the case administered 1 mg/kg L-NNA [shown by * inFigure 7(b)]. When the injected dose of L-NNA was 1 mg/kg, a significant dif-ference versus the baseline disappeared at 30 min and 45 min. As shown by # inFigure 7(b), there was a sig-nificant difference in the relative CE value between cases administered 1 mg/kg and 10 mg/kg L-NNA, at 15 min.
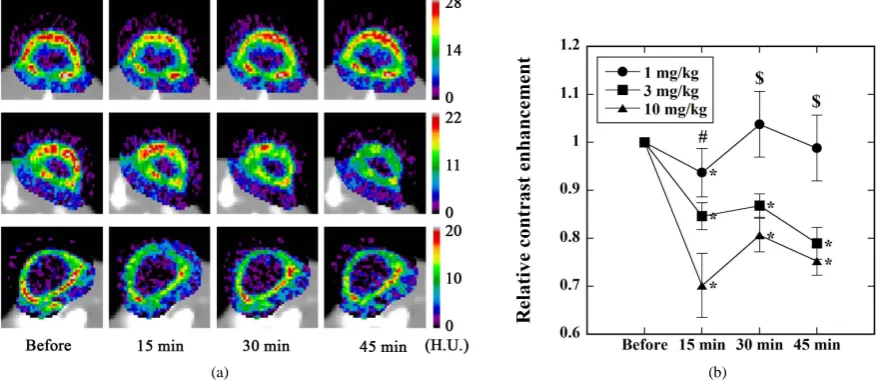
Finally, we investigated the case when both L-NNA and L-ARG were administered simultaneously (Study 5).
Figure 8(a) shows typical examples of the CE images before and 15 min, 30 min, and 45 min after the
simulta-neous administration of L-NNA and L-ARG when the injected dose of L-NNA was 1 mg/kg (top row), 3 mg/kg (middle row), and 10 mg/kg (bottom row). Figure 8(b) shows the time courses of the relative CE values for various injected doses of L-NNA (● for 1 mg/kg, ■ for 3 mg/kg, and ▲ for 10 mg/kg). As shown by * inFigure 8(b), when the injected dose of L-NNA was 1 mg/kg, the relative CE value significantly decreased as compared with the baseline at 15 min, but it recovered to the baseline and a significant difference versus the baseline dis-appeared at 30 min and 45 min. When the injected dose of L-NNA was 3 mg/kg and 10 mg/kg, the relative CE value significantly decreased as compared with the baseline at 15 min, 30 min, and 45 min. As shown by # in
Figure 8(b), there was a significant difference in the relative CE value between cases administered 1 mg/kg and
(a) (b)
Figure 7.(a) Typical example of the CE images before and 15 min, 30 min, and 45 min after the administration of L-NNA in
Study 4 (Figure 2). The injected dose of L-ARG was fixed at 200 mg/kg, whereas that of L-NNA was varied as 1 mg/kg (top row), 3 mg/kg (middle row), and 10 mg/kg (bottom row). H.U. stands for Hounsfield Unit; (b) Relative CE values before and 15 min, 30 min, and 45 min after the administration of L-NNA in Study 4 (Figure 2). The injected dose of L-ARG was fixed at 200 mg/kg, whereas that of L-NNA was varied as 1 mg/kg (●, n = 5), 3 mg/kg (■, n = 5), and 10 mg/kg (▲, n = 7). *: p < 0.05 versus the values before L-NNA administration when analyzed by paired Student’s t-test. #: p< 0.05 between ● and ▲
when analyzed by ANOVA.
(a) (b)
Figure 8.(a) Typical example of the CE images before and 15 min, 30 min, and 45 min after the simultaneous
administra-tion of L-NNA and L-ARG in Study 5 (Figure 2). The injected dose of L-ARG was fixed at 200 mg/kg, whereas that of L-NNA was varied as 1 mg/kg (top row), 3 mg/kg (middle row), and 10 mg/kg (bottom row). H.U. stands for Hounsfield Unit; (b) Relative CE values before and 15 min, 30 min, and 45 min after the simultaneous administration of L-NNA and L-ARG in Study 5 (Figure 2). The injected dose of L-ARG was fixed at 200 mg/kg, whereas that of L-NNA was varied as 1 mg/kg (●, n = 5), 3 mg/kg (■, n = 8), and 10 mg/kg (▲, n = 6). *: p < 0.05 versus the values before L-NNA and L-ARG ad-ministration when analyzed by paired Student’s t-test. #: p < 0.05 between ● and ▲ when analyzed by ANOVA. $: p < 0.05 between ● and ■ and between ● and ▲ when analyzed by ANOVA.
4. Discussion
[image:8.595.95.537.373.565.2]injected doses and/or timing of NOS inhibitors.
To elucidate what the CE image reflects, we previously compared the CE image with the tumor blood flow (TBF), tumor blood volume (TBV), and mean transit time (MTT) images generated using model-independent deconvolution analysis and investigated the correlations among the CE, TBF, TBV, and MTT values in tumors [15]. Our results showed that the correlation coefficient between CE and TBV was the greatest, suggesting that the CE mainly reflects TBV [15]. In general, model-independent deconvolution analysis has been used to eva-luate the hemodynamics of CA in normal tissue and benign and malignant tumors [16]. Model-independent de-convolution analysis always needs the arterial input function (AIF), which derives from the concentration of CA in the feeding artery. However, it is often difficult to obtain the appropriate AIF especially in small animal expe-riments, because the CT images of the feeding artery are likely to be degraded by partial volume effect [17] and artifacts due to pulsation and/or respiratory motion. In addition, the thick vessels connecting the feeding artery are not always imaged in the slice of the tumor. In contrast, the CE images used in this study can be obtained without using the AIF and can be obtained simply by subtracting the CT images before and after the administra-tion of CA.
In this study, we investigated the effects of L-NNA alone, L-ARG alone, and their combination on the tumor vascular activity using the relative CE values obtained by DCE-CT. As shown inFigure 4, the relative CE value significantly decreased below the baseline level by L-NNA administration in a dose-dependent manner. This finding is consistent with the results reported previously [10] [11]. Tozer et al.[10] reported that the maximum decrease in tumor blood flow rate was achieved at L-NNA dose of 1 mg/kg and no further reduction was achieved by increasing the L-NNA dose to 3 and 10 mg/kg. In this study, however, further reduction of the rela-tive CE value was achieved at L-NNA doses of 3 and 10 mg/kg (Figure 4). Tozer et al. [10] used BD9 rats bearing subcutaneous P22 carcinosarcoma, whereas we used Fischer 344 rats bearing MTLn3 mammary adeno-carcinoma. Thus, the above difference between the results of Tozer et al.[10] and ours may be due to the dif-ference in tumor cell lines and/or the strain of rats used in experiments.
When L-ARG (natural substrate for NOS) was administered at a dose of 200 mg/kg, the relative CE values 15 min, 30 min, and 45 min after L-ARG administration showed no significant differences as compared with that before the administration (Figure 5). Tozer et al. [10] reported that L-ARG had no significant effect on tumor blood flow when the same dose with ours was used. Thus, our finding shown in Figure 5is consistent with their report [10]. In this study, however, there was a tendency for the relative CE value to decrease with time after L-ARG administration although the decrease was not statistically significant (Figure 5). It might be due to the steal effect that is observed when a vasodilator such as hydralazine is administered [18]. That is, if normal ves-sels dilated after L-ARG administration and tumor vesves-sels did not respond, more blood would flow to the nor-mal tissues and less to the tumor [18].
We also investigated the effect of L-NNA on the CE in the tumor when used in combination with L-ARG. As shown in Figure 6(b), when L-ARG was administrated prior to the administration of 1 mg/kg L-NNA, the rela-tive CE value at 45 min was significantly higher than that at 15 min, indicating that the reduction in the relarela-tive CE value induced by L-NNA administration was restored by the prior administration of L-ARG. In contrast, when L-ARG was administered after L-NNA administration [Figure 7(b)], there was no significant difference between the relative CE values at 15 min and 45 min. These results suggest that when using L-NNA in combi-nation with L-ARG, their effect on the tumor vascular activity differs depending on the order of their adminis-tration. Meyer et al.[19] reported that the reduction in microvascular perfusion induced by NOS inhibition was restored by subsequent administration of L-ARG in normal tissues but not in tumors. The irreversibility of the vascular effect of NOS inhibition in tumors could be due to endothelial damage and development of micro-thrombi resulting from platelet aggregation and leukocyte adhesion. Thus, the above finding could be explained by this irreversibility of NOS inhibition.
When both L-NNA and L-ARG were administered simultaneously [Figure 8(b)], there was a tendency for the relative CE value to be higher than that when only L-NNA was administered, at all injected doses of L-NNA
[Figure 4(b)]. Although the above difference in the relative CE value did not reach statistical significance due to
large scattering of the data, these results suggest that the vascular effect of NOS inhibition induced by L-NNA was somewhat (not significantly) reduced by the simultaneous administration of L-ARG.
automatic injector of our own manufacture as previously described, and it would be essential to use an automatic injector in the present method.
It is known that iodinated CAs themselves are vasoactive and can induce both vasodilation and vasoconstric-tion [20]. Limbruno et al.[21] reported that nonionic CAs induce a vasodilatory response in normal vessels not by a mechanism involving increased flow or NOS, but rather by depending on preserved vascular cyclooxyge-nase activity. However, the mechanisms responsible for the above vasomotor effects remain to be fully eluci-dated [20]. In addition, vascular beds of different organs and tumors respond differently to CAs and interspecies variations also exist [20]. From the fact that there were no significant changes in the relative CE values when only the vehicle was administered [● inFigure 4(b)], the vasomotor effect of CA itself might be small in this study.
Recently, dynamic contrast-enhanced magnetic resonance imaging (DCE-MRI) has also been used for study-ing the microvascular characteristics of tumors [22] [23]. Although DCE-MRI provides spatial and temporal resolution comparable to DCE-CT and does not involve the use of ionizing radiation, it has some disadvantages. Whereas the change in the CT number is directly proportional to the change in the concentration of CA for DCE-CT, for DCE-MRI the relationship breaks down at high concentrations of certain CAs leading to errors of physiologic parameters [24]. To investigate the usefulness of our method in comparison with DCE-MRI will be one of the subjects of our future studies.
5. Conclusion
The present study suggests that our method using DCE-CT is useful for monitoring the effect of NOS inhibition on tumor vascular activity and for determining the optimal injected dose and timing of NOS inhibitors for anti-cancer therapy.
Acknowledgements
The authors are grateful to Prof. Nariaki Matsuura for his help in implanting tumor cells into rats. The authors are also grateful to Mr. Atsushi Tachibana and Ms. Risa Matsuura for their help in animal experiments.
Conflict of Interest
The authors report no conflicts of interest.
References
[1] Folkman, J. (1971) Tumor Angiogenesis: Therapeutic Implications. New England Journal of Medicine, 285, 1182- 1186. http://dx.doi.org/10.1056/NEJM197111182852108
[2] Weidner, N., Semple, J.P., Welch, W.R. and Folkman, J. (1991) Tumor Angiogenesis and Metastasis-Correlation in Invasive Breast Carcinoma. New England Journal of Medicine, 324, 1-4.
http://dx.doi.org/10.1056/NEJM199101033240101
[3] Wiggins, D.L., Granai, C.O., Steinhoff, M.M. and Calabresi, P. (1995) Tumor Angiogenesis as a Prognostic Factor in Cervical Carcinoma. Gynecologic Oncology, 56, 353-356. http://dx.doi.org/10.1006/gyno.1995.1062
[4] Gasparini, G. and Harris, A.L. (1995) Clinical Importance of the Determination of Tumor Angiogenesis in Breast Car-cinoma: Much More than a New Prognostic Tool. Journal of Clinical Oncology, 13, 765-782.
[5] Folkman, J. (1996) New Perspectives in Clinical Oncology from Angiogenesis Research. European Journal of Cancer, 32A, 2534-2539. http://dx.doi.org/10.1016/S0959-8049(96)00423-6
[6] Fukumura, D., Satoshi, K. and Rakesh, K.J. (2006) The Role of Nitric Oxide in Tumour Progression. Nature Reviews, 6, 521-534. http://dx.doi.org/10.1038/nrc1910
[7] Stratford, I.J. (1992) Bioreductive Drugs in Cancer Therapy. British Journal of Radiology, 24, 128-136.
[8] Horsman, M.R., Christensen, K.L. and Overgaard, J. (1989) Hydralazine-Induced Enhancement of Hyperthermic Damage in a C3H Mammary Carcinoma in Vivo. International Journal of Hyperthermia, 5, 123-136.
http://dx.doi.org/10.3109/02656738909140442
[9] Teicher, B.A., Lazo, J.S. and Sartorelli, A.C. (1981) Classification of Antineoplastic Agents by Their Selective Toxici-ties towards Oxygenated and Hypoxic Tumor Cells. Cancer Research, 41, 73-81.
Reversi-ble with L-Arginine. Cancer Research, 57, 948-955.
[11] Ng, Q.S, Goh, V., Milner, J., Stratford, M.R., Folkes, L.K., Tozer, G.M., Saunders, M.I. and Hoskin, P.J. (2007) Effect of Nitric-Oxide Synthesis on Tumour Blood Volume and Vascular Activity: A Phase 1 Study. Lancet Oncology, 8, 111-118. http://dx.doi.org/10.1016/S1470-2045(07)70001-3
[12] Kan, Z., Phongkitkarun, S., Kobayashi, S., Tang, Y., Ellis, L.M., Lee, T.Y. and Charnsangavej, C. (2005) Functional CT for Quantifying Tumor Perfusion in Antiangiogenic Therapy in a Rat Model. Radiology, 237, 151-158.
http://dx.doi.org/10.1148/radiol.2363041293
[13] Hakime, A., Peddi, H., Hines-Peralta, A.U., Wilcox, C.J., Kruskal, J., Lin, S., de Baere, T., Raptopoulos, V.D. and Goldberg, S.N. (2007) CT Perfusion for Determination of Pharmacologically Mediated Blood Flow Changes in an Animal Tumor Model. Radiology, 243, 712-719. http://dx.doi.org/10.1148/radiol.2433052048
[14] Fourneir, L.S., Cuenod, C.A., de Bazelaire, C., Siauve, N., Rosty, C., Tran, P.L., Frija, G. and Clement, O. (2004) Ear-ly Modifications of Hepatic Perfusion Measured by Functional CT in a Rat Model of Hepatocellular Carcinoma Using a Blood Pool Contrast Agent. European Radiology, 14, 2125-2133. http://dx.doi.org/10.1007/s00330-004-2339-8
[15] Kusakabe, Y., Miyazaki, S., Tachibana, A., Matsuura, R., Matsuura, N. and Murase, K. (2009) Development of a Me-thod to Quantitatively Monitor the Effect of Inhibition of Nitric Oxide Synthase on Tumor Vascular Activity Using Dynamic Contrast-Enhanced Computed Tomography. Journal of Medical Engineering and Technology, 33, 460-469. http://dx.doi.org/10.1080/03091900902952642
[16] Østergaard, L., Weisskoff, R.M., Chesler, D.A., Gyldensted, C. and Rosen, B.R. (1996) High Resolution Measurement of Cerebral Blood Flow Using Intravascular Tracer Bolus Passages. Part I. Mathematical Approach and Statistical Analysis. Magnetic Resonance in Medicine, 36, 715-725. http://dx.doi.org/10.1002/mrm.1910360510
[17] Murase, K., Tachibana, A., Kusakabe, Y., Matsuura, R. and Miyazaki, S. (2008) A Method for Quantitative Assess-ment of Renal Function Using Dynamic Contrast-Enhanced Computed Tomography: Evaluation of Drug-Induced Nephrotoxicity in Rats. Medical Physics, 35, 5768-5776. http://dx.doi.org/10.1118/1.3020595
[18] Chaplin, D.J. (1989) Hydralazine-Induced Tumor Hypoxia: A Potential Target for Cancer Chemotherapy. Journal of
National Cancer Institute, 81, 618-622. http://dx.doi.org/10.1093/jnci/81.8.618
[19] Meyer, R.E., Shan, S., DeAngelo, J., Dodge, R.K., Bonaventura, J., Ong, E.T. and Dewhist, M.W. (1995) Nitric Oxide Synthase Inhibition Irreversibly Decreases Perfusion in the R3230Ac Rat Mammary Adenocarcinoma. British Journal
of Cancer,71, 1169-1174. http://dx.doi.org/10.1038/bjc.1995.228
[20] Morcos, S.K., Dawson, P., Pearson, J.D., Jeremy, J.Y., Davenport, A.P., Yates, M.S., Tirone, P., Cipolla, P., De Haen, C., Muschick, P., Krause, W., Refsum, H., Emery, C.J., Liss, P., Nygren, A., Haylor, J., Pugh, N.D. and Karlsson, J.O.G. (1998) The Haemodynamic Effects of Iodinated Water Soluble Radiographic Contrast Media: A Review.
Eu-ropean Journal of Radiology, 29, 31-46. http://dx.doi.org/10.1016/S0720-048X(98)00018-7
[21] Limbruno, U., Petronio, A.S., Amoroso, G., Baglini, R., Paterni, G., Merelli, A., Mariotti, R., De Caterina, R. and Ma-riani, M. (2000) The Impact of Coronary Artery Disease on the Coronary Vasomotor Response to Nonionic Contrast Media. Circulation, 101, 491-497. http://dx.doi.org/10.1161/01.CIR.101.5.491
[22] Tofts, P.S., Brix, G., Buckley, D.L., Evelhoch, J.L., Henderson, E., Knopp, M.V., Larsson, H.B., Lee, T.Y., Mayr, N.A., Parker, G.J., Port, R.E., Taylor, J. and Weisskoff, R.M. (1999) Estimating Kinetic Parameters from Dynamic Contrast-Enhanced T(1)-Weighted MRI of a Diffusable Tracer: Standardized Quantities and Symbols. Journal of
Magnetic Resonance Imaging, 10, 223-232.
http://dx.doi.org/10.1002/(SICI)1522-2586(199909)10:3<223::AID-JMRI2>3.0.CO;2-S
[23] Murase, K. (2004) Efficient Method for Calculating Kinetic Parameters Using T1-Weighted Dynamic Contrast-En- hanced Magnetic Resonance Imaging. Magnetic Resonance in Medicine, 51, 858-862.
http://dx.doi.org/10.1002/mrm.20022
[24] Judd, R.M., Reeder, B.S. and May-Newman, K. (1999) Effects of Water Exchange on the Measurement of Myocardial Perfusion Using Paramagnetic Contrast Agents. Magnetic Resonance in Medicine, 41, 334-342.