Development of Child-Friendly Fish Dishes to Increase
Young Children’s Acceptance and Consumption of Fish
*
Lyndsey R. Huss1, Sean D. McCabe2, Jennifer Dobbs-Oates3, John Burgess1, Carl Behnke4, Charles R. Santerre1, Sibylle Kranz1#
1Department of Nutrition Science, Purdue University, West Lafayette, USA; 2Department of Statistics, Purdue University, West La-fayette, USA; 3Department of Human Development and Family Studies, Purdue University, West Lafayette, USA; 4Department of Hospitality and Tourism Management, Purdue University, West Lafayette, USA.
Email: #kranz@purdue.edu
Received August 2nd, 2013; revised September 2nd, 2013; accepted September 9th, 2013
Copyright © 2013 Lyndsey R. Huss et al. This is an open access article distributed under the Creative Commons Attribution License, which permits unrestricted use, distribution, and reproduction in any medium, provided the original work is properly cited.
ABSTRACT
Background: The Dietary Guidelines for Americans 2010 recommend that Americans age two years and older
con-sume seafood, especially fish high in omega-3 polyunsaturated fatty acids, at least twice a week. Although fish is of particular importance during childhood to support proper brain and eye development, it is under-consumed in the US pediatric population. This study examined if substituting salmon for chicken would increase preschooler’s fish con-sumption. Methods: Two-to-five years old children (n = 45) were served eight lunches (four pairs of comparable chicken
versus salmon dishes) twice, totaling sixteen lunches over a period of three months to test the hypothesis that children will consume fish at least once a week, thus increasing docosahexaenoic acid (DHA) intake. The plate waste method was used to collect intake data and consumption of total energy and DHA intake in the chicken and the fish dishes were compared using contrasts within a mixed effect ANOVA (significance at P < 0.05). Results: Dietary intake estimates
showed that there were no significant differences in energy intake when the chicken and fish dishes looked similar (macaroni-and-cheese and wraps), but when the fish dishes looked new (nuggets and dumplings), energy intake on fish days was lower than on the chicken day. DHA intake increased significantly on all days the fish was served. Conclu-sions: This pilot study indicates that fish intake can meet recommendations if salmon is incorporated into familiar
dishes such as salad wraps or macaroni-and-cheese, in the childcare setting. Although fish is more expensive, childcare centers may serve this highly nutritious protein once a week without experiencing undue amounts of food wastes if in-corporated into well-accepted main dishes. Further studies in larger and more diverse samples of children, different ex-perimental dishes, and longer exposure periods may elucidate additional venues to increase children’s diet quality by increasing consumption of fatty fish.
Keywords: Fish Consumption; Salmon; Diet Quality; Young Children; Acceptance; Omega-3 PUFAs; DHA
1. Introduction
The polyunsaturated fatty acid (PUFA) known to be critical for brain and eye development, docosahexaenoic acid (DHA, 22:6n-3), supports nervous tissue growth and function, such as learning and memory [1,2]. The parent 18-carbon fatty acid, α-linolenic acid (ALA), can be converted to various long-chain omega-3 PUFAs, in-cluding eicosapentaenoic acid (EPA) and DHA. ALA is found in plant-based foods, with higher levels in soybean, canola, and flax seed oils. Another PUFA, the 18-carbon
omega-6 fatty acid linoleic acid (LA) is the precursor of omega-6 fatty acids and is abundant in modern food sup-plies, as it contributes more than 50% of all the fatty ac-ids in soybean, corn, safflower, and sunflower oils.
The conversion of ALA to DHA is very inefficient. Using compartment models, the conversion rate has been estimated to be less than 1% [3,4]. Also, measurement of peak or area-under-the-curve plasma contents of previ-ously labeled fatty acids showed that less than 8% of ALA is converted into EPA and less than 4% to DHA in men [5-8]; in women, less than 21% of ALA is converted to EPA and less than 9% to DHA [9]. Thus, consumption of dietary sources of DHA during the years of brain de- *This work was funded by the US Department of Agriculture,
Na-tional Institute of Food and Agriculture IND0-2010-01295.
velopment (up to age 25) [10] is critical for children’s cognitive functioning.
Once obtained from the diet, ALA can be metabolized to EPA, while LA is metabolized using the same en-zymes to the 20-carbon chain omega-6 fatty acid, ara-chidonic acid [11]. The pathway generally accepted for metabolism of EPA to DHA involves elongation of the fatty acid carbon chain to yield DHA [12]. In animals, an intake of 1% energy from LA, with an LA to ALA ratio of 2:1 or lower, supports high levels of DHA in the de-veloping brain [13,14]. However, high intakes of LA inhibit desaturation of ALA to EPA and DHA and reduce accretion of DHA in the brain, retina, and other organs [13-17]. This means that dietary omega-3 PUFAs, the amount and type of omega-3 PUFA (ALA and DHA), and high LA determine DHA accretion in the developing brain and retina. When omega-3 PUFA intake is inade-quate, DHA decreases and omega-6 fatty acids increase in the brain. Human milk and infant formulas now pro-vide more than 3% energy from LA, which suggests cir-culating levels and tissue levels of DHA will be low unless DHA is provided [2].
DHA is only found in animal tissue lipids, with fatty fish being the best dietary source. It is not present in plant sources (such as vegetable fats and oils, grains, nuts, and seeds), although those may provide other omega-3 PUFAs [2]. Because humans lack specific desaturases, they are unable to form omega-3 or omega-6 PUFAs de novo and must obtain these fatty acids from their diet [11]. DHA is the major omega-3 PUFA esterified in the glycerophospholipids that form the structural matrix of brain grey matter and retinal membranes [18,19]. There-fore, DHA accumulation in the brain and retina as well as in other organs depends on the amount and types of omega-3 PUFAs consumed in the diet. In addition, die-tary intake of omega-6 fatty acids plays a role, as omega-6 PUFA interact and compete with omega-3 PUFAs in the fatty acid metabolic pathway [13,15,20-24].
The in vivo conversion of ALA to DHA is not very ef-ficient, and the Dietary Guidelines for Americans 2010 recommend consuming more foods rich in EPA and DHA by eating seafood at least twice a week. Health- conscious parents strive to offer food sources of DHA to incorporate into their children’s diets but in most US regions fish consumption, especially intake of fatty fish, are very low and children may not accept fish into their diet easily.
Prenatal DHA availability is determined by maternal dietary DHA intake during pregnancy and has been shown to have a significant effect on quality of move-ment in seven-year-old children [25]. Prenatal DHA availability is critical for brain development in utero but also later in life. For that reason, DHA supplementation in infant formula is recommended as it has been shown
to lead to visual acuity and IQ maturation similar to that of breast-fed infants [26]. Even past the usual age of weaning, the brain is not fully developed. The frontal lobes of the brain, which are responsible for executive functions, develop in spurts between birth-to-two years of age, from seven-to-nine years of age, and in the mid- teenage years—up to the age of 25 years old [10]. Hence, adequate intake of DHA prior to adulthood is imperative to support healthy brain development and consumption of DHA-rich foods, such as fatty fish, is recommended for all Americans.
According to the Institute of Medicine report [27], it is recommended that 2 - 5 years old children consume two age-appropriate servings (1-to 2-ounce) of seafood per week. However, previous research has shown that fish consumption is less than adequate, especially when com- pared to pasta, a dish that is common in the Western diet. In a previous study [28], when pasta was served to 23 two-to-five year old children, intake was 81% greater than when fish was served. This is the case even for im-migrants from Asia that would normally have a high fish intake [29], but have been submersed into Western cul-ture. When assessing the dietary patterns of Korean ado-lescents, fish dishes such as kimchi, fish cake soup, and fish cutlets comprised the majority of meals, whereas Korean-American adolescents consumed a more typical American diet of milk, soda, hamburgers, etc. [29].
Despite the benefits of DHA in the diet, Western diets are low in omega-3 PUFAs, especially ALA found in plant oils and DHA found in fish [2]. According to the Institute of Medicine and National Academy of Sciences [30], the median intake of EPA and DHA in adults is 0.05% of dietary energy. Contrary to popular belief, even an individual meeting the estimated intake recommenda-tions for omega-3 PUFA intake may consume less than optimal amounts of DHA, if the majority of the omega-3 PUFAs are from plants. Consequently, this becomes an issue for the developing brain. Western diets low in omega-3 PUFAs and high in omega-6 fatty acids con-tribute to poor brain development and function [2]. By adding fatty fish to children’s diets, DHA intake would increase, and aid in the prevention of poor brain devel-opment. Dalton et al. [10] showed that when seven-to- nine year old children’s diets were supplemented with a fish-flour spread rich in omega-3 PUFAs, verbal learning ability and memory were improved. Thus, effective ways to encourage habitual consumption of a diet high in DHA are warranted.
based on body weight may result in suboptimal DHA amounts in 2 - 12 years old children because their DHA needs are higher relative to their body weight. In adult-hood, DHA needs are lower compared to the time from birth to age 25.
Once the importance of EPA and DHA was estab-lished, numerous alternative sources of omega-3 PUFAs were developed. The only natural sources of DHA are marine food sources, such as fish and seaweed, and their products, such as fish and algal oil. However, food com-panies have taken the initiative to incorporate DHA and other omega-3 PUFAs into foods such as breads, pastas, milk, eggs, processed meats, salad dressings, margarines, mayonnaise, peanut butters, pizzas, nutrition bars, cereals, yogurts, and juices [33]. Although the fortification with DHA for these processed foods is based on marine sources, such as fish or algal oils, there are many issues that should be considered. The bioavailability of the omega-3 PUFAs in synthetic form is understudied. Fur-thermore, foods with added DHA usually only contain 12 - 50 mg EPA and DHA combined. The average DHA amount consumed per one serving of these foods is 32 mg, which is equivalent to less than a teaspoon of salmon. With product claims such as “good source of DHA,” parents may become misled and confused. While the population seems to have accepted these synthetic sources of DHA and other omega-3 PUFAs, skepticism remains in the field of nutrition.
The Dietary Guidelines for Americans 2010 recom-mend consuming seafood at least twice a week. Based on the estimated intake of DHA in Americans, especially American children, the development of venues to in-crease fish consumption by offering child-friendly fish dishes is a critical public health concern. The present pilot study was designed to explore two modes of offer-ing fatty fish to 2 - 5 years old children—by incorporat-ing it in well-accepted dishes and by offerincorporat-ing novel dishes. The specific aims of this research were to 1) sub-stitute salmon for chicken without significantly affecting 2 - 5 years old children’s energy intake; and 2) increase children’s intake of DHA by offering salmon for lunch. We hypothesized that offering canned or cooked salmon to preschoolers during lunch at the childcare center would lead to children’s consumption of fish at least once a week.
2. Methods
2.1. Study Participants
Recruitment of participants was based upon attendance at the Ben and Maxine Miller Child Development Labora-tory School, a childcare center located at Purdue Univer-sity (West Lafayette, Indiana). As the unit of analysis was group-level average consumption, no individual
child was identified and all data were recorded and ana-lyzed for the group of participating children. Eligibility was restricted to children between the ages of 2 - 5 years; exclusion criteria included the presence of food restric-tions, food allergies, or digestive diseases, such as Crohn’s Disease or Cystic Fibrosis. Forty-five children from three different classrooms participated in the study. This study was approved by the Institutional Review Board of Pur-due University. As no individual data was collected, consent procedures consisted of approval by the director and teachers of the childcare in addition to verbal assent by each participating child prior to collecting data on each study day. Children’s refusal to participate in the study, such as not wanting to rate the foods, was hon-ored.
2.2. Study Design
This study functioned as a pilot study with one within- subject factor (meal). Over a period of three months, children were twice served the four regularly scheduled chicken main dishes and the study foods: salmon nuggets, salmon dumplings, salmon salad wraps, and salmon ma- caroni and cheese. The chicken main dishes were regu-larly scheduled once a week, and each main dish was served once a month. The salmon main dishes substituted for regularly scheduled items over the duration of the study, with a salmon main dish served once a week and each salmon main dish served once a month. During each study lunch, children rated the liking of the dish (ap-pearance, taste, texture, smell, and overall liking). To calculate food intake and total energy consumption (in kilocalories), the plate waste method was employed. The plate waste method and scale to rate liking of foods are described below.
2.3. Dietary Assessment Methods
Children’s liking of the chicken or fish dish was meas-ured using a three-point Likert-type scale using smiley faces. First, the main dish was presented to the child on his or her plate with the rest of the lunch items and the child was asked to take a bite to taste the dish and then categorize the food as “yummy”, “yucky” or “just okay”. The children were asked to provide five ratings for each main dish in regards to the appearance, taste, texture, smell and the overall liking of each main dish. The chil-dren’s responses were recorded by the researcher and entered into excel sheets for analysis.
to the children’s lunch plates. The weight (in grams) of each food was recorded. Once lunchtime was over, the waste of each food was collected, combined with the respective leftover food, and weighed to determine how much of that particular food was not consumed. From there, the waste was subtracted from the initial weight to determine how much food the children consumed in grams to calculate energy consumption in kilocalories.
2.4. Experimental Meals
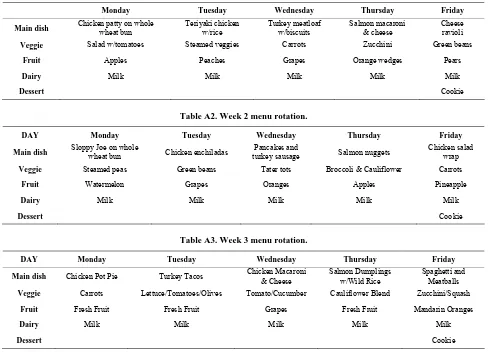
The four novel fish main dishes were designed to be similar to the regularly served chicken main dishes, which were already incorporated into the childcare cen-ter’s 8-week menu rotation (Tables A1-A8). The portion
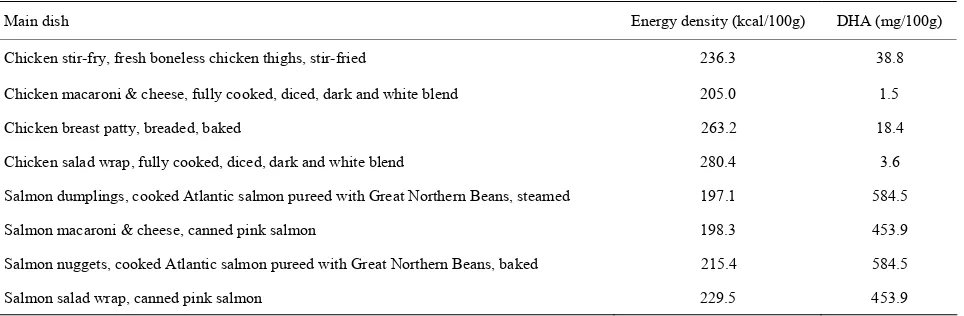
sizes of the meals were based on the United States De-partment of Agriculture (USDA) Food and Nutrition Service Child and Adult Care Food Program (CACFP) Child Meal Pattern for Lunch for 1 - 2 years old and 3 - 5 years old [34]. The comparison of total energy (kcal/ 100g) and DHA (mg/100g) content provided by each main dish is reflected in Table 1. The fish-based dishes
were designed to be of equivalent energy density as the chicken-based dishes.
The chicken-based dishes and the comparable fish- based dishes were a chicken patty versus salmon nuggets, chicken macaroni and cheese versus salmon macaroni and cheese, chicken salad wrap versus salmon salad wrap, and chicken stir-fry versus salmon dumplings. Due to the texture of salmon, a fish stir-fry would not have been acceptable to most children, thus, pot-sticker dumplings were served instead. Although canned pink salmon was directly substituted for canned chicken in the salad wrap and macaroni and cheese recipes, the other recipes re-quired further development. To develop the salmon nug-gets and salmon dumplings, cooked Atlantic salmon was pureed with canned Great Northern Beans to help pro-vide a soft and smooth textured protein base for the salmon nuggets and dumplings. The salmon-bean
mix-ture was prepared in two different ways: 1) lightly coated in breadcrumbs and baked to form salmon nuggets and 2) portioned into Wonton wrappers and steamed to form salmon dumplings. The four experimental dishes were developed and taste-tested in a preschool-age population. Based on the taste-test responses, the recipes were modi-fied until at least 80% of the children liked the test foods.
2.5. Procedures
On each study day, teachers in participating classrooms were instructed to follow standard mealtime procedures for lunch. In each classroom the children would sit at a table together and were served lunch by a research assis-tant. Children were not encouraged to eat more or less than usual and were instructed not to share food. All food liking results and plate-waste measurements were entered into excel sheets for additional analysis. Children’s in-take was entered into the Nutrition Data System for Re-search (NDSR) 2012. Food intake was recorded as grams of food consumed and total energy for each food com-ponent at lunch and for the whole meal (kcal) was calcu-lated as well as intake of DHA (mg). For a more accurate analysis of how much DHA was provided by the two types of salmon used in the study (canned and cooked), gas chromatography with a flame ionization detector was used.
[image:4.595.60.542.575.733.2]The brand of canned salmon (3 lots) and cooked At-lantic salmon (1 fillet) were purchased from local stores around Lafayette, Indiana in 2013. From each lot, the total contents were combined and ground in a food proc-essor to obtain a composite sample. The following methods have been replicated from a previous study by Shim, Dorworth, Lasrado, and Santerre [35]. For deter-mination of total fat, two composite samples were ran-domly chosen from each lot, thawed, and mixed well. A modified Folch method [36] was used to determine total fat concentration. Five grams of composite tissue was mixed with 100 mL of chloroform/methanol (2:1, v/v,
Table 1. Energy density of each main dish (kcal/100g) and DHA provided (mg/100g).
Main dish Energy density (kcal/100g) DHA (mg/100g)
Chicken stir-fry, fresh boneless chicken thighs, stir-fried 236.3 38.8
Chicken macaroni & cheese, fully cooked, diced, dark and white blend 205.0 1.5
Chicken breast patty, breaded, baked 263.2 18.4
Chicken salad wrap, fully cooked, diced, dark and white blend 280.4 3.6
Salmon dumplings, cooked Atlantic salmon pureed with Great Northern Beans, steamed 197.1 584.5
Salmon macaroni & cheese, canned pink salmon 198.3 453.9
Salmon nuggets, cooked Atlantic salmon pureed with Great Northern Beans, baked 215.4 584.5
Salmon salad wrap, canned pink salmon 229.5 453.9
HPLC grade for chloroform, pesticide grade for metha-nol, Fisher Scientific, Fair Lawn, NJ, USA) for 2 h to extract the fat. The mixture was filtered (Whatman filter paper nr 1, 150-mm dia, Whatman Intl. Ltd. Maidstone, England) and 50 mL of 0.88% potassium chloride (ACS reagent, Sigma, St. Louis, Mo., USA) was added to the filtrate. After removing the aqueous layer (upper), the solvent (lower) was reduced by evaporation using a Turbo Vap® (Zymark Corp., Hopkinton, Mass, USA). The extract was transferred to a pre-weighed flask and placed in a desiccator overnight. Duplicated blanks were included in each run during the fat extraction. Ninety- five percent recovery of total fat was determined using a Standard Reference Material (SRM) (Lake Superior fish tissue 1946, Natl. Inst. of Standards and Technology, Gaithersburg, Md., USA). Determination of fatty acids was carried out using the AOAC method 991.39 (AOAC 2000). Polyunsaturated fatty acids, including LA, ALA, stearidonic acid (SDA), ARA, EPA, docosapentaenoic acid (DPA), and DHA were quantified by gas chroma-tography with a flame ionization detector (GC/FID, Var-ian 3900 GC, CP-8400 auto sampler, CP-8410 auto in-jector, Varian Analytical Instruments, Walnut Creek, Calif., USA). Operating conditions were as follows: in-jection port temperature, 240˚C; detector temperature, 300˚C; oven programmed from 175˚C for 4 min to final hold temperature of 240˚C for 5 min with an increase of 3˚C /min; helium carrier gas (99.999% pure, Inweld, Inc., Lafayette, Ind., USA); and wall coated open tubular (WCOT) fused silica capillary column, 30 m × 0.32 mm, coated with Chrompack (CP) wax 52CB, DF 0.25 mm (CP 8843, Varian).
2.6. Statistical Analysis
All statistical analyses were conducted using the Statisti-cal Analysis Software (version 9.3, 2010, SAS Institute Inc., Cary, NC). For the three-point Likert scale ratings,
participants’ responses were recorded and coded: “−1” for “yucky”, “0” for “okay”, and “+1” for “yummy”. The values were entered for each participant, for each main dish (chicken and salmon), and for each category (ap-pearance, taste, texture, smell, and overall liking). Aver-age responses were calculated. A two independent sam-ple t-test was conducted to determine statistical differ-ences between each of the food categories. Kilocalorie consumption per child and DHA consumption per child were analyzed using a mixed model analysis of variance. Factors included in the model were classroom (3 levels), main dish type (4 levels), food type (chicken and salmon), and the interaction between food type and main dish type. Contrasts were then used to compare food types for each main dish. Statistical significance was defined as P < 0.05.
3. Results
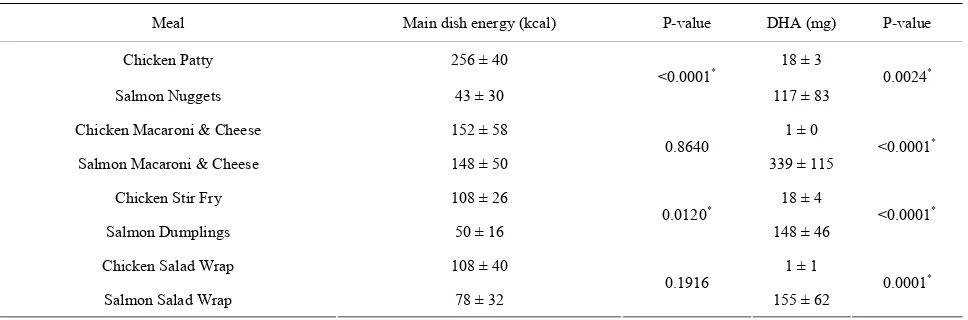
Complete intake data were obtained for 45 children. Data were aggregated by classroom, and a total of 48 eating occasions (3 classrooms × 16 meals) were collected. The analysis of variance indicated that the interaction be-tween main dish and food type was statistically signifi-cant (P < 0.0001). To investigate this, contrasts were used to compare food types for each main dish. Means and standard deviations of energy and DHA intake of the main dishes at lunchtime are provided in Table 2.
[image:5.595.57.541.563.723.2]En-ergy intake decreased by 83% for salmon nuggets com-pared to the intake of the chicken patty (43 versus 256 kcal, P < 0.0001). However, DHA intake increased by 550% (117 versus 18 mg, P = 0.0024). Energy intake decreased by 54% for the salmon dumplings compared to the chicken stir-fry (50 versus 108 kcal, P = 0.0120) but DHA intake increased by 722% (148 versus 18 mg, P = 0.0001). No significant difference for energy intake was observed for the substitution of chicken in the wrap as energy intake decreased by 28% when the salmon salad
Table 2. Comparison of children’s energy and DHA intake of main dish (chicken versus salmon) (mean ± SD).
Meal Main dish energy (kcal) P-value DHA (mg) P-value
Chicken Patty 256 ± 40 18 ± 3
Salmon Nuggets 43 ± 30
<0.0001*
117 ± 83
0.0024*
Chicken Macaroni & Cheese 152 ± 58 1 ± 0
Salmon Macaroni & Cheese 148 ± 50 0.8640 339 ± 115 <0.0001
*
Chicken Stir Fry 108 ± 26 18 ± 4
Salmon Dumplings 50 ± 16 0.0120
*
148 ± 46 <0.0001
*
Chicken Salad Wrap 108 ± 40 1 ± 1
Salmon Salad Wrap 78 ± 32 0.1916 155 ± 62 0.0001
*
*
wrap was served instead of the chicken salad wrap (78 versus 108 kcal, P = 0.1916) but DHA intake increased by 15400% (155 versus 1 mg, P < 0.0001). Likewise energy intake only decreased by 3% when the main course was salmon macaroni and cheese as compared to chicken macaroni and cheese (152 versus 148 kcal, P = 0.8640) and DHA intake increased by 33800% (339 ver-sus 1 mg, P < 0.0001). Thus, in two of the substitutions, total energy intake decreased significantly but DHA in-take increased despite the reduction in total food inin-take.
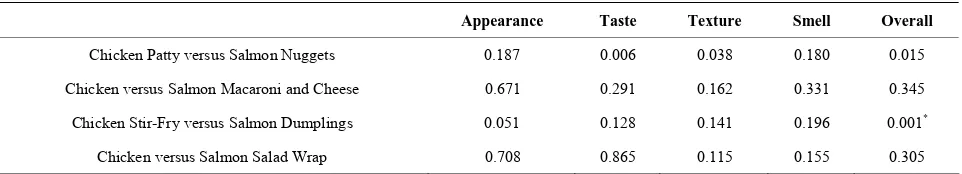
The results of the Likert scale ratings used to deter-mine liking of the main dishes are provided in Table 3.
No significant differences were observed between the chicken and salmon macaroni and cheeses, the chicken and salmon salad wraps, or the chicken patty and salmon nuggets. As for the difference between the chicken stir- fry and salmon dumplings, only overall liking of the dumplings was significantly lower (P = 0.001). Overall, the Likert scale ratings corresponded to energy consumed by participants. There were no significant differences in the ratings of the chicken and salmon macaroni and cheeses or the chicken and salmon salad wraps, and both of these pairs of main dishes did not have significant differences in energy intake. Conversely, there was a significant difference in overall liking and energy intake for the chicken stir-fry in comparison to the salmon dumplings.
4. Discussion
DHA supports healthy brain and eye development and certain fish are the best dietary sources of DHA. There-fore, changing children’s consumption patterns to include fatty fish is a critical public health issue. This study was designed to explore the feasibility of increasing pre-schooler’s fish consumption to help meet the dietary guideline for seafood consumption and to increase DHA intake. Results showed that although children’s intake of the main dish decreased when some of the salmon-based foods were served, DHA intake was significantly higher than when the regularly scheduled chicken-based dishes were served.
In the two instances where the salmon main dishes consisted of a mixture of cooked beans and Atlantic
salmon and did not resemble the chicken main dishes in appearance (and were unfamiliar to the children), main dish intake significantly decreased (salmon nuggets and salmon dumplings) (Table 2). This finding was expected
as it is well documented that young children are resistant to accepting new foods into the diet and consumption of novel foods only increases with repeated exposure. In this particular study, only two exposures were provided and it is probable that consumption would have increased if the children had increased exposures to the two novel fish dishes.
However, in the two instances where the salmon main dishes incorporated canned pink salmon and did resem-ble the chicken main dishes in appearance (and were therefore familiar to the children), main dish intake did not significantly decrease (salmon salad wrap and salmon macaroni and cheese) (Table 2). In addition, there were
no significant differences between the children’s ratings on appearance, taste, texture, smell, and overall liking of the chicken and salmon versions of the salad wraps and macaroni and cheese main dishes (Table 3). Since fatty
fish is the best dietary source of DHA [2], our results indicate that modifying main dishes to incorporate salmon can prove to be an effective approach to increase DHA intake at meals.
With the exception of the overall liking of the dump-lings, children did not report any difference in the liking of the five characteristics of the four different salmon main dishes versus the chicken main dishes studied ( Ta-ble 3). Therefore, the results of this study support our
hypothesis that 2 - 5 years old children will consume fish at least once a week and therefore increase DHA intake. It must be noted that these four fish dishes were created to be similar to the regularly served chicken main dishes. By children rating the salmon and chicken dishes simi-larly on the itemized list of food characteristics, this study demonstrates that it is possible to improve young children’s diet quality by serving fish in childcare cen-ters.
[image:6.595.59.540.635.722.2]Study results support the premise that parents and caretakers of children should introduce children to fish at a young age. Through repeated exposure to certain foods, children develop a liking for the food’s characteristics
Table 3. Differences between chicken main dish scores and salmon main dish scores.
Appearance Taste Texture Smell Overall
Chicken Patty versus Salmon Nuggets 0.187 0.006 0.038 0.180 0.015
Chicken versus Salmon Macaroni and Cheese 0.671 0.291 0.162 0.331 0.345
Chicken Stir-Fry versus Salmon Dumplings 0.051 0.128 0.141 0.196 0.001*
Chicken versus Salmon Salad Wrap 0.708 0.865 0.115 0.155 0.305
*
(appearance, smell, taste, and texture) [37]. If fatty-fish were offered to children as a protein source at least twice a week, children would predictably choose to eat more fish, thereby increasing their DHA intake. Although the main dishes tested in this study were only representative of a small portion of the main dishes children usually consume, providing fish at least once a week can have an additive effect on children’s average fish consumption and DHA intake. Whether fish is served on its own (such as a salmon filet) or incorporated into mixed dishes (such as salmon macaroni and cheese or a salmon salad wrap), children’s average daily intake of DHA will increase.
The present study had several strengths and limitations. This study was highly innovative as we are not aware of any other studies on the development of child-friendly fish dishes in an effort to increase children’s fatty fish consumption. Due to the results of this study, especially the high acceptance of the salmon macaroni and cheese and the salmon salad wrap, the daycare menu was re-vised to incorporate these two dishes into the childcare center’s 8-week menu rotation (Tables A1-A8). Since
data were collected on the group level, individual changes in intake or liking of the foods were not identified. The study was based on a university population (higher par-ent education, more international diversity, less domestic ethnic diversity, etc.) and was therefore not representative of the US pediatric population. The results of this study indicate that children’s intake in a childcare setting can be modified to improve overall diet quality and support children’s growth and development.
Future research on this topic should be based on larger and more diverse samples of children and include indi-vidual data, provide more exposures, and a larger variety of fish-based foods. Despite the limitations of this study, the findings strongly indicate that it is feasible and ad-visable for childcare centers to include offering high-fat fish once a week. Although some children may not con-sume as much of the fish-based lunch initially, this change in the menu may help children adopt a healthier diet for life as well as provide essential omega-3 PUFAs, specifically DHA, which are critical in the development of the nervous system.
5. Acknowledgements
The authors thank the parents and teachers of the par-ticipating childcare center. Without your help and toler-ance, our research would not have been possible. We also thank Lauren Suttie (Undergraduate Independent Re-searcher), Elizabeth Schlesinger-Devlin (Child Care Di-rector), the staff of the Ben and Maxine Miller Child Development Laboratory School, Jamie Wittenberg (Lab Manager), Dennis Cladis (Graduate Student), Mary Brauchla (PhD Candidate), Selena Baker (MS Student), and other volunteers in the Kranz Lab for their
contribu-tions to this research project.
REFERENCES
[1] D. Cao, K. Kevala, J. Kim, H.-S. Moon, S. B. Jun, D. Lovinger and H.-Y. Kim, “Docosahexaenoic Acid Pro- motes Hippocampal Neuronal Development and Synaptic Function,” Journal of Neurochemistry, Vol. 111, No. 2, 2009, pp. 510-521.
http://dx.doi.org/10.1111/j.1471-4159.2009.06335.x [2] S. M. Innis, “Dietary Omega 3 Fatty Acids and the De-
veloping Brain,” Brain Research, Vol. 1237, 2008, pp. 35-43. http://dx.doi.org/10.1016/j.brainres.2008.08.078 [3] R. J. Pawlosky, J. R. Hibblen, Y. Lin, et al., “Effects of
Beef- and Fish-Based Diet on the Kinets of n-3 Fatty Acid Metabolism in Human Subjects,” American Journal of Clinical Nutrition, Vol. 77, No. 3, 2003, pp. 565-572. [4] P. L. Goyens, M. E. Spilker, P. L. Zock, M. B. Katan and
R. P. Mensink, “Compartmental Modeling to Quantify Alpha-Linolenic Acid Conversion after Longer-Term In- take of Multiple Tracer Boluses,” Journal of Lipid Re- search, Vol. 46, 2005, pp. 1474-1483.
http://dx.doi.org/10.1194/jlr.M400514-JLR200
[5] G. C. Burdge, Y. E. Finnegan, A. M. Minihane, C. M. Williams and S. A. Wootton, “Effect of Altered Dietary n-3 Fatty Acid Intake upon Plasma Lipid Fatty Acid Com- position, Converstion of [13C] Alpha-Linolenic Acid to Longer-Chain Fatty Acids and Partitioning towards Beta- Oxidation in Older Men,” British Journal of Nutrition, Vol. 90, No. 2, 2003, pp. 311-321.
http://dx.doi.org/10.1079/BJN2003901
[6] G. C. Burdge, A. E. Jones and S. A. Wootton, “Eicosa- pentaenoic and Docosapentaenoic Acids Are the Principal Products of Alpha-Linolenic Acid Metabolism in Young Men,” British Journal of Nutrition, Vol. 88, No. 4, 2002, pp. 355-364. http://dx.doi.org/10.1079/BJN2002662 [7] E. A. Emken, R. O. Adlof and R. M. Gulley, “Dietary
Linoleic Acid Influences Desaturation and Acylation of Deuterium-Labeled Linoleic and Linolenic Acids in Young Adult Males,” Biochimica et Biophysica Acta, Vol. 1213, No. 3, 1994, pp. 277-288.
http://dx.doi.org/10.1016/0005-2760(94)00054-9
[8] N. Hussein, E. Ah-Sing, P. Wilkinson, C. Leach, B. A. Griffin and D. J. Millward, “Long-Chain Conversion of [13C] Linoleic Acid and Alpha-Linolenic Acid in Re- sponse to Marked Changes in Their Dietary Intake in Men,” Journal of Lipid Research, Vol. 46, 2005, pp. 269-280. http://dx.doi.org/10.1194/jlr.M400225-JLR200 [9] G. C. Burdge and S. A. Wootton, “Conversion of Al-
pha-Linolenic Acid to Eicosapentaenoic, Docosapenta- enoic and Docosahexaenoic Acids in Young Women,”
British Journal of Nutrition, Vol. 88, No. 4, 2002, pp. 411-421. http://dx.doi.org/10.1079/BJN2002689
[10] A. Dalton, P. Wolmarans, R. C. Witthuhn, M. E. van Stui- jvenberg, S. A. Swanevelder and C. M. Smuts, “A Ran- domised Control Trial in Schoolchildren Showed Im- provement in Cognitive Function after Consuming a Bread Spread, Containing Fish Flour from a Marine Source,”
Vol. 80, No. 2-3, 2009, pp. 143-149. http://dx.doi.org/10.1016/j.plefa.2008.12.006
[11] S. M. Innis, “Perinatal Biochemistry and Physiology of Long-Chain Polyunsaturated Fatty Acids,” Journal of Pe- diatrics, Vol. 143, No. 4, 2003, pp. S1-S8.
http://dx.doi.org/10.1067/S0022-3476(03)00396-2 [12] H. W. Sprecher, Q. Chen and F. Q. Yin, “Differences in
the Regulation of Biosynthesis of 20- versus 22-Carbon Polyunsaturated Fatty Acids,” Prostaglandins, Leukot- rienes and Essentital Fatty Acids, Vol. 52, No. 2-3, 1995, pp. 99-101.
http://dx.doi.org/10.1016/0952-3278(95)90005-5
[13] J. M. Bourre, M. Piciotti, O. Dumont, G. Pascal and G. Durand, “Dietary Linoleic Acid and Polyunsaturated Fat- ty Acids in Rat Brain and Other Organs. Minimal Re- quirements of Linoleic Acid,” Lipids, Vol. 25, No. 8, 1990, pp. 465-472. http://dx.doi.org/10.1007/BF02538090 [14] W. E. Lands, A. Morris and B. Libelt, “Quantitative Ef-
fects of Dietary Polyunsaturated Fats on the Composition of Fatty Acids in Rat Tissues,” Lipids, Vol. 25, No. 9, 1990, pp. 505-516.
http://dx.doi.org/10.1007/BF02537156
[15] L. D. Arbuckle, M. J. MacKinnon and S. M. Innis, “For- mula 18:2(n-6) and 18:3(n-3) Content and Ratio Influence Long-Chain Polyunsaturated Fatty Acids in the Develop- ing Piglet Liver and Central Nervous System,” The Jour- nal of Nutrition, Vol. 124, No. 2, 1994, pp. 289-298. [16] R. R. Brenner and R. O. Peluffo, “Effect of Saturated and
Unsaturated Fatty Acids on the Desaturation in Vitro of Palmitic, Stearic, Oleic, Linoleic, and Linolenic Acids,”
Journal of Biological Chemistry, Vol. 241, No. 22, 1966, pp. 5213-5219.
[17] J. Rahm and R. T. Holman, “Effect of Linoleic Acid upon the Metabolism of Linolenic Acid,” The Journal of Nutri- tion, Vol. 84, 1964, pp. 15-19.
[18] P. S. Sastry, “Lipids of Nervous Tissue: Composition and Metabolism,” Progress in Lipid Research, Vol. 24, No. 2, 1985, pp. 69-176.
http://dx.doi.org/10.1016/0163-7827(85)90011-6
[19] N. M. Giusto, G. A. Salvador, P. I. Castagnet, S. J. Pas- quare and M. G. Ilincheta de Boschero, “Age-Associated Changes in Central Nervous System Glycerolipid Com- position and Metabolism,” Neurochemical Research, Vol. 27, No. 11, 2002, pp. 1513-1523.
http://dx.doi.org/10.1023/A:1021604623208
[20] J. M. Bourre, M. Francois, A. Youyou, O. Dumont, M. Piciotti, G. Pascal and G. Durand, “The Effects of Dietary Alpha-Linolenic Acid on the Composition of Nerve Mem- branes, Enzymatic Activity, Amplitude of Electrophysio- logical Parameters, Resistance to Poisons and Perform- ance of Learning Tasks in Rats,” The Journal of Nutrition, Vol. 119, No. 12, 1989, pp. 1880-1892.
[21] C. Galli, H. I. Trzeciak and R. Paoletti, “Differential Ef- fects of Dietary Fatty Acids on the Accumulation of Ara- chidonic Acid and Its Metabolic Conversion through the Cyclooxygenase and Lipoxygenase in Platelets and Vas- cular Tissue,” Lipids, Vol. 16, No. 3, 1981, pp. 165-172. http://dx.doi.org/10.1007/BF02535434
[22] N. Hrboticky, M. J. MacKinnon and S. M. Innis, “Effect
of a Vegetable Oil Formula Rich in Linoleic Acid on Tis- sue Fatty Acid Accretion in the Brain, Liver, Plasma, and Erythrocytes of Infant Piglets,” American Journal of Clinical Nutrition, Vol. 5, No. 2, 1990, pp. 173-182. [23] N. Hrboticky, M. J. MacKinnon and S. M. Innis, “Retina
Fatty Acid Composition of Piglets Fed from Birth with a Linoleic Acid-Rich Vegetable-Oil Formula for Infants,”
American Journal of Clinical Nutrition, Vol. 53, No. 2, 1991, pp. 483-490.
[24] S. M. Innis, “Essential Fatty Acids in Growth and Devel- opment,” Progress in Lipid Research, Vol. 30, No. 1, 1991, pp. 39-103.
http://dx.doi.org/10.1016/0163-7827(91)90006-Q
[25] E. C. Bakker, G. Hornstra, C. E. Blanco and J. S. H. Vles, “Relationship between Long-Chain Polyunsaturated Fatty Acids at Birth and Motor Function at 7 Years of Age,”
European Journal of Clinical Nutrition, Vol. 63, No. 4, 2009, pp. 499-504.
http://dx.doi.org/10.1038/sj.ejcn.1602971
[26] E. E. Birch and D. R. Stager Sr., “Long-Term Motor and Sensory Outcomes after Early Surgery for Infantile Esot- ropia,” Journal of the American Association for Pediatric Ophthalmology and Strabismus, Vol. 10, No. 5, 2006, pp. 409-413. http://dx.doi.org/10.1016/j.jaapos.2006.06.010 [27] Institute of Medicine, “Seafood Choices: Balancing Be-
nefits and Risks,” 2006.
http://www.iom.edu/Reports/2006/Seafood-Choices-Bala ncing-Benefits-and-Risks.aspx
[28] L. R. Huss, S. Laurentz, J. O. Fisher, G. P. McCabe and S. Kranz, “Timing of Serving Dessert but Not Portion Size Affects Young Children’s Intake at Lunchtime,” Appetite, Vol. 68, 2013, pp. 158-163.
http://dx.doi.org/10.1016/j.appet.2013.04.013
[29] S. Y. Park, H.-Y. Paik, J. D. Skinner, A. A. Spindler and H.-R. Park, “Nutrient Intake of Korean-American, Korean, and American Adolescents,” Journal of the American Dietetic Association, Vol. 104, No. 2, 2004, pp. 242-245. http://dx.doi.org/10.1016/j.jada.2003.11.015
[30] Food and Nutrition Board, Institute of Medicine, “Dietary Reference Intakes for Energy, Carbohydrate, Fiber, Fat, Fatty Acids, Cholesterol, Protein, and Amino Acids (Mac- ronutrients),” A Report of the Panel on Macronutrients, Subcommittees on Upper Reference Levels of Nutrients and Interpretation and Uses of Dietary Reference Intakes, and the Standing Committee on the Scientific Evaluation of Dietary Reference Intakes, National Academy Press, Washington DC, 2002.
[31] FAO/WHO, “Interim Summary of Conclusions and Die- tary Recommendations on Total Fat & Fatty Acids,” Joint FAO/WHO Expert Consultation on Fats and Fatty Acids in Human Nutrition, Geneva, 2008.
[32] B. Koletzko, R. Uauy, A. Palou, et al., “Dietary Intake of Eicosapentaenoic Acid (EPA) and Docosahexaenoic Acid (DHA) in Children—A Workshop Report,” British Jour- nal of Nutrition, Vol. 103, No. 6, 2010, pp. 923-928. http://dx.doi.org/10.1017/S0007114509991851
8, No. 2-3, 2009, pp. 133-136.
http://dx.doi.org/10.1016/j.plefa.2009.05.008
[34] E. Foland, L. Graves and C. Markle, “CACFP—What’s in a Meal?—Healthy Hoosier Edition,” 2008.
http://www.doe.in.gov/student-services/nutrition/cacfp-w hats-meal-healthy-hoosier-edition
[35] S. M. Shim, L. E. Dorworth, J. A. Lasrado and C. R. San- terre, “Mercury and Fatty Acids in Canned Tuna, Salmon, and Mackerel,” Journal of Food Science, Vol. 69, 2004,
pp. 681-684.
http://dx.doi.org/10.1111/j.1365-2621.2004.tb09915.x [36] J. Folch, M. Lees and G. H. Sloane-Stanley, “A Simple
Method for the Isolation and Purification of Total Lipids from Animal Tissues,” Canadian Journal of Biochemistry and Physiology, Vol. 226, 1956, pp. 497-509.
[37] A. Drewnowski, “Taste Preferences and Food Intake,”
Annual Review of Nutrition, Vol. 17, 1997, pp. 237-253.
Appendix
See Tables A1-A8.
Table A1. Week 1 menu rotation.
Monday Tuesday Wednesday Thursday Friday
Main dish Chicken patty on whole wheat bun Teriyaki chicken w/rice Turkey meatloaf w/biscuits Salmon macaroni & cheese Cheese ravioli
Veggie Salad w/tomatoes Steamed veggies Carrots Zucchini Green beans
Fruit Apples Peaches Grapes Orange wedges Pears
Dairy Milk Milk Milk Milk Milk
[image:9.595.54.542.387.745.2]Dessert Cookie
Table A2. Week 2 menu rotation.
DAY Monday Tuesday Wednesday Thursday Friday
Main dish Sloppy Joe on whole wheat bun Chicken enchiladas turkey sausage Pancakes and Salmon nuggets Chicken salad wrap
Veggie Steamed peas Green beans Tater tots Broccoli & Cauliflower Carrots
Fruit Watermelon Grapes Oranges Apples Pineapple
Dairy Milk Milk Milk Milk Milk
[image:9.595.52.540.389.487.2]Dessert Cookie
Table A3. Week 3 menu rotation.
DAY Monday Tuesday Wednesday Thursday Friday
Main dish Chicken Pot Pie Turkey Tacos Chicken Macaroni & Cheese Salmon Dumplings w/Wild Rice Spaghetti and Meatballs
Veggie Carrots Lettuce/Tomatoes/Olives Tomato/Cucumber Cauliflower Blend Zucchini/Squash
Fruit Fresh Fruit Fresh Fruit Grapes Fresh Fruit Mandarin Oranges
Dairy Milk Milk Milk Milk Milk
Table A4. Week 4 menu rotation.
DAY Monday Tuesday Wednesday Thursday Friday
Main dish 4 × 6 Tony’s pizza Chicken stir-fry w/rice Turkey sandwiches Salmon salad wrap Toasted cheese sandwich
Veggie Salad w/carrot and cucumber Stir-fry veggies Peas & corn Sweet potato wedges Cherry tomatoes
Fruit Diced pears Fresh fruit Fresh fruit Blueberries Canned fruit
Dairy Milk Milk Milk Milk Milk
[image:10.595.59.536.107.527.2]Dessert Cookie
Table A5. Week 5 menu rotation.
DAY Monday Tuesday Wednesday Thursday Friday
Main dish Chicken and noodles w/dinner roll Pasta primavera Turkey meatloaf w/biscuits Salmon macaroni & Cheese Cheese pizza
Veggie Diced carrots Italian blend vegetables Carrots Steamed veggies Peas
Fruit Apple wedges Fresh fruit Grapes Fresh fruit Blueberries
Dairy Milk Milk Milk Milk Milk
Dessert Cookie
Table A6. Week 6 menu rotation.
DAY Monday Tuesday Wednesday Thursday Friday
Main dish Grilled chicken w/breadstick Salmon salad wrap Turkey sausage & Pancakes Fish nuggets w/wheat roll Tofu & Rice
Veggie Salad Salad Cucumbers Green beans Stir-fry veggies
Fruit Watermelon Strawberries Oranges Fresh fruits Pineapple
Dairy Milk Milk Milk Milk Milk
Dessert Cookie
Table A7. Week 7 menu rotation.
DAY Monday Tuesday Wednesday Thursday Friday
Main dish Beef & Vegetable stroganoff Salmon dumplings w/white rice Chicken macaroni & Cheese w/wheat roll Pork loin Chicken fajitas
Veggie Stroganoff vegetables Salad Cucumbers Mashed potatoes Zucchini & squash
Fruit Strawberries Fresh fruit Grapes Orange wedges Watermelon
Dairy Milk Milk Milk Milk Milk
[image:10.595.64.541.478.583.2]Dessert Cookie
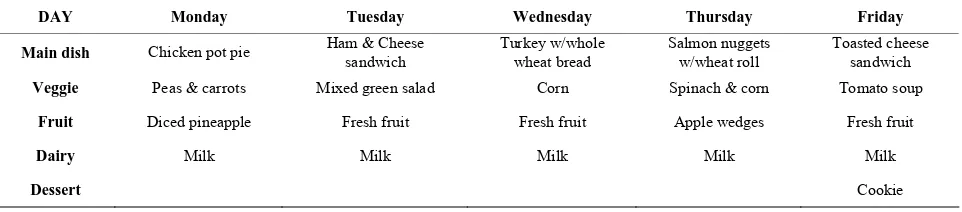
Table A8. Week 8 menu rotation.
DAY Monday Tuesday Wednesday Thursday Friday
Main dish Chicken pot pie Ham & Cheese sandwich Turkey w/whole wheat bread Salmon nuggets w/wheat roll Toasted cheese sandwich
Veggie Peas & carrots Mixed green salad Corn Spinach & corn Tomato soup
Fruit Diced pineapple Fresh fruit Fresh fruit Apple wedges Fresh fruit
Dairy Milk Milk Milk Milk Milk
[image:10.595.59.540.610.716.2]