Fabrication and Performance Evaluation of Thermoacoustic Refrigerator
Full text
Figure

Related documents
3 – at the retail level, the quantity of milk delivered by major retailers. The hypothesis is that the degree of concentration and some agreements among players in the dairy
Our new favourite thing will be to listen to music together We will be so happy when Covid is
We propose and examine a simple model for credit migration and spread curves of a single firm both under the real-world and the risk- neutral measure.. Default is triggered either
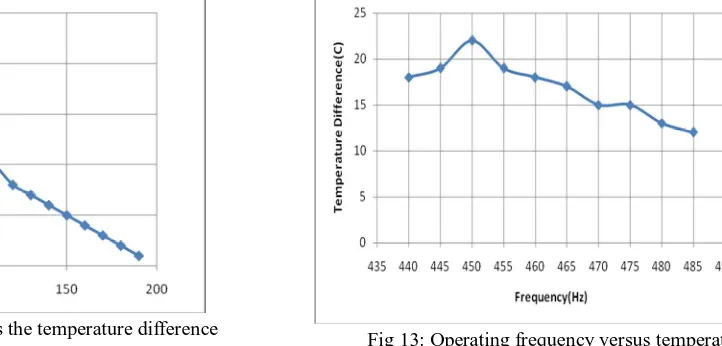
Figure 4: Continuous Ranked Probability Skill Score versus lead time for the TIGGE-4 multi-model (solid line), for the contributing single-models itself (dotted
Marriage certificates show that in Morteros the majority of these repeated pairs belong to Italian pairs and Spanish pairs of surnames, in both immigration and post-immigration
National Conference on Technical Vocational Education, Training and Skills Development: A Roadmap for Empowerment (Dec. 2008): Ministry of Human Resource Development, Department
For the data set of this study, the volume (equally) weighted market impact relative to the opening price of the trading day is 81.25 bp (38.98 bp), more than twice as much as the
