M E T H O D
Open Access
CopywriteR: DNA copy number detection from
off-target sequence data
Thomas Kuilman
1, Arno Velds
2, Kristel Kemper
1, Marco Ranzani
3, Lorenzo Bombardelli
4, Marlous Hoogstraat
5,
Ekaterina Nevedomskaya
5,6, Guotai Xu
1, Julian de Ruiter
5,6, Martijn P Lolkema
7, Bauke Ylstra
8, Jos Jonkers
6,
Sven Rottenberg
1,9, Lodewyk F Wessels
5, David J Adams
3, Daniel S Peeper
1*and Oscar Krijgsman
1Abstract
Current methods for detection of copy number variants (CNV) and aberrations (CNA) from targeted sequencing data are based on the depth of coverage of captured exons. Accurate CNA determination is complicated by uneven genomic distribution and non-uniform capture efficiency of targeted exons. Here we present CopywriteR, which eludes these problems by exploiting‘off-target’sequence reads. CopywriteR allows for extracting uniformly distributed copy number information, can be used without reference, and can be applied to sequencing data obtained from various techniques including chromatin immunoprecipitation and target enrichment on small gene panels. CopywriteR outperforms existing methods and constitutes a widely applicable alternative to available tools.
Background
Genetic and epigenetic aberrations underlie many dis-eases and disorders. Recent advances in DNA sequen-cing technologies have facilitated the discovery of these changes, allowing disease gene discovery at an unprece-dented rate [1,2]. Until now, the vast majority of efforts to uncover disease-genotype relations have deployed whole-exome sequencing (WES) or targeted sequencing on a smaller gene panel. These approaches enrich for the protein-coding sequences of the genome, or a subset of that, to focus the sequencing effort and reduce cost and data complexity compared to whole-genome se-quencing (WGS) [3,4].
While WES has been successful in identifying disease-related mutations, it is well established that changes in copy number contribute to pathogenesis as well [5,6]. For this reason targeted sequencing efforts are com-monly complemented with arrayCGH, SNP arrays, or low-coverage whole-genome sequencing (LC-WGS) [7-10], which increases the cost significantly. More re-cently, approaches that use reads mapping to captured regions (on-target reads) have been used as a cost-effective alternative to identify copy number aberrations
(CNAs) [11-14]. Generally, the tools that apply this ap-proach use the depth of coverage (DOC) of the captured exons as a measure of copy number status. Although DOC-based methods have proven useful for CNA detec-tion from WGS data, their applicadetec-tion to WES data suf-fers from two intrinsic limitations. First, copy number information from non-exonic regions is absent and can only be inferred from the exonic DOC. This impairs the discovery of CNAs in non-exonic regions, which have been shown to be clinically relevant [15-17]. Second, there is a large variation in the efficiency of capture baits to retrieve targeted sequences. All currently existing tools for DNA copy number profiling from WES apply sophisticated statistical models, such as principal com-ponent analysis, hidden Markov models, and singular value decomposition, for the segmentation and calling of genomic aberrations to overcome these limitations [11,12,18-21]. Despite this, the accuracy of copy number detection from WES is known to be poor when com-pared to methods that are dedicated to CNA detection [21]. These effects are even more pronounced when per-forming targeted sequencing with a small-size gene panel. Depending on the number of enriched genes, DNA copy number profiles will only yield sparsely distributed copy number information, which makes accurate downstream segmentation analysis more error-prone.
* Correspondence:[email protected]
1
Division of Molecular Oncology, Netherlands Cancer Institute, Plesmanlaan 121, 1066 CX Amsterdam, The Netherlands
Full list of author information is available at the end of the article
The enrichment strategies used for targeted sequen-cing generally achieve only 40% to 60% efficiency [22]; as a result, a large proportion of the sequence reads maps outside of these targeted regions. We hypothesized that such ‘off-target’ reads can be used to obtain DNA copy number profiles. This would provide not only more information on gene-poor regions, but also circumvent the aforementioned limitations of exonic DOC-based approaches.
Here, we describe the development of a new tool, called CopywriteR, which can be used to generate high quality DNA copy number profiles using off-target reads from targeted sequencing data. We analyze the perform-ance of CopywriteR relative to other approaches based on on-target reads, and describe the wide applicability of the tool.
Results
Detection and removal of genomic regions enriched for sequence reads
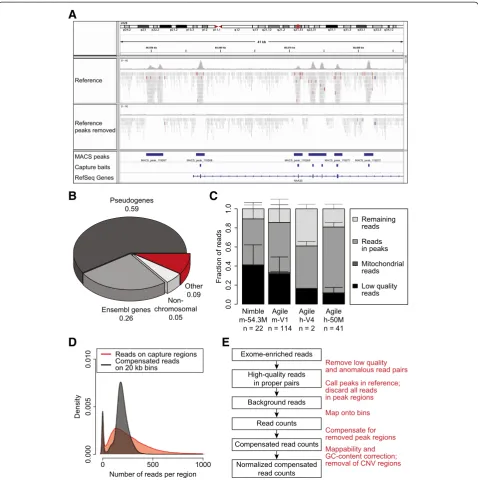
In an attempt to determine whether off-target reads from targeted sequencing can be used to derive copy number profiles, we first analyzed whole-exome sequen-cing (WES) data of a germline DNA sample (C41; for in-formation about the datasets used in this manuscript, refer to Additional file 1). We discarded reads mapping to genomic regions covered by capture baits and se-quences adjacent to these capture regions, which are fre-quently co-enriched during the capture procedure. We then calculated the number of reads that map to genome-wide consecutive 20 kb windows (bins) to ob-tain the depth of coverage (DOC). As the effective bin size was reduced upon removal of reads mapping to cap-ture regions, we calculated a compensated DOC by div-iding the DOC by the ratio of the effective bin size (that is, bin size minus the size of peak regions) to the original bin size (see Materials and methods). We removed se-quences mapping within bait regions that were extended with up to 400 bp of flanking sequences. Despite this stringent filtering of the data, we were unable to elimin-ate capture biases and to generelimin-ate smoothed copy number profiles (top four profiles in Additional file 2: Figure S1). We observed that a number of peaks of se-quence reads on the genome were not overlapping with capture bait regions (for an example, see Figure 1A), which could explain the failure to generate high quality copy number profiles using this method.
Therefore, we decided to use off-target reads for copy number aberration (CNA) detection and applied the Model-based Analysis for ChIPseq (MACS) algorithm to detect peaks in germline samples enriched using various capture sets (see Additional file 1). First, we calculated that 125,000 to 170,000 MACS-peaks overlap with cap-ture regions, depending on the capcap-ture set used. While
the majority of exons targeted by baits were found within these MACS-peaks, we observed that 8% to 11% of peaks were located in non-exonic regions (Additional file 2: Figure S2A). Whereas the amount of peaks called by MACS was dependent on the number of sequence reads, a maximum was reached for samples with a total of 100 million reads. This suggests that the number of ‘orphan’peaks is limited and that they represent parts of the genome that are reproducibly captured during target enrichment. We speculated that a fraction of orphan peaks was caused by co-capture of homologous se-quences during exome enrichment. Therefore, we calcu-lated the overlap of MACS-peaks with exons of both pseudogenes [23] and Ensembl genes [24]. Indeed, about 60% and 25% of orphan peaks constituted pseudogenes or untargeted Ensembl genes, respectively (Figure 1B). This was more than what would be observed by chance, as 10,000 simulations using randomly placed peaks of the same size distribution did not once reach the ob-served extent of overlap with either pseudogene or Ensembl exons (Additional file 2: Figure S2B and C). We observed a similar effect for other capture sets (Additional file 2: Figure S2D and E), which suggests that the majority of orphan peaks can be explained by se-quence co-capture during exome enrichment strategies. As such orphan peaks could introduce noise into the copy number data, we decided to filter sequence reads in MACS-peaks (termed ‘peak removal’in the remainder of the manuscript). This indeed led to a dramatic noise re-duction (compare top four profiles to bottom profile in Additional file 2: Figure S1). Global inspection using the IGV genome browser showed that this procedure effi-ciently removes distinguishable peaks (Figure 1A).
Off-target sequence reads are uniformly distributed over the genome
Next, we tested whether sufficient sequence reads were left for CNA calling after peak removal. We noticed that among the different capture sets, at least 10% of the in-put sequence reads were reads with high mapping qual-ity (Phred-score >37) outside of MACS-peak regions (Figure 1C). From our experience with low-coverage whole-genome sequencing (LC-WGS) approaches with 20 kb bins, 5 million reads are sufficient for accurate CNA detection. This is in line with the number of reads that map outside of MACS-peak regions (Additional file 2: Figure S3). We found that 86.6% of our samples had more than 5 million useable off-target reads, suggesting that most exome sequence datasets will be amenable to analysis using our approach.
A
B
D
E
[image:3.595.59.538.88.569.2]C
removal followed by the application of the 20 kb bin DOC-based approach with a compensated DOC (see above and Materials and methods). Although in theory this compensation could lead to a bias, there was no ob-vious relationship between the compensated DOC and the effective bin size in male sample C45 (Additional file 2: Figure S4; upper panel). The non-random scattering pattern of the effective bin sizes was due to clustering of bins where the same number of MACS-peak regions has been removed (Additional file 2: Figure S4; lower panel). When comparing the compensated off-target DOC to the DOC on capture regions (black and red, respectively; Figure 1D and Additional file 2: Figure S4), the density distribution of the off-target DOC appeared normally distributed and was relatively narrow.
In addition to the above, a small shoulder could be dis-tinguished representing the sex chromosomes (Figure 1D and Additional file 2: Figure S4). Therefore, based on the notion that we can distinguish different copy number states from off-target reads, we developed ‘CopywriteR’ (Figure 1E), which exploits off-target reads from targeted sequencing for CNA detection. This method is based on peak calling using MACS in a matched reference sample or, when no reference is available, in the sample itself. Se-quence reads in peaks are removed, and the DOC is calcu-lated based on fixed-size bins. The DOC is compensated for peak removal, normalized using loess-based correc-tions for mappability and GC content, and filtered for regions of extensive germline copy number variation (see Materials and methods). CopywriteR is implemented in R and is available for download from GitHub [25].
Comparison of CopywriteR and methods dedicated to copy number detection
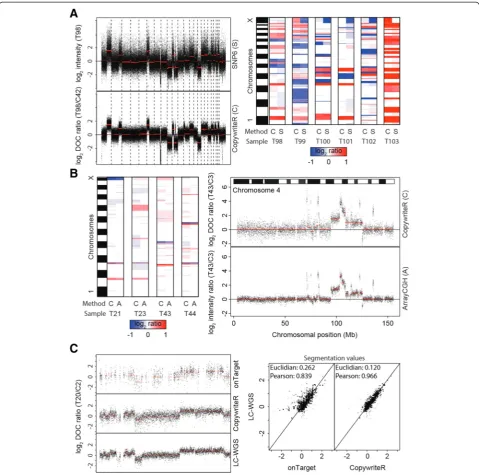
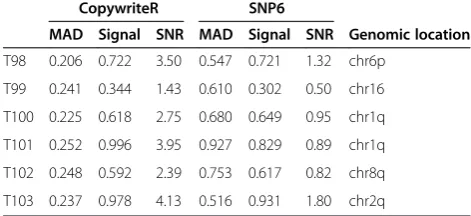
Next, we assessed the performance of CopywriteR relative to dedicated copy number detection platforms. Six PDX-derived human melanoma samples (T98-T103) were ana-lyzed with Affymetrix SNP6 chips and WES using the same DNA preparation. To allow a direct comparison of the copy number data from CopywriteR and Affymetrix SNP6, we generated pseudo counts of the SNP6 data as described previously [11-14,20] and in the Materials and methods. As an example, the copy number profile of sam-ple T98 was very similar for both methods (Figure 2A; left panel). In a side-by-side comparison, the segmentation values for the two methods were nearly identical for all samples (Figure 2A; right panel). However, the variance of the SNP6 profiles was higher (Figure 2A; left panel), as was reflected by the MAD values for SNP6 (mean = 0.56, range = 0.46 to 0.73) and CopywriteR (mean = 0.26, range = 0.24 to 0.27). Since the deflection (that is, the difference between two copy number states) of aberrations between CopywriteR and SNP6 was similar, the sensitivity of detec-tion of CNAs was higher for CopywriteR. This was also
reflected by the higher signal-to-noise ratios for CopywriteR-derived copy number profiles compared to those of SNP6 (Table 1; [26]). In sum, while CopywriteR and SNP6 copy number profiles are largely comparable, the sensitivity for detecting gains and losses is higher when CopywriteR is used.
To compare the quality of CopywriteR-derived data to those from arrayCGH, we analyzed DNA of four mouse small cell lung cancer (SCLC) samples (T21, T23, T43, and T44) with both Nimblegen 135 K arrays and WES using the same DNA preparation. For a direct compari-son of copy number profiles of CopywriteR and Nimble-gen array methods, we matched the array probes to the nearest bin center to create pseudo counts. Copy num-ber profiles were plotted together with their segmenta-tion values for both methods (Figure 2B). On the whole-genome level, all aberrations were detected in arrayCGH and CopywriteR-derived data (Figure 2B; left panel). We observed that chromosome four of sample T43 displays a complex copy number profile with mul-tiple high-level amplifications (Figure 2B; right panel). Comparison between the techniques showed that copy number profiles derived from the Nimblegen array plat-form and from CopywriteR were highly similar, with all major aberrations detected with both methods. The signal-to-noise ratio was slightly higher in the arrayCGH datasets (Table 2). While the technical noise was lower for the array (mean MAD = 0.24, range = 0.22 to 0.26) compared to CopywriteR (mean MAD = 0.49, range = 0.42 to 0.61), the biological signal, as denoted by the de-flection, was higher for CopywriteR. The lower deflection of copy number profiles obtained from Nimblegen arrays in comparison with other DNA copy number platforms has been described before [27,28]. In sum, CopywriteR ac-curately detects CNAs and performs similar to the dedi-cated DNA copy number technique arrayCGH.
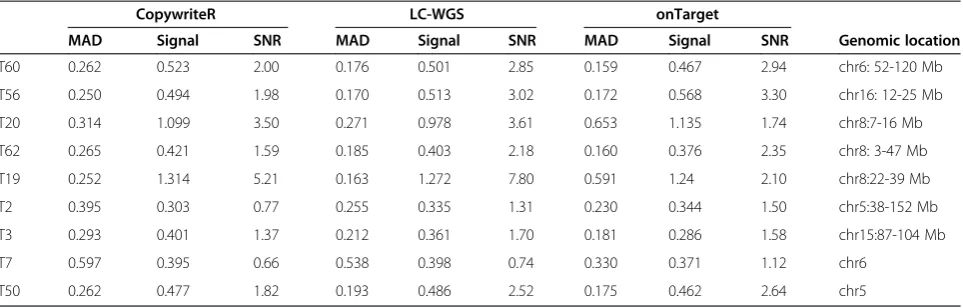
To further assess the data quality obtained using CopywriteR, we tested our approach on a set of nine mouse mammary tumors for which both WES (Nimblegen or Agilent capture sets) and LC-WGS data were available. We applied CopywriteR to the WES set, and compared the profiles with those obtained from LC-WGS (Figure 2C). CopywriteR-based profiles were highly similar to those ob-tained from LC-WGS data, and while the technical noise was higher for CopywriteR compared to LC-WGS (MAD values of 0.50 versus 0.32), a part of this might be ex-plained by the lower read count for CopywriteR-derived copy number profiles. Across all samples, the MAD values were marginally higher for the CopywriteR method (mean MAD = 0.38, range = 0.28 to 0.67) compared to LC-WGS (mean MAD = 0.27, range = 0.19 to 0.60), which is reflected by the lower signal-to-noise ratio for LC-WGS (Table 3).
implemented our own version of the exonic DOC-based method ExomeCNV [12], which processes copy number data according to the CopywriteR workflow where pos-sible (we refer to this method as‘onTarget’in the remain-der of the text; see Materials and methods for details). For
[image:5.595.58.538.88.563.2]CopywriteR correlated better with LC-WGS, as was reflected by a higher Pearson correlation coefficient and a lower Euclidian distance. Thus, from this analysis it appears that CopywriteR outperforms the onTarget method.
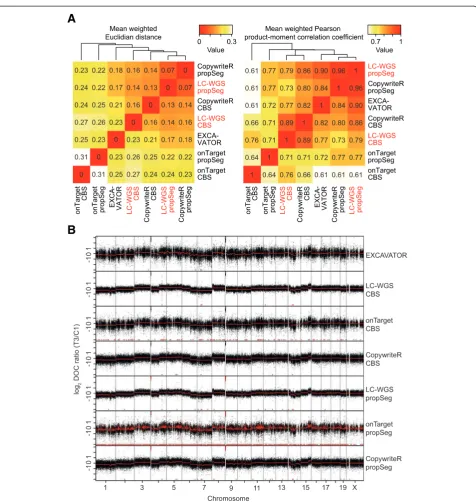
CopywriteR outperforms exonic read-based methods for copy number detection
To extend our analysis of the potential of CopywriteR, we next analyzed the entire sequence dataset of nine mouse mammary tumors, and measured the perform-ance of CopywriteR and onTarget approaches based on downstream segmentation analysis. We included two of the most recent and best segmentation algorithms, prop-Seg [20,21] and circular binary segmentation (CBS) [29]. In addition, we included EXCAVATOR, a tool dedicated to obtaining copy number information from WES ef-forts. For this analysis, we compared the performance to results obtained from LC-WGS data.
To assess the similarity between these methods and the LC-WGS reference, we derived the mean weighted variant of both the Euclidian distance and the Pearson correlation coefficient between each set of methods based on segmentation values obtained using CBS or propSeg. These measures were then used for clustering analysis (Figure 3A). We observed that LC-WGS and CopywriteR-derived copy number states were least dis-tant, irrespective of the segmentation algorithm that was applied. Similarly, the correlation between LC-WGS and
CopywriteR was highest, albeit that these approaches formed sub-clusters based on the applied segmentation approach. Also, when comparing copy number profiles and the resulting segmentation values, CopywriteR and LC-WGS data appeared most alike (Figure 3B). Thus, despite the variation in WES and LC-WGS reads among the samples (see Additional file 1), CopywriteR outper-forms the onTarget approach, and the segmentation values of CopywriteR-derived copy number profiles are more similar to those of LC-WGS than other exonic read-based methods.
A possible limitation of CopywriteR may be that its performance depends on the effectiveness of target en-richment, as a higher capture efficiency would lead to fewer off-target reads, and therefore result in less accur-ate copy number information. To exclude this possibil-ity, we obtained a set of 16 sequence files from The Cancer Genome Atlas (TCGA) with matching copy number information from SNP6 arrays (see Materials and methods), and performed a similar analysis. For the entire dataset, the mean weighted Euclidian distance of CBS-derived segmentation values of SNP6 was closest to those of CopywriteR. In addition, the mean weighted Pearson correlation coefficient SNP6 also correlated best with CopywriteR (Additional file 2: Figure S5A). More-over, while the onTarget method suffered from ‘noisy’ segmentation, this was much less the case for SNP6 and CopywriteR approaches (Additional file 2: Figure S5B). Thus, together with our previous analyses, these results show that CopywriteR outperforms other exonic read-based approaches.
[image:6.595.55.291.125.233.2]While comparing the onTarget and CopywriteR ap-proaches on a dataset of six melanoma PDX (T98-T103) with matched germline samples, we observed two phe-nomena that could explain the better performance of CopywriteR. While the dispersion of the germline samples in the dataset (C43 to C47) was slightly lower for the onTarget method compared to CopywriteR (Additional file 2: Figure S6A; left panel), there were more outliers (data points >1.5× the interquartile range away from the first and third quartiles) with onTarget (Additional file 2: Figure S6A; right panel). These outliers appeared to specifically concentrate at discrete values, suggesting that they corresponded to capture regions with low DOC. Indeed, when we highlighted bins according to their absolute normalized compensated DOC in the tumor sample from low (red) to high (dark gray), we observed that the large majority of outliers obtained with the onTarget approach are regions with low DOC, while this was not the case for CopywriteR (Additional file 2: Figure S6B). Thus, whereas onTarget copy num-ber profiles display differences in technical noise de-pending on the bait efficiency, CopywriteR does not suffer from this limitation.
Table 2 MAD values, signal, and signal-to-noise ratios of CopywriteR and arrayCGH-derived copy number profiles from the murine small-cell lung cancer sample set
CopywriteR Nimblegen
MAD Signal SNR MAD Signal SNR Genomic location
T21 0.351 0.585 1.67 0.246 0.49 1.99 chr2: 141-182 Mb
T22 0.341 0.532 1.56 0.276 0.493 1.79 chr2: 147-182 Mb
T23 0.479 -0.626 1.31 0.219 -0.443 2.02 chr7: 116-153 Mb
T24 0.580 1.115 1.92 0.274 0.737 2.69 chr10: 80-108 Mb Table 1 MAD values, signal, and signal-to-noise ratios of CopywriteR and SNP6-derived copy number profiles from the PDX-derived human melanoma sample set
CopywriteR SNP6
MAD Signal SNR MAD Signal SNR Genomic location
T98 0.206 0.722 3.50 0.547 0.721 1.32 chr6p
T99 0.241 0.344 1.43 0.610 0.302 0.50 chr16
T100 0.225 0.618 2.75 0.680 0.649 0.95 chr1q
T101 0.252 0.996 3.95 0.927 0.829 0.89 chr1q
T102 0.248 0.592 2.39 0.753 0.617 0.82 chr8q
[image:6.595.57.291.651.733.2]Another explanation for CopywriteR’s better perform-ance is that segmentation tools appear to perform better on CopywriteR-derived DOC. One problem with seg-mentation algorithms is the sheer number of segments that are called, with over-segmentation frequently occur-ring. The CBS algorithm appointed a limited number of segments on CopywriteR-based data for each of the tumor samples (T98 to T103), and the number was comparable to that obtained using EXCAVATOR. In contrast, application of the onTarget method resulted in clear over-segmentation (Additional file 2: Figure S7A and B). Thus, in contrast to CopywriteR-derived copy number information, on-target DOC constitutes a poor substrate for traditional segmentation algorithms. In sum, CopywriteR outperforms other exonic read-based methods, potentially due to both the presence of a high number of outliers in on-target data and the poor per-formance of traditional segmentation algorithms on these types of data.
CopywriteR allows for copy number detection without a reference
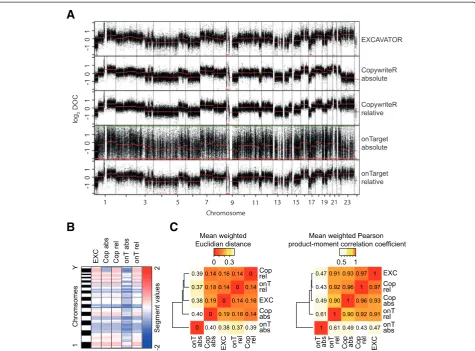
Patient samples are frequently subjected to WES, to-gether with a matched germline reference sample for variant detection. In some cases, however, a reference sample is absent. A similar limitation applies to cultured cell lines and archival tissue, for which reference mater-ial is rarely available. Others have already shown that LC-WGS can be used to generate copy number profiles without the need for a reference [10,22,30,31]. Copy-writeR mimics LC-WGS in that it uses uniformly distrib-uted sequence reads. Therefore, we tested the feasibility of using CopywriteR without a reference. We analyzed melanoma PDX sample T99 using CopywriteR and onTarget methods, both with and without a matching reference (‘relative’and ‘absolute’, respectively). Segmen-tation was subsequently performed using CBS. EXCA-VATOR does not have an implementation to perform
the analysis without a reference sample and was there-fore only tested with a reference. All five methods were able to capture the main somatic copy number aberra-tions (Figure 4A). As expected, the onTarget-absolute method was highly noisy due to the differences in bait efficiency. In contrast, application of CopywriteR-absolute resulted in copy number profiles that were highly identical to any of the relative profiles, and this was also the case for the segmentation values obtained using CBS (Figure 4B). We then analyzed the segmenta-tion values for the entire melanoma PDX dataset in terms of the Euclidian distance and the Pearsons correl-ation (Figure 4C). While the onTarget-absolute method displayed limited similarity to the approaches using a reference, CopywriteR-absolute was highly concordant with the relative methods. Thus, these analyses show that CopywriteR is unique in its ability to extract accur-ate copy number information from targeted sequencing data without a reference.
CopywriteR can be applied to sequencing data from various sources
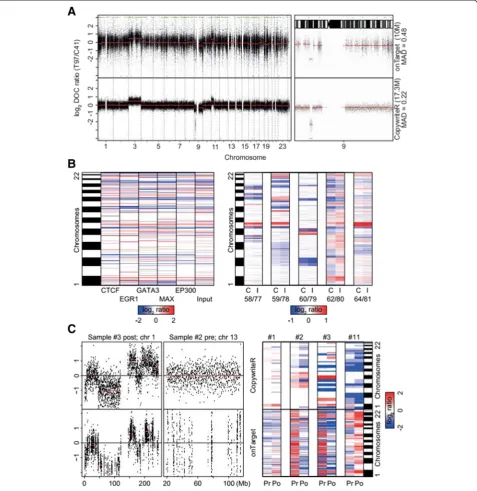
[image:7.595.58.540.111.265.2]All samples that we analyzed thus far were from frozen material and thus based on high-quality DNA. Since (tumor) tissue is often archived as formalin-fixed, paraffin-embedded (FFPE), we challenged CopywriteR’s performance with sequencing data obtained from DNA of such suboptimal quality. We compared the perfor-mances of CopywriteR and onTarget on WES data ob-tained from DNA of an FFPE melanoma biopsy. We observed that the technical noise in the profile of the onTarget method was higher compared to the CopywriteR method (Figure 5A), which was also reflected by higher MAD values for onTarget (0.52) relative to CopywriteR (0.22). In addition, the onTarget method displayed GC-content bias (compare the GC-rich chromosomes 19 and 22 with GC-poor chromosomes 13 and 18 [32,33]), which was absent from the profiles that were analyzed with
Table 3 MAD values, signal, and signal-to-noise ratios of CopywriteR, onTarget, and LCWGS-derived copy number profiles from the murine breast cancer sample set
CopywriteR LC-WGS onTarget
MAD Signal SNR MAD Signal SNR MAD Signal SNR Genomic location
T60 0.262 0.523 2.00 0.176 0.501 2.85 0.159 0.467 2.94 chr6: 52-120 Mb
T56 0.250 0.494 1.98 0.170 0.513 3.02 0.172 0.568 3.30 chr16: 12-25 Mb
T20 0.314 1.099 3.50 0.271 0.978 3.61 0.653 1.135 1.74 chr8:7-16 Mb
T62 0.265 0.421 1.59 0.185 0.403 2.18 0.160 0.376 2.35 chr8: 3-47 Mb
T19 0.252 1.314 5.21 0.163 1.272 7.80 0.591 1.24 2.10 chr8:22-39 Mb
T2 0.395 0.303 0.77 0.255 0.335 1.31 0.230 0.344 1.50 chr5:38-152 Mb
T3 0.293 0.401 1.37 0.212 0.361 1.70 0.181 0.286 1.58 chr15:87-104 Mb
T7 0.597 0.395 0.66 0.538 0.398 0.74 0.330 0.371 1.12 chr6
CopywriteR. Thus, the better performance of CopywriteR is also observed for samples of sub-optimal DNA quality.
ChIPseq is a widely used technique combining chro-matin immunoprecipitation (ChIP) with NGS to identify the binding sites of DNA-associated proteins. Because
the enrichment of genomic regions containing such binding sites is relatively poor, we hypothesized that suf-ficient off-target reads would be available for CopywriteR to derive accurate copy number profiles. We tested this on the breast cancer cell line MCF7 for which sequence
A
[image:8.595.60.537.84.587.2]B
data from both input material as well as multiple ChIP-seq experiments for a number of DNA-associated pro-teins (ER, EGR1, GATA3, CTCF, MAX, and EP300) are available [34]. Using downstream segmentation analysis with CBS, we observed that CopywriteR accurately and reproducibly detected copy number changes (Figure 5B; left panel and Additional file 2: Figure S8).
In addition, we analyzed five publically available ChIP-seq samples [35] using CopywriteR and CBS, and com-pared the resulting copy number information to that from the input material. DNA copy number profiles of 20 kb resolution were very similar between CopywriteR and input material-derived data, as illustrated in a heat-map (Figure 5B; right panel) and on genome-wide copy number profiles (Additional file 2: Figure S9). In sum, CopywriteR not only performs well on WES data, but also on other types of next-generation sequencing data, such as those obtained from ChIPseq.
Based on the performance of CopywriteR on WES, we wanted to further challenge CopywriteR and test its per-formance on targeted sequencing of a small-size gene panel. We used a set of biopsies from four patients with
BRAFV600E-mutant melanoma, where for each patient,
samples before and after vemurafenib (a clinical BRAF in-hibitor) treatment, as well as matching normal references, are available. Samples were sequenced following target en-richment for 1,977 genes (29,596 exons; 115,332 baits; [36,37]). While the percentage of off-target reads was similar to that of WES (3.0% to 12.0%), the total amount of reads (26.9 to 74.9 million reads) was lower in this data-set. As a result, the number of off-target reads was also relatively low; we therefore increased the bin size to which CopywriteR analysis was applied to 100 kb (Figure 5C; left panel and Additional file 2: Figure S8). For the onTarget method, copy number information was sparsely available, and data segmentation was inaccurate as evidenced from
A
[image:9.595.61.537.88.439.2]B
C
over-segmentation of the data (155 to 459 segments). In contrast, CopywriteR produced evenly distributed copy number information across the entire genome, with accur-ate segmentation as a result (26 to 53 segments). Although
[image:10.595.60.538.90.582.2]copy number data (Figure 5C; right panel). Thus, while the inherent focus of targeted sequencing for a small-size gene panel is limited to a few regions of the genome, CopywriteR is uniquely able to expand this focus and ob-tain accurate genome-wide copy number information.
Discussion
Targeted sequencing is commonly used in cancer re-search and clinical genetics [8,38], mainly for mutation detection. Such sequencing data can also be used to ex-tract DNA copy number information, and the demand for this has led to the recent development of numerous exonic DOC-based methods (for a review see [21]). However, the non-uniform genomic distribution of cap-tured exons and the differences in bait efficiency limit the detection of CNAs in gene-poor regions, and consti-tute challenges for downstream analysis.
Here, we describe an alternative to the exonic DOC-based methods available for CNA detection from tar-geted sequencing data. By using the off-target reads that are discarded by conventional methods, we generated high quality and reproducible DNA copy number pro-files. The data quality of CopywriteR-derived copy num-ber information is similar to, or outperforms, dedicated copy number profiling platforms (Figure 2). In addition, CopywriteR performs better than exonic read-based methods with respect to the accuracy of segmentation (Figure 3 and Additional file 2: Figure S5). Thus, Copy-writeR constitutes a better alternative to existing tools for obtaining copy number information from WES.
CopywriteR addresses two main problems of using exon-based DOC. First, CopywriteR is independent of the genomic position of capture baits. As opposed to ex-onic read-based approaches, CopywriteR will provide copy number information on any region in the genome, including for gene-poor regions. Second, the independ-ence of CopywriteR from bait efficiency has the advan-tage that it permits analysis of samples without a reference. In sharp contrast, exon-based DOC methods require a reference, as differences in bait efficiency pre-clude the use of ‘single-channel’ copy number profiles. One could compensate for these differences using a cor-rection based on earlier sequence data using the same capture set. However, it remains to be shown whether this is feasible, as bait efficiencies would need to be con-stant throughout independent experiments.
The applicability of CopywriteR extends beyond WES, as we have shown that CopywriteR can be applied to other data types as well, including ChIPseq and targeted sequencing of small-size gene panels. Preliminary data suggest that also FAIREseq data are a good substrate for CopywriteR analysis. Thus, our data suggest that Copy-writeR can be used to extract copy number information from many other enrichment strategies too.
CopywriteR opens the possibility to extract accurate genome-wide DNA copy number profiles, also in set-tings where this could previously only be reached by means of additional experiments and expenses. For in-stance, we show that CopywriteR performs well on tar-geted sequencing of small-size gene panels, that it has the unique ability to perform well on FFPE archival tis-sue, and that it allows extraction of copy number infor-mation without the need for a reference. These features are unique to CopywriteR and are clinically highly rele-vant, since targeted sequencing is the sequencing type of frequent choice in diagnostic settings, where archival FFPE tissue often lacks reference material. Thus, Copy-writeR has the potential to extract important additional information from both existing and new sequencing ef-forts, thereby unlocking the full potential of sequencing data.
Conclusions
Here, we present a novel tool, called CopywriteR, for the detection of copy number aberrations from targeted se-quencing. All currently available methods are based on exonic depth of coverage, and suffer from the problems that bait efficiencies are non-uniform and that exons are irregularly distributed over the genome. By exploiting the off-target sequence reads, CopywriteR bypasses these problems. It allows for extracting DNA copy number profiles of a high quality comparable to those of ‘dedi-cated’ techniques such as SNP array, arrayCGH, and low-coverage whole-genome sequencing techniques. CopywriteR outperforms exonic read-based approaches and has the ability to derive copy number information even in the absence of a reference. CopywriteR is widely applicable on sequence data ranging from ChIPseq to targeted sequencing on a small-size gene panel. Without the need for additional experiments and expenses, Copy-writeR opens new possibilities to further mine both existing and future sequencing efforts.
Materials and methods Sample selection
treatments melanoma samples, as well as germline refer-ences [37]. The ChIPseq datasets include: (1) the breast cancer cell line MCF7 which was analyzed with multiple ChIPseq samples with six DNA associated proteins (ER, EGR1, GATA3, CTCF, MAX, and EP300) as well as input material as a control [34]; and (2) five breast cancer sam-ples enriched for ER-binding sites and matching input control samples [35]. Detailed information (including origin, sequencing method, sequence depth, and other sequencing statistics) for all samples is documented in Additional file 1.
In addition to sequencing data, PDX-derived melan-oma and TCGA data were analyzed using Affymetrix SNP6; mSCLC samples were analyzed on Nimblegen ar-rays; mouse mammary tumors were analyzed by WG-LCS. The Animal Experimental Committee approved all animal experiments. Samples were collected following approval of the Medical Ethical Committee of the NKI (study code N03LAM) and in compliance with the Helsinki Declaration. Previously unpublished data have been made available through the NCBI Gene Expression Omnibus (GEO) [39] (accession number GSE60259), the European Nucleotide Archive (ENA) [40] (accession number PRJEB6954), and the European Genome-phenome Archive (EGA) [41] (accession number EGAS00001000617).
Data processing
Segmentation of all copy number profiles was calculated using CBS [29] as implemented in the R-package CGHcall 2.22.0 [42], except where indicated using prop-Seg [20]. The median absolute deviation (MAD) was cal-culated using madDiff from the R-package matrixStats 0.10.0 [43]. Signal-to-noise ratios were calculated by div-iding the absolute segmentation value for a large seg-mented genomic region (called using CBS) by its MAD value. All human and mouse data were mapped onto the hg19 and mm10 reference genomes, respectively. Random sampling of sequence reads was performed using SAM-tools view -s 0.1.18 [44].
Whole-exome sequencing
DNA libraries were prepared using the Illumina Paired End Sample Prep Kit according to the manufacturer’s protocol. Target enrichment was performed using the Nimblegen SeqCap EZ Mouse 53.4 Mb, Agilent SureSe-lect Mouse all Exon Kit V1, Agilent SureSeSureSe-lect Human Exon Kit V4, and Agilent SureSelect Human Exon Kit 50 Mb capture sets. Sequencing was performed on Illu-mina HiSeq 2000 sequencers. Reads were mapped by bwa 0 to 7.5 [45] with default settings. SAM files were processed using Picard 1.101 [46], SAMtools and the Genome Analysis ToolKit (GATK) release 2.7-4 [47]. In brief, SAM files were binary compressed, sorted, and
indexed by SAMtools (samtools view, sort, and index tools), duplicated reads were removed by Picard (with MarkDuplicates), and base quality score recalibration and local realignment around indels followed the recom-mended workflow of the GATK toolkit (RealignerTarget-Creator, IndelRealigner, BaseRecalibrator, and PrintReads).
Targeted sequencing
DNA of eight melanoma samples was isolated and sub-jected to targeted sequencing of designed ‘Cancer mini-genome’consisting of 1,977 cancer genes, based on [36]. Pools of libraries were enriched for this gene set using SureSelect technology (Agilent Technologies, Santa Clara, CA, USA). Enriched libraries were sequenced to an average coverage of 150× on a SOLiD 5,500 × l instrument according to the manufacturer’s protocol. Mapping, variant calling, and annotation was done as previously described [36,37].
arrayCGH
Mouse SCLC samples were analyzed with Nimblegen 135 K arrayCGH (12 × 135 k WG-T array, 091016_MM9_RK_CGH_HX12) containing 137,221in
situ synthesized oligonucleotides (Roche Nimblegen, Madison, WI, USA). Labeling was performed with 250 ng of input DNA according to the manufacturer’s instructions. Image acquisition of the Nimblegen ar-rays was performed with the Agilent DNA Microarray Scanner (Model G2505B, Serial number US22502518) and image analysis was performed using Nimblescan software version 2.6 (Roche Nimblegen).
SNP6 data and pre-processing
Melanoma derived from PDX were run on Affymetrix SNP6 chips for copy number analysis. All arrays were run according to the manufacturers’ instructions. DNA processing, preparation, hybridization, and chip scanning were performed at the Wellcome Trust Sanger Institute (WTSI). The data were normalized using the CRLMM [48] package and HapMap reference data as provided by Affymetrix [49].
Whole-genome low-coverage sequencing
Mouse mammary tumors were analyzed by WGS with an average genome coverage of 0.2×, and the same read-count based method was used as applied in CopywriteR. Total read counts for each sample are documented in Additional file 1.
CopywriteR workflow
regions enriched for sequencing reads (peaks) are iden-tified in reference samples using MACS 1.4 [50]; and (3) reads corresponding to peak regions identified in step (2) are discarded in sample and reference using bedtools 2.19.1.
DOC ratios for each bin are calculated as follows: (1) DOC is calculated for genome-wide 20 kb bins (unless indicated otherwise) using Rsamtools 1.14.3; (2) DOC is compensated for reduced effective bin sizes upon removal of peak region reads (that is, if x is the cumulative length of all MACS-peaks in base pairs within one 20 kb bin, compensated DOC = uncompensated DOC * 20,000/ (20,000 - x)); (3) DOC is corrected for GC content and mappability using two loess normalization steps, and re-gions of copy number variation are discarded according to the uniqueness of the ENCODE reference genome [34] (these correction steps are implemented in CopywriteR); (4) median normalization and log2transformation of the corrected and compensated DOC; (5) subtraction of log2 transformed, corrected, and compensated DOC of the ref-erence sample (for creating relative copy number profiles); and (6) reporting in log files.
All the algorithms and methods have been imple-mented in the CopywriteR package, which uses R and Unix command-line utilities. CopywriteR takes BAM files from targeted sequencing as input. CopywriteR is parallelized where possible to allow simultaneous pro-cessing of multiple samples, and is executed using three functions. The first function generates mappability and GC-content files for the provided bin size. The second function calculates compensated read counts, performs the mappability and GC-content-based normalization steps and applies a filter for regions of germline copy number variation. The results are provided in tab-separated format. The third function is optional and al-lows segmentation using CBS [29] as implemented in the R-package CGHcall 2.22.0 [42], and plotting of the results. One parallel run of CopywriteR on a desktop computer with a 2.7 GHz CPU and 12 GB of RAM on two samples of 156 and 144 million sequence reads takes under 2 h. Our package (v1.3), as deployed on the data described here, is available for download from GitHub [25].
Comparison array and SNP methods to WES copy number data
CopywriteR-derived copy number ratios were compared to Affymetrix SNP6 (PDX-derived melanoma) and Nim-blegen 135 K (mSCLC) by constructing pseudo counts matching bins of the CopywriteR analysis. More specific-ally, for creating Nimblegen pseudo counts, the count of a particular bin was set to the intensity of the arrayCGH probe that is nearest to the center of that bin. For Affy-metrix SNP6 data, the average intensity of all probes that
fall within each bin was set as a pseudo count. Segmen-tation using CBS [29] was performed on the Nimblegen and Affymetrix pseudo counts with identical settings as for the CopywriteR-derived copy number profiles.
Use of onTarget, EXCAVATOR, and segmentation methods
The onTarget method is near-identical to ExomeCNV [12] and calculates the mean depth of coverage per base pair for sequence reads that map to a particular capture region for a specific capture set. It follows the Copy-writeR workflow, with the difference that it disregards background reads, and that it does not apply peak re-moval in compensation steps. EXCAVATOR, CBS, and propSeg were used according to the package manuals.
Distance and correlation calculation
For the calculation of the distance and correlation mea-sures of a set of segmentation values, we first extracted all overlapping genomic regions between the set, and cal-culated the weighted Euclidian distance and the weighted Pearson product-moment correlation coefficient for these regions (the weighing is based on the length of a specific overlapping region). When applying this to a set of sam-ples, we calculated mean weighted variants of the distance and correlation measures.
Repositories
Locations of pseudogenes (versions human68 and mouse76) were obtained from pseudogene.org; loca-tions of Ensembl genes (version Ensembl Genes 75) were obtained from the Biomart repository.
Additional files
Additional file 1:Tumor and reference samples used in this study.
Description of the material used for sequencing, and specifications of WES/LC-WGS, depth of coverages, and peaks called by MACS.
Additional file 2: Figures S1 to S9.This document contains supplementaryFigures S1-9.
Abbreviations
Bp:Base pairs; CBS: Circular binary segmentation; CGH: Comparative genomic hybridization; ChIPseq: Chromatin immunoPrecipitation sequencing; CNA: Copy number aberration; DOC: Depth of coverage; FFPE: Formalin-Fixed Paraffin-Embedded; Indel: Insertion/deletion; Kb: kilobases; MACS: Model-based analysis of ChIPseq; SNP: Single nucleotide polymorphism; WES: Whole-exome sequencing; WGS: Whole-genome sequencing.
Competing interests
The authors declare that they have no competing interests.
Authors’contributions
the ChIPseq dataset experiments. LB conceived and conducted the mSCLC experiments. JR and JJ conceived and conducted the breast cancer mouse model experiments. TK, OK, and DP wrote the manuscript. AV, KK, MR, LB, BY, JR, JJ, LW, and DA revised the manuscript. KK, DA, MR, LB, JR, JJ, SR, and GX provided WES samples. All authors read and approved the manuscript.
Acknowledgements
We would like to acknowledge the Center of Personalized Cancer Treatment (CPCT) for providing samples, Daniel Vis and Sander Canisius for data acquisition and the High Performance Computing (HPC) facility of the NKI. This work was supported by a Dutch Cancer Society (KWF) long-term fellowship to TK, a KWF grant to KK, the ERC Synergy Project CombatCancer to DSP, and a Queen Wilhelmina Award grant from the Dutch Cancer Society (KWF Kankerbestrijding) to DSP.
Author details
1
Division of Molecular Oncology, Netherlands Cancer Institute, Plesmanlaan 121, 1066 CX Amsterdam, The Netherlands.2Central Genomic Facility,
Netherlands Cancer Institute, Amsterdam, The Netherlands.3Experimental Cancer Genetics, Wellcome Trust Sanger Institute, Hinxton, UK.4Division of
Molecular Genetics, Netherlands Cancer Institute, Amsterdam, The Netherlands.5Division of Molecular Carcinogenesis, Netherlands Cancer
Institute, Amsterdam, The Netherlands.6Division of Molecular Pathology, Netherlands Cancer Institute, Amsterdam, The Netherlands.7Center for
Personalized Cancer Treatment, Amsterdam, The Netherlands.8Department of Pathology, VU University Medical Center, Amsterdam, The Netherlands.
9
Vetsuisse Faculty, Institute of Animal Pathology, University of Bern, Bern, Switzerland.
Received: 3 January 2015 Accepted: 20 February 2015
References
1. Mardis ER, Wilson RK. Cancer genome sequencing: a review. Hum Mol Genet. 2009;18:R163–8.
2. Shendure J, Ji H. Next-generation DNA sequencing. Nat Biotechnol. 2008;26:1135–45.
3. Ng SB, Turner EH, Robertson PD, Flygare SD, Bigham AW, Lee C, et al. Targeted capture and massively parallel sequencing of 12 human exomes. Nature. 2009;461:272–6.
4. Hodges E, Xuan Z, Balija V, Kramer M, Molla MN, Smith SW, et al. Genome-wide in situ exon capture for selective resequencing. Nat Genet. 2007;39:1522–7.
5. Zack TI, Schumacher SE, Carter SL, Cherniack AD, Saksena G, Tabak B, et al. Pan-cancer patterns of somatic copy number alteration. Nat Genet. 2013;45:1134–40.
6. Hanahan D, Weinberg RA. Hallmarks of cancer: the next generation. Cell. 2011;144:646–74.
7. Wang T-L, Maierhofer C, Speicher MR, Lengauer C, Vogelstein B, Kinzler KW, et al. Digital karyotyping. Proc Natl Acad Sci U S A. 2002;99:16156–61. 8. Network CGA. Comprehensive molecular characterization of human colon
and rectal cancer. Nature. 2012;487:330–7.
9. McLendon R, Friedman A, Bigner D, Van Meir EG, Brat DJ, Mastrogianakis GM, et al. Comprehensive genomic characterization defines human glioblastoma genes and core pathways. Nature. 2008;455:1061–8. 10. Scheinin I, Sie D, Bengtsson H, van de Wiel MA, Olshen AB, van Thuijl HF,
et al. DNA copy number analysis of fresh and formalin-fixed specimens by shallow whole-genome sequencing with identification and exclusion of problematic regions in the genome assembly. Genome Res. 2014;24:2022–32.
11. Magi A, Tattini L, Cifola I, D’Aurizio R, Benelli M, Mangano E, et al. EXCAVATOR: detecting copy number variants from whole-exome sequencing data. Genome Biol. 2013;14:R120.
12. Sathirapongsasuti JF, Lee H, Horst BAJ, Brunner G, Cochran AJ, Binder S, et al. Exome sequencing-based copy-number variation and loss of heterozygosity detection: ExomeCNV. Bioinformatics. 2011;27:2648–54.
13. Holt C, Losic B, Pai D, Zhao Z, Trinh Q, Syam S, et al. WaveCNV: allele-specific copy number alterations in primary tumors and xenograft models from next-generation sequencing. Bioinformatics. 2014;30:768–74.
14. Lonigro RJ, Grasso CS, Robinson DR, Jing X, Wu Y-M, Cao X, et al. Detection of somatic copy number alterations in cancer using targeted exome capture sequencing. Neoplasia. 2011;13:1019–25.
15. Varambally S, Cao Q, Mani RS, Shankar S, Wang X, Ateeq B, et al. Genomic loss of microRNA-101 leads to overexpression of histone methyltransferase EZH2 in cancer. Science. 2008;322:1695–9.
16. Poliseno L, Salmena L, Zhang J, Carver B, Haveman WJ, Pandolfi PP. A coding-independent function of gene and pseudogene mRNAs regulates tumour biology. Nature. 2010;465:1033–8.
17. Bierkens M, Krijgsman O, Wilting SM, Bosch L, Jaspers A, Meijer GA, et al. Focal aberrations indicate EYA2and hsa-miR-375as oncogene and tumor suppressor in cervical carcinogenesis. Genes Chromosomes Cancer. 2012;52:56–68.
18. Fromer M, Moran JL, Chambert K, Banks E, Bergen SE, Ruderfer DM, et al. Discovery and statistical genotyping of copy-number variation from whole-exome sequencing depth. Am J Hum Genet. 2012;91:597–607. 19. Krumm N, Sudmant PH, Ko A, O’Roak BJ, Malig M, Coe BP, et al. Copy
number variation detection and genotyping from exome sequence data. Genome Res. 2012;22:1525–32.
20. Rigaill GJ, Cadot S, Kluin RJC, Xue Z, Bernards R, Majewski IJ, et al. A regression model for estimating DNA copy number applied to capture sequencing data. Bioinformatics. 2012;28:2357–65.
21. Tan R, Wang Y, Kleinstein SE, Liu Y, Zhu X, Guo H, et al. An evaluation of copy number variation detection tools from whole-exome sequencing data. Hum Mutat. 2014;35:899–907.
22. Samuels DC, Han L, Li J, Quanghu S, Clark TA, Shyr Y, et al. Finding the lost treasures in exome sequencing data. Trends Genet. 2013;29:593–9. 23. Zhang Z, Harrison PM, Liu Y, Gerstein M. Millions of years of evolution
preserved: a comprehensive catalog of the processed pseudogenes in the human genome. Genome Res. 2003;13:2541–58.
24. Flicek P, Amode MR, Barrell D, Beal K, Billis K, Brent S, et al. Ensembl 2014. Nucleic Acids Res. 2014;42:D749–55.
25. CopywriteR [https://github.com/PeeperLab/CopywriteR]
26. Greshock J, Feng B, Nogueira C, Ivanova E, Perna I, Nathanson K, et al. A comparison of DNA copy number profiling platforms. Cancer Res. 2007;67:10173–80.
27. Curtis C, Lynch AG, Dunning MJ, Spiteri I, Marioni JC, Hadfield J, et al. The pitfalls of platform comparison: DNA copy number array technologies assessed. BMC Genomics. 2009;10:588.
28. Krijgsman O, Israeli D, Haan JC, van Essen HF, Smeets SJ, Eijk PP, et al. CGH arrays compared for DNA isolated from formalin-fixed, paraffin-embedded material. Genes Chromosomes Cancer. 2011;51:344–52.
29. Olshen AB, Venkatraman ES, Lucito R, Wigler M. Circular binary segmentation for the analysis of array-based DNA copy number data. Biostatistics. 2004;5:557–72.
30. Wood HM, Belvedere O, Conway C, Daly C, Chalkley R, Bickerdike M, et al. Using next-generation sequencing for high resolution multiplex analysis of copy number variation from nanogram quantities of DNA from formalin-fixed paraffin-embedded specimens. Nucleic Acids Res. 2010;38:e151.
31. Magi A, Tattini L, Pippucci T, Torricelli F, Benelli M. Read count approach for DNA copy number variants detection. Bioinformatics. 2012;28:470–8. 32. Pinkel D, Segraves R, Sudar D, Clark S, Poole I, Kowbel D, et al. High
resolution analysis of DNA copy number variation using comparative genomic hybridization to microarrays. Nat Genet. 1998;20:207–11. 33. Lander ES, Linton LM, Birren B, Nusbaum C, Zody MC, Baldwin J, et al. Initial
sequencing and analysis of the human genome. Nature. 2001;409:860–921. 34. ENCODE Project Consortium. An integrated encyclopedia of DNA elements
in the human genome. Nature. 2012;489:57–74.
35. Ross-Innes CS, Stark R, Teschendorff AE, Holmes KA, Ali HR, Dunning MJ, et al. Differential oestrogen receptor binding is associated with clinical outcome in breast cancer. Nature. 2012;481:389–93.
36. Vermaat JS, Nijman IJ, Koudijs MJ, Gerritse FL, Scherer SJ, Mokry M, et al. Primary colorectal cancers and their subsequent hepatic metastases are genetically different: implications for selection of patients for targeted treatment. Clin Cancer Res. 2012;18:688–99.
38. de Ligt J, Boone PM, Pfundt R, Vissers LELM, Richmond T, Geoghegan J, et al. Detection of clinically relevant copy number variants with whole-exome sequencing. Hum Mutat. 2013;34:1439–48.
39. Gene Expression Omnibus. [http://www.ncbi.nlm.nih.gov/geo] 40. European Nucleotide Archive. [http://www.ebi.ac.uk/ena/home] 41. European Genome-phenome Archive. [http://www.ebi.ac.uk/ega/home] 42. van de Wiel MA, Kim KI, Vosse SJ, van Wieringen WN, Wilting SM, Ylstra B.
CGHcall: calling aberrations for array CGH tumor profiles. Bioinformatics. 2007;23:892–4.
43. MatrixStats. [https://github.com/HenrikBengtsson/matrixStats] 44. Li H, Handsaker B, Wysoker A, Fennell T, Ruan J, Homer N, et al. The
Sequence Alignment/Map format and SAMtools. Bioinformatics. 2009;25:2078–9.
45. Li H, Durbin R. Fast and accurate short read alignment with Burrows-Wheeler transform. Bioinformatics. 2009;25:1754–60.
46. Picard. [http://broadinstitute.github.io/picard/]
47. DePristo MA, Banks E, Poplin R, Garimella KV, Maguire JR, Hartl C, et al. A framework for variation discovery and genotyping using next-generation DNA sequencing data. Nat Genet. 2011;43:491–8.
48. Carvalho B, Bengtsson H, Speed TP, Irizarry RA. Exploration, normalization, and genotype calls of high-density oligonucleotide SNP array data. Biostatistics. 2007;8:485–99.
49. International HapMap Consortium. The International HapMap Project. Nature. 2003;426:789–96.
50. Zhang Y, Liu T, Meyer CA, Eeckhoute J, Johnson DS, Bernstein BE, et al. Model-based Analysis of ChIP-Seq (MACS). Genome Biol. 2008;9:R137.
Submit your next manuscript to BioMed Central and take full advantage of:
• Convenient online submission
• Thorough peer review
• No space constraints or color figure charges
• Immediate publication on acceptance
• Inclusion in PubMed, CAS, Scopus and Google Scholar
• Research which is freely available for redistribution