R E S E A R C H
Open Access
DNA methylome profiling of human tissues
identifies global and tissue-specific methylation
patterns
Kaie Lokk
1,2,3, Vijayachitra Modhukur
4, Balaji Rajashekar
4, Kaspar Märtens
4, Reedik Mägi
5, Raivo Kolde
4,
Marina Kolt
š
ina
1, Torbjörn K Nilsson
6, Jaak Vilo
4, Andres Salumets
7,8,9*and Neeme Tõnisson
1,2,5*Abstract
Background:DNA epigenetic modifications, such as methylation, are important regulators of tissue differentiation, contributing to processes of both development and cancer. Profiling the tissue-specific DNA methylome patterns will provide novel insights into normal and pathogenic mechanisms, as well as help in future epigenetic therapies. In this study, 17 somatic tissues from four autopsied humans were subjected to functional genome analysis using the Illumina Infinium HumanMethylation450 BeadChip, covering 486 428 CpG sites.
Results:Only 2% of the CpGs analyzed are hypermethylated in all 17 tissue specimens; these permanently methylated CpG sites are located predominantly in gene-body regions. In contrast, 15% of the CpGs are hypomethylated in all specimens and are primarily located in regions proximal to transcription start sites. A vast number of tissue-specific differentially methylated regions are identified and considered likely mediators of tissue-specific gene regulatory mechanisms since the hypomethylated regions are closely related to known functions of the corresponding tissue. Finally, a clear inverse correlation is observed between promoter methylation within CpG islands and gene expression data obtained from publicly available databases.
Conclusions:This genome-wide methylation profiling study identified tissue-specific differentially methylated regions in 17 human somatic tissues. Many of the genes corresponding to these differentially methylated regions contribute to tissue-specific functions. Future studies may use these data as a reference to identify markers of perturbed differentiation and disease-related pathogenic mechanisms.
Background
DNA methylation is the most extensively studied epigenetic modification of mammalian DNA [1]. DNA methylation of cytosine residues mainly occurs in CpG sequences and has been characterized as an important regulatory mechanism of genome function, having been implicated as a crucial me-diator of embryonic development, transcription, chromo-somal stability, imprinting, and X-chromosome inactivation [2]. The DNA methylation profile itself is not static and sub-ject to dynamic changes induced by age-related factors [3], environmental factors [4], nutritional factors, and patho-genic factors, such as viruses [5,6].
Many previous studies have investigated the DNA methy-lation profiles of various human tissues and conditions. These studies have mainly relied on high-throughput DNA detection methods and sequencing technologies, such as the HumanMethylation450 BeadChip [7], HumanMethyla-tion27 BeadChip [8] and GoldenGate Methylation Cancer Panel I [9-11] arrays (Illumina Inc., San Diego, CA, USA), or microarrays in combination with methylated DNA en-richment by immunoprecipitation [12]. Some previous studies have concentrated on CpG islands in promoter re-gions and characterized for their role in changes to the gene’s expression [8,10], but increasingly more studies are identifying tissue-specific differentially methylated regions (tDMRs) in the gene body regions [12,13]. Although all the previous studies have enabled a broader view of the genome-wide DNA methylation patterns, there still remain questions to be answered, for example, how the tDMRs are * Correspondence:[email protected];[email protected]
7
Competence Centre on Reproductive Medicine and Biology, Tartu, Estonia 1Institute of Molecular and Cell Biology, University of Tartu, Tartu, Estonia
Full list of author information is available at the end of the article
being established and what are the functions of gene-body tDMRs. Determining the human tDMR profile will not only provide important insights into the normal processes of tissue-specific differentiation but may identify markers of pathogenic processes, such as cancer.
In this study, we analyzed the tissue-specific DNA methylome using a panel of 17 somatic tissues obtained from four autopsied individuals. The expanded Illumina Infinium HumanMethylation450 BeadChip was used to interrogate 486 428 CpG sites in the human genome; this advanced platform boasts unbiased coverage of gene and CpG island (CGI) regions reaching up to 99% and 96%, respectively, as well as CpG island shores (2 kb re-gions upstream and downstream of the CpG islands) and shelves (2 kb regions upstream and downstream of the CpG island shores) to reveal a genome-wide methy-lation profile [14].
Our aim was to describe the general patterns of glo-bally conserved and tissue-specific DNA methylation with functional consequences in gene regulation. Using the high-density microarray allowed nearby CpG sites with similar patterns to be grouped together so as to identify broader regions of tDMRs and improve the stat-istical power of the analysis. Our results reveal tissue-specific methylation patterns beyond the well-studied promoter areas, identifying tDMRs in gene body areas and showing these regions to be more likely related to tissue-specific functions. Collectively, these data repre-sent novel insight into the regulatory role of tissue-specific DNA methylation.
Results and discussion
Methylome profiling across 17 somatic tissues
Tissue-specific DNA methylation patterns were studied in the following 17 somatic tissues: abdominal and sub-cutaneous adipose tissue, bone, joint cartilage, yellow and red bone marrow, coronary and splenic artery, ab-dominal and thoracic aorta, gastric mucosa, lymph node, tonsils, bladder, gall bladder, medulla oblongata, and ischiatic nerve. Samples of each of these postmortem specimens were obtained from four individuals upon autopsy, except in the case of one individual (Identifica-tion No. BM419/4) for whom the yellow bone marrow and joint cartilage tissues were not available. The causes of death included: intracerebral hemorrhage (BM419/4; fe-male, 60 years old), heart attack with acute cardiac insuffi-ciency (KA522; male, 53 years old), heart attack (KT538; male, 40 years old), and intracerebral hemorrhage (SJ600-5; male, 54 years old).
Genomic DNA was extracted from each tissue, treated with sodium bisulfite, and subjected to analysis via the Illumina Infinium HumanMethylation450 BeadChip. The methylation levels of CpGs were described as beta values (0 to 1) representing the calculated level of methylation
(0% to 100%). We had two technical and two biological replicates processed by chip technique. The Pearson cor-relation coefficients (PCCs) were >0.99 for all the repli-cates, confirming a good level of reproducibility for the chip process and indicating that the observed differential methylation between the studied tissues represented true biological differences.
Several of the observed DNA methylation differences were selected for verification by conventional Sanger dideoxy sequencing. More specifically, the detected CpG methylation levels of 17 genes encompassing 36 CpGs, including 0% (n= 1) and 100% (n= 2) methylated sites, and of 14 genes with tDMRs, were confirmed by bisulfite sequencing. The BeadChip data strongly correlated with the Sanger sequencing data (mean PCC: 0.93, PCC range: 0.78 to 0.98; Additional file 1). Methylation levels of CpGs adjacent to those present on the BeadChip were also strongly correlated with the Sanger sequencing data (mean PCC 0.95, PCC range: 0.72 to 1.00). Most of the CpGs detected were clustered together, but some CpGs with similar methylation levels and corresponding to a known gene or regulatory region were located >200 bp apart (data not shown). Thus, uniform CpG methylation may involve longer distances for tissue-specific regula-tory mechanisms.
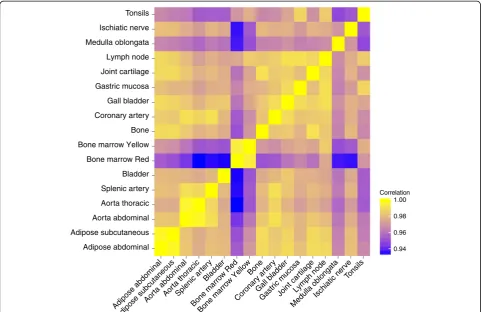
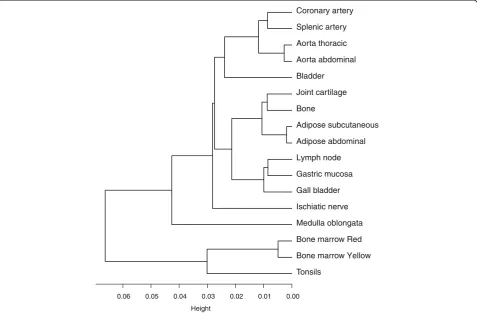
Comparative analysis of the DNA methylation patterns between tissues was carried out to determine a general relatedness profile. The methylation patterns were found to be well conserved between the 17 various tissues that were studied (Figure 1). The lowest correlations were found for red bone marrow versus thoracic and splenic artery,versusbladder, andversusmedulla oblongata and ischiatic nerve (PCC: 0.93). The highest correlations were found among functionally similar tissues, such as the different arteries and aortas, red and yellow bone marrow, and bone and joint cartilage (PCC:≥0.99). Hier-archical clustering of the methylation profiles of the 17 studied tissues showed that most of the similar tissues (for example, aortas and arteries) co-clustered (Figure 2); the strong correlations indicated between similar tissues suggested the presence of tissue-specific methylation profiles.
Genome-wide DNA methylation patterns
non-CGIs (77.4%, 8,287 CpGs; Figure 4A) (Fisher’s exact test,
P<2.2 × 10⁻¹⁶). Thus, DNA methylation appears to be more prominent in the areas where CpG density is low and tran-scription is not usually initiated.
On the other hand, 14.9% of CpGs (72,444 CpGs representing 12,604 genes) were hypomethylated in all of the samples (beta values <0.1). These invariably hypo-methylated CpGs were mostly located in gene promoter areas (73.2%, 53,057 CpGs), including the sequence re-gion from -200 to -1,500 nt upstream of the transcrip-tion start site (TSS1500), the region from -200 nt upstream to the TSS itself (TSS200), and the region from the 5’-UTR through the first exon (Figure 3). In addition, the hypomethylated CpGs were found in CGI regions (73.0%, 52,862 CpGs; Figure 4A) (Fisher’s exact test,P<2.2 × 10⁻¹⁶). These findings are consistent with the general consensus that gene promoter areas and CGI re-gions of actively transcribed genes are largely unmethy-lated so as to be accessible to transcription factors.
Gene ontology (GO) analysis with the Database for Annotation, Visualization and Integrated Discovery (DA-VID [15]) revealed that many of the genes showing hypermethylation of their CGI-promoter regions had
functions related to the reproductive system; in contrast, many of the genes showing hypomethylation of their CGI-promoter regions had functions associated with housekeeping processes, including RNA processing and cell cycle. When our data of hypomethylated CGI-promoter regions were compared to the housekeeping genes identified by expression profiling in a previous study by Chang et al. [16], we found a 93.0% consensus.
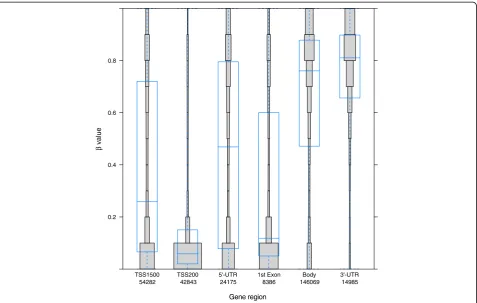
We also found that the DNA methylation pattern of a single gene varies between gene regions; for example, compared to the gene body, the TSS1500, TSS200, 5’-UTR, and first exon showed lower average methylation (Figure 3). These data agree with those from previous studies and in line with the notion that promoter areas of housekeeping genes would be accessible to support active transcription [17].
Comparison of DNA methylation in CGI and non-island regions
It is well recognized that DNA methylation patterns can differ significantly across the different regions of CGIs, with methylation levels increasing at the boundaries. In our study, the highest levels of methylation were found
Adipose abdominal Adipose subcutaneous Aorta abdominal Aorta thoracic Splenic artery Bladder Bone marrow Red Bone marrow Yellow Bone Coronary artery Gall bladder Gastric mucosa Joint cartilage Lymph node Medulla oblongata Ischiatic nerve Tonsils
Adipose abdominal Adipose subcutaneous
Aor
ta abdominalAorta thoracicSplenic ar tery
Bladder
Bone marro w Red
Bone marro w Yellow
Bone
Coronary ar tery
Gall b ladder
Gastric m ucosa
Joint car tilage
Lymph node
Medulla oblongata Ischiatic ner
ve Tonsils
[image:3.595.57.540.89.401.2]0.94 0.96 0.98 1.00 Correlation
in the CGI shelves and shores (Figure 4A). These results are in agreement with those of previous studies [17,18], in which the majority of CGIs were shown to be unmethylated. Also, in our study, the CGI methylation patterns were found to be largely consistent within inter-genic regions and in genes (Figure 4B and 4C). It is pos-sible that maintaining an unmethylated state in a CGI may serve to protect against mutation by spontaneous deamination of methylated cytosines [19].
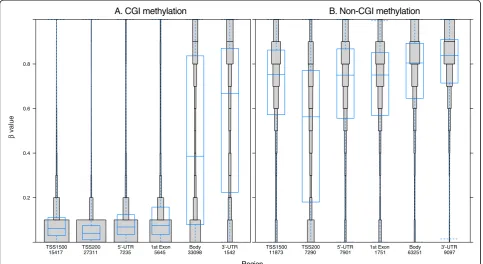
Comparison of CGI methylation patterns across differ-ent parts of individual genes revealed that the promoter areas (TSS1500, TSS200, and 5’-UTR) and the first exon were almost exclusively unmethylated; however, variable CGI methylation levels were found in the gene body and 3’-UTR (Figure 5A). This pattern has been observed by other studies, as well [12,18]. In contrast, the CpGs found in non-CGI regions were found to be mostly methylated, and showed little variation across the differ-ent parts of the individual genes (Figure 5B). Compara-tive analysis of the methylation patterns in CGI shores and shelves in different gene regions revealed that the CGI and CGI shore regions are generally similar, but the
CpGs in the shelves are nearly fully methylated (data not shown).
Tissue-specific differentially methylated regions
Next, the regions with distinctive methylation patterns in certain tissues were analyzed in detail. We applied an algo-rithm to identify statistically significant differential methy-lation existing between two sets of samples in three or more consecutive CpG probes. This new method is based on fitting ANOVA models in moving windows of different lengths, encompassing up to 50 probes. The optimal re-gion boundaries were selected according to the minimum description length (MDL) principle. As a result, every re-gion consists of probes that have similar methylation pat-terns. As HumanMethylation450 BeadChip is focused more on the genes and promoter areas, this robust ap-proach finds more likely regions with a higher CpG probe density.
We used this method to detect tDMRs between one tissue of interest and all other tissues under study. For this analysis, the data from some of the tissues used in this study were combined to correct for the high level of
Tonsils
Bone marrow Yellow Bone marrow Red Medulla oblongata Ischiatic nerve Gall bladder Gastric mucosa Lymph node Adipose abdominal Adipose subcutaneous Bone
Joint cartilage Bladder Aorta abdominal Aorta thoracic Splenic artery Coronary artery
0.00 0.01 0.02 0.03 0.04 0.05 0.06
[image:4.595.60.538.90.403.2]Height
0.2 0.4 0.6 0.8
TSS1500 TSS200 5'-UTR 1st Exon Body 3'-UTR
β
value
Gene region
[image:5.595.61.539.88.391.2]54282 42843 24175 8386 146069 14985
Figure 3DNA methylation in specific gene regions.Distribution of DNA methylation in specific gene regions is shown. Each gene region is further divided into bins that correspond to beta values with 0.1 intervals. The area of each bin corresponds to total number of CpGs. The overall distribution and the mean of beta value of the CpGs in each gene region are shown as a box plot. The most unmethylated regions are associated with promoter sequences (TSS1500, TSS200, and 5′-UTR) and the first exon, while the most methylated regions are in the gene body and 3′-UTR. The numbers on the x-axis correspond to total number of CpGs in each gene region; also the x-axis shows different gene regions, and the y-axis shows the beta values.
Nshelf Nshore Island Sshore Sshelf Non-Island
β
value
A. CGI methylation
Region
B. Intergenic methylation C. Intragenic methylation
Nshelf Nshore Island Sshore Sshelf Non-Island Nshelf Nshore Island Sshore Sshelf Non-Island 0.2
0.4 0.6 0.8
24223 61223 145842 47866 21731 172979 14978 49087 124151 39365 13138 115400 9245 12136 21691 8501 8593 57579
[image:5.595.60.540.478.663.2]functional similarity that existed between them; specific-ally, abdominal and subcutaneous adipose tissues were processed together, as were the thoracic and abdominal aorta, coronary and splenic artery, joint cartilage and bone, and red and yellow bone marrow.
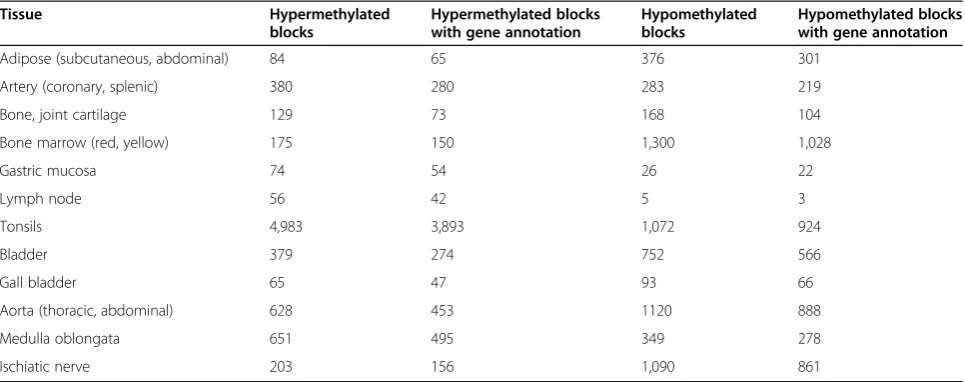
The numbers of different tDMR CpG blocks were found to vary greatly between tissues with different functions (Table 1). The highest number of hypermethylated tDMRs was found in tonsils, followed by medulla oblongata and aortas (abdominal and thoracic). The lowest number of hypermethylated tDMRs was found in lymph nodes. For hypomethylated tDMRs, large numbers were found in bone marrow (red and yellow), aortas (abdominal and thoracic), and ischiatic nerve, while the lowest number was found in the lymph nodes. Of the total 14,441 tDMRs identified (Additional file 3), 11,242 (77.8%) mapped to genes. Among those, 41.7% (4,688) were in gene promoter areas with only 36.5% in CGIs (Fisher’s exact test,P<2.2 × 10⁻¹⁶), and more than one-half (58.3%, 6,554) in gene body regions with 44.1% in CGIs (Fisher’s exact test,P<2.2 × 10⁻¹⁶). The fact that over a half of tDMRs were located in gene bodies and not in promoter areas is intriguing because methylation within a gene body may indicate the presence of alterna-tive promoters [20]. Among the intergenic tDMRs, 45.8% co-localized with CGIs (Fisher’s exact test, P= 0.0003),
intergenic regions might act as regulators, being either en-hancers or silencers and contributing with these mecha-nisms into maintenance of tissue-specific gene expression. These results are in line with those of previous studies, which have shown that tDMRs exist across a range of CpG densities, while tDMRs in promoter areas are largely lo-cated in non-CGI regions [7,11,12,18].
In order to study which regions are the most variable between tissues, we compared the proportion of vari-ance explained by the tissues between different gene re-gions and between CpG islands, shores, and shelves. Additional file 4A and B show the distributions of the R squared statistic, respectively. We can see that in gene body, 3’-UTR and the sites that are not related to genes, exist larger differences between the tissues. But in the gene promoter areas the methylation patterns of tissues are much more similar. This is supported also from the results above, that large number of tDMRs were found within gene body regions. Also, in CpG islands different tissues are more similar than in shores, shelves, and non-island sites.
To characterize the function of genes related to the detected tDMRs, we again performed GO analysis using the DAVID database. We have used a custom back-ground in the GO enrichment analysis, which contains 0.2
0.4 0.6 0.8
TSS1500 TSS200 5’-UTR 1st Exon Body 3’-UTR A. CGI methylation
Region
B. Non-CGI methylation
β
value
TSS1500 TSS200 5’-UTR 1st Exon Body 3’-UTR
[image:6.595.57.541.90.354.2]15417 27311 7235 5645 33098 1542 11873 7290 7901 1751 63251 9097
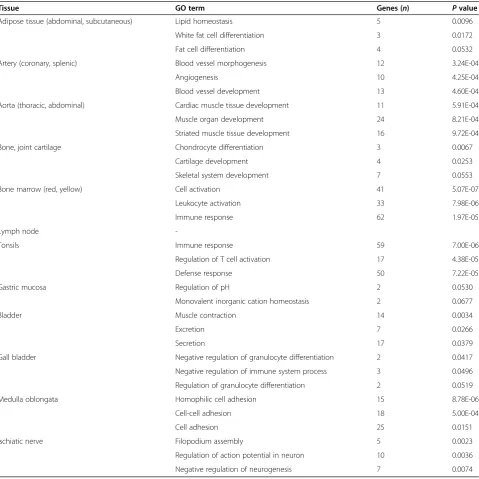
all the genes that were found as tDMRs. This should take in account the distribution of CpG probes on microarray. As shown in Table 2, those genes showing hypomethylation in certain tissues are frequently associ-ated with a tissue-specific function. For example, the hypomethylated genes detected in arteries (including
COL18A1, EPAS1, ENPEP, ANGPT2, and APOLD1) are
characterized as mediators of blood vessel development and morphogenesis, while those detected in tonsils (in-cluding LAX1,TNFSF14, LCK, and RHOH) are involved in immune response and leukocyte activation.
In agreement with previous results, none of the genes showing hypermethylation in specific tissues were associ-ated with tissue-specific biological processes (Additional file 5) [8]. Thus, our results, along with those from earlier studies, strongly support the hypothesis that hypomethyla-tion, and not hypermethylation of genes, is more likely to be associated with the tissue-specific functions.
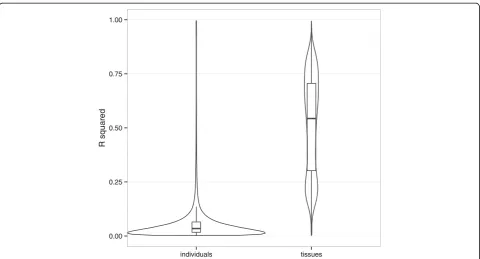
Inter-individual methylation variation
We analyzed the rate of inter-individual variation in order to understand whether individuals or tissues are explaining most of the variability between samples. We compared the proportion of variance of the beta values plained by the individuals and the proportion of variance ex-plained by the tissues. Figure 6 shows the distribution of the R squared statistic obtained for each CpG site. On average, we can see that individuals explain only 6.4% of the variance whereas tissues explain 51.2%, showing that although the variance between individuals exist, it is really insignificant.
The hierarchical clustering (Additional file 6) of all the samples studied is also showing that the similarity be-tween different tissues was higher than bebe-tween individ-uals, as tissues are mostly clustering together. As the number of individuals under investigation was relatively small (n= 4; one woman and three men) and also the
majority of the phenotypic data was lacking, we did not find relevant to analyse the inter-individual methylation variation in detail. Furthermore, it is explaining only subset of variance between samples.
Relation between gene expression and global DNA methylation
To further investigate the role of DNA methylation in regu-lation of gene expression, we compared the detected methylation patterns with publicly available gene expression data (Gene Expression Omnibus (GEO) and ArrayExpress databases). Only tissues with gene expression data obtained using a single platform (Human Genome U133A arrays; Affymetrix, Santa Clara, CA, USA) were selected to de-crease the impact of potential confounding factors. As a re-sult, correlations of gene expression levels were carried out for eight of the 17 tissues used in the original analysis: aorta, bladder, bone, bone marrow, coronary artery, lymph node, medulla oblongata, and tonsils (Additional file 7).
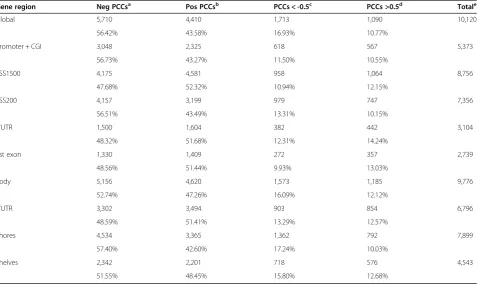
The method by which the global methylation data were correlated with the gene expression data relied on averaging beta values across the comprehensive gene panel. The PCCs were calculated for 10,120 genes across the eight tissues (Table 3) and revealed a slight bias to-wards negatively-correlated genes’ expression (5,710 vs. positively-correlated: 4,410 genes). In addition, nearly twice as many genes showed a strong inverse correlation (1,713 genes, PCCs: <-0.5) than those showing a strong positive correlation (1,090 genes, PCCs: >0.5) (Fisher’s exact test,P<2.2 × 10⁻¹⁶).
[image:7.595.57.540.100.291.2]When analyzing the correlation of global methylation data with different gene regions, the number of negatively-correlated genes in CGI-promoter areas (56.7%) was found to be roughly the same as that in gene bodies (52.7%). Slightly more genes showed a strong inverse correlation than those showing a strong positive correlation, both for Table 1 tDMR data summary
Tissue Hypermethylated
blocks
Hypermethylated blocks with gene annotation
Hypomethylated blocks
Hypomethylated blocks with gene annotation
Adipose (subcutaneous, abdominal) 84 65 376 301
Artery (coronary, splenic) 380 280 283 219
Bone, joint cartilage 129 73 168 104
Bone marrow (red, yellow) 175 150 1,300 1,028
Gastric mucosa 74 54 26 22
Lymph node 56 42 5 3
Tonsils 4,983 3,893 1,072 924
Bladder 379 274 752 566
Gall bladder 65 47 93 66
Aorta (thoracic, abdominal) 628 453 1120 888
Medulla oblongata 651 495 349 278
methylation located within the promoter area and the gene body (11.5% and 10.6% in promoter-CGI; 16.1% and 12.1% in gene body, respectively) (Fisher’s exact test,P= 0.005).
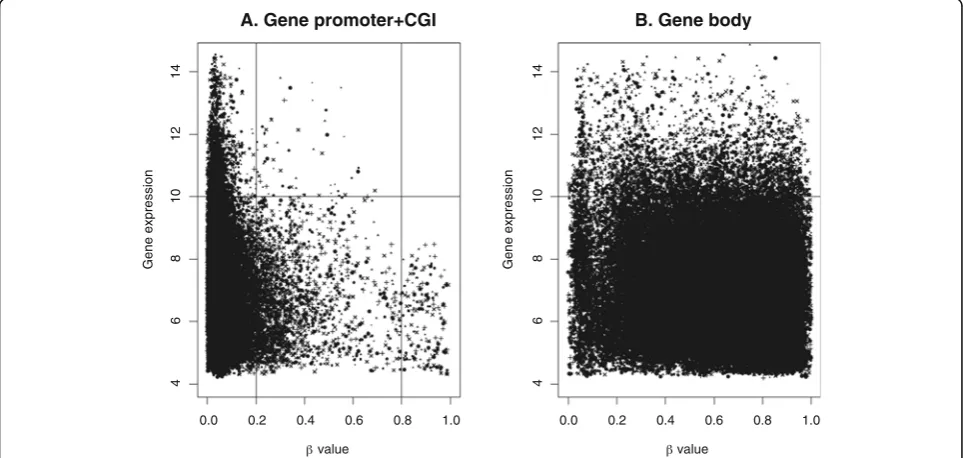
When DNA methylation and gene expression values are similar among a set of various tissues, correlation analysis may be insufficient. To correct for this possibil-ity in our dataset, the methylation and gene expression data were plotted onto a single figure so that the integ-rity of the correlation between CGI-promoter and gene body areas could be further assessed (Figure 7). In the CGI-promoter areas, high levels of methylation were found to be associated with lower gene expression and
low levels of methylation were associated with higher, and varying, levels of gene expression. However, the same relationship was not observed for the data related to gene bodies; the fully methylated and unmethylated genes showed a similar varying trend in their gene ex-pression levels.
[image:8.595.59.539.99.578.2]Our analysis of highly methylated promoters suggested a possible link between the promoter methylation and suppressed gene expression. Similar to our findings, pre-vious studies have reported that genes with unmethy-lated promoters show variable levels of transcription activity [12,18]. Our analysis of methylation in gene Table 2 GO analysis with hypomethylated tDMRs
Tissue GO term Genes (n) Pvalue
Adipose tissue (abdominal, subcutaneous) Lipid homeostasis 5 0.0096
White fat cell differentiation 3 0.0172
Fat cell differentiation 4 0.0532
Artery (coronary, splenic) Blood vessel morphogenesis 12 3.24E-04
Angiogenesis 10 4.25E-04
Blood vessel development 13 4.60E-04
Aorta (thoracic, abdominal) Cardiac muscle tissue development 11 5.91E-04
Muscle organ development 24 8.21E-04
Striated muscle tissue development 16 9.72E-04
Bone, joint cartilage Chondrocyte differentiation 3 0.0067
Cartilage development 4 0.0253
Skeletal system development 7 0.0553
Bone marrow (red, yellow) Cell activation 41 5.07E-07
Leukocyte activation 33 7.98E-06
Immune response 62 1.97E-05
Lymph node
-Tonsils Immune response 59 7.00E-06
Regulation of T cell activation 17 4.38E-05
Defense response 50 7.22E-05
Gastric mucosa Regulation of pH 2 0.0530
Monovalent inorganic cation homeostasis 2 0.0677
Bladder Muscle contraction 14 0.0034
Excretion 7 0.0266
Secretion 17 0.0379
Gall bladder Negative regulation of granulocyte differentiation 2 0.0417
Negative regulation of immune system process 3 0.0496
Regulation of granulocyte differentiation 2 0.0519
Medulla oblongata Homophilic cell adhesion 15 8.78E-06
Cell-cell adhesion 18 5.00E-04
Cell adhesion 25 0.0151
Ischiatic nerve Filopodium assembly 5 0.0023
Regulation of action potential in neuron 10 0.0036
bodies revealed no clear relationship with mRNA expres-sion levels, although previous studies have reported either positive correlation with gene expression [12,21] or bell-shaped correlation patterns [22]. Many genes harbor several alternative TSSs, which are located throughout the gene body and yield different splice isoforms. Methy-lation of such yet unrecognized sites might confound a correlation analysis of gene body methylation and gene expression.
Gene expression and methylation in tDMRs
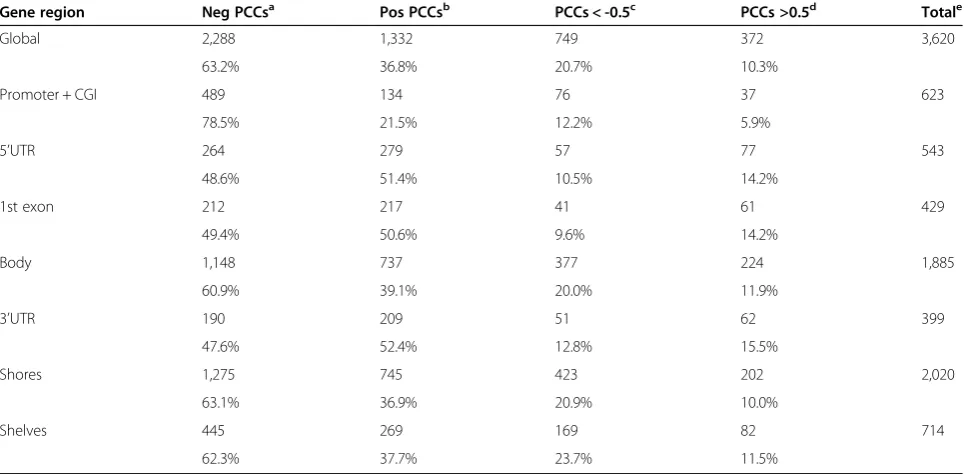
The correlation analysis of tissue-specific methylation with gene expression was carried out by averaging all of the CpG beta values within the tDMRs. Collectively, there were more negative than positive correlation coefficients (63.2%, 2,288 vs. 36.8%, 1,332; Table 4), as expected. In addition, strongly negative PCCs prevailed over the strongly positive PCCs (20.7%, 749 vs. 10.3%, 372, respectively) (Fisher’s exact test,P<2.2 × 10⁻¹⁶).
Our finding of relatively more negative correlations in the gene bodies (60.9%, 1,148) was slightly unexpected, be-cause gene body methylation is not usually related to low expression. However, our finding of a high number of in-versely correlated CpG sites in CGI-promoter regions (78.5%, 489) and finding that genes with highly methylated promoter areas were not highly expressed suggest that methylation in the promoter area corresponds to gene ex-pression changes (Additional file 8).
Conclusions
In this study, we analyzed the genome-wide DNA methyla-tion profiles of human somatic tissues. Although the num-ber of analyzed individuals was limited, the analysis was sufficient to provide DNA methylation distribution patterns across different genomic regions that were largely in agree-ment with patterns previously observed by similar studies. Moreover, our results and their validation by external data-sets revealed a clear correlation between DNA methylation in the gene promoter areas and the gene expression. Mean-while, our analysis of methylation in gene bodies did not re-veal positive [12,21] or bell-shaped [22] correlation patterns with mRNA expression levels, as it is suggested before.
The methylome data alone was sufficient for correctly dis-tinguishing, through hierarchical clustering, between all the 17 tissues studied, collectively demonstrating that tissues are characterized by distinctive methylation patterns that reflect their tissue-specific functions. We were also able to show that the variance explained by tissues is much higher than the variance explained by individuals. As a result of differentially methylated tissue-specific regions analysis, we identified a large number of tDMRs, which were enriched for genes that are closely related to the functions of particular tissue type. Moreover, hypomethylation, and not hypermethylation, was more likely to be associated with the tissue-specific functions.
Our study also provoked the question, of how tDMRs mechanistically contribute to the tissue-specific functions, especially for the numerous methylation regions that were found in gene body areas. In addition, the observation that 0.00
0.25 0.50 0.75 1.00
individuals tissues
[image:9.595.58.539.87.346.2]R squared
the methylation in the gene body areas had also high nega-tive correlation with gene expression suggested that gene body tDMRs might be important in establishing the tissue-specific transcription. Still, it remains unclear, how-ever, how the gene body tDMRs may function as regula-tors of gene expression, and this question should be addressed in the future epigenetic studies.
To our knowledge, this study comprehends methyla-tion data of tissue types that have not been studied yet. The data are publicly available to the research commu-nity, as well as the annotated UCSC tracks.
Materials and methods Ethics statement
The Research Ethics Committee of the University of Tartu approved the collection of tissue samples for re-search (permission no 221/M-18). Written informed consent was obtained from next-of-kin to postmortem individuals in order to collect the tissue panel during the autopsy. The research was carried out according to the World Medical Association Declaration of Helsinki.
Sample collection and DNA preparation
The 17 postmortem human somatic tissues used in this study were collected at the time of autopsy. All specimens
were subjected to autolysis for 4 to 8 h and then snap-frozen at -80°C until use in analysis. DNA was extracted from 25 mg samples of the tissue specimens using the NucleoSpin® Tissue kit (Macherey-Nagel GmbH, Düren, Germany). The DNA yield and purity were determined spectrophotometrically (NanoDrop® ND1000; Thermo Fisher Scientific Inc., Waltham, MA, USA) and by gel electrophor-esis, respectively. Bisulfite modification of the genomic DNA samples (600 ng each) was carried out with the EZ DNA Methylation™ kit (Zymo Research, Orange, CA, USA) ac-cording to the manufacturer’s protocol.
Controls for unmethylated and methylated DNA were represented, respectively, by whole-genome amplified DNA from subcutaneous adipose tissue (using the GenomiPhi DNA amplification kit; GE Healthcare, Piscataway, NJ, USA) and the universal methylated human DNA standard (Zymo Research). The bisulfite treatment of the control samples was carried out as described above.
Methylation analysis with illumina infinium HumanMethylation450 BeadChip
[image:10.595.61.539.100.384.2]DNA methylation analysis of the total 72 tissue samples and controls was performed with the Illumina Infinium HumanMethylation450 BeadChip according to the man-ufacturer’s standard protocols. This BeadChip contains Table 3 Gene expression and methylation correlation
Gene region Neg PCCsa Pos PCCsb PCCs < -0.5c PCCs >0.5d Totale
Global 5,710 4,410 1,713 1,090 10,120
56.42% 43.58% 16.93% 10.77%
Promoter + CGI 3,048 2,325 618 567 5,373
56.73% 43.27% 11.50% 10.55%
TSS1500 4,175 4,581 958 1,064 8,756
47.68% 52.32% 10.94% 12.15%
TSS200 4,157 3,199 979 747 7,356
56.51% 43.49% 13.31% 10.15%
5’UTR 1,500 1,604 382 442 3,104
48.32% 51.68% 12.31% 14.24%
1st exon 1,330 1,409 272 357 2,739
48.56% 51.44% 9.93% 13.03%
Body 5,156 4,620 1,573 1,185 9,776
52.74% 47.26% 16.09% 12.12%
3’UTR 3,302 3,494 903 854 6,796
48.59% 51.41% 13.29% 12.57%
Shores 4,534 3,365 1,362 792 7,899
57.40% 42.60% 17.24% 10.03%
Shelves 2,342 2,201 718 576 4,543
51.55% 48.45% 15.80% 12.68%
a
Negative Pearson Correlation coefficients (PCCs). b
Positive PCCs. c
Strong negative PCCs, smaller than -0.5. d
Strong positive PCCs, larger than 0.5. e
more than 485,000 methylation sites, covering 99% of RefSeq genes with an average of 17 CpGs per gene dis-tributed across the promoter, 5′-UTR, first exon, gene body, and 3′-UTR regions [14]. In addition, the Bead-Chip covers 96% of CGI with an average of five CpG sites each, as well as the corresponding shores and shelves. Furthermore, it includes CpGs outside of CGIs, CGIs outside of coding regions, and micro-RNA pro-moter regions.
Validation of BeadChip methylation data by Sanger sequencing
Seventeen genes representing 36 CpG sites (including three unmethylated and fully methylated sites, and 14 genes with tDMRs) were selected for analysis. Primers for PCR amplification of the bisulfite-treated DNA were designed using MethPrimer [23] and are listed in Additional file 9. The 20 μL reaction mixes contained 80 mM Tris-HCl (pH 9.4 to 9.5), 20 mM (NH4)2SO4,
0.02% Tween-20 PCR buffer, 3 mM MgCl2, 1X Betaine,
0.25 mM dNTP mix, 2 U Smart-TaqHot DNA
polymer-ase (Naxo, Tartu, Estonia), 50 pmol forward primer, 50 pmol reverse primer, and 20 ng bisulfite-treated genomic DNA. The PCR cycling conditions were: 15 min at 95°C for enzyme activation, followed by 17 cycles of 30 s at 95°C, 45 s at 62°C, and 120 s at 72°C, with a final -0.5°C/ cycle step-down gradient over 21 cycles of 30 s at 95°C, 30 s at 52°C, and 120 s at 72°C. The sequencing results were analyzed with Mutation Surveyor software (Softgenetics,
State College, PA, USA) and the R statistical computing software [24].
Data normalizing and preprocessing
The raw data were subject to quality control and normalization using the standard protocols suggested for the bioconductor R package minfi [25]. All probes con-taining single nucleotide polymorphisms (n= 65) and CpG sites from the X (n= 11 232) and Y (n= 416) chro-mosomes were removed from the analysis, in order to eliminate the effect of sex-specific methylation.
GO analysis
GO analysis was carried out for the differentially hypo-methylated and hyperhypo-methylated regions between tissues using DAVID [15,26]). The gene sets that showed hyper-or hypomethylation were searched against a default population background (Homo sapiens) and results were matched with GO biological processes (GOTERM BP-FAT). The gene sets obtained from tDMR analysis for each specific tissue were searched against a custom background, which contained all the genes found by tDMR analysis.
Correlation analysis of DNA methylation with gene expression
Gene expression data were obtained from the GEO [27] and ArrayExpress [28] databases. Eight tissues with data from the Affymetrix Human Genome U133A Array
(HG-0.0 0.2 0.4 0.6 0.8 1.0
468
1
0
1
2
1
4
A. Gene promoter+CGI
value
Gene expression
0.0 0.2 0.4 0.6 0.8 1.0
4
68
10
12
14
B. Gene body
value
[image:11.595.57.539.91.320.2]Gene expression
U133A) were selected for analysis; the accession numbers of the datasets used are listed in Additional file 7. For cor-relating the global DNA methylation data with gene ex-pression values, the DNA methylation values were averaged across the gene. Gene expression data were nor-malized and preprocessed according to the robust multi-array average algorithm [29]. All statistical analyses were performed by R statistical computing software.
Algorithm for identifying tDMRs
An MDL-based method that is similar to the one pro-posed for finding haplotype blocks was used to identify differentially methylated regions [30]. In principle, we fit the same statistical model by moving windows of 1 to 50 probes in width and calculate the description length stat-istic. Intuitively, when the same model fits well to several consecutive probes, then one model for all these probes is less costly, in terms of description length, than several separate models. Based on the model fit and its descrip-tion length, the probes were segmented into regions that, in total, give the MDL.
To identify the tDMRs of the studied tissues, the ana-lysis of variance (ANOVA) model with an MDL frame-work was used. For each segment, the model was fitted to compare the tissue of interest against all other tissues studied. The tDMRs were identified according to de-tection by at least three probes and their retaining
statistical significance (P <0.05) after Bonferroni correc-tion. To help identify regions of realistic length, the search was conducted only in regions where the distance between consecutive probes was less than 3 kb. It has been shown that sequence-specific DNA methylation as a regulatory mechanism works on regions larger than 1,000 base pairs [31]. Also, it has been suggested that long-CGI promoters (>2,000 bp) are preferentially asso-ciated with genes that are important in development and tissue-specific gene expression [32]. Additional file 10 shows the correlation between methylation beta values of consecutive probes and how it depends on the dis-tance between these probes. The conservative choice of a 3 kb cutoff was based on this distribution of correla-tions, because for larger distances the average correl-ation is only 0.18 whereas for shorter distances it is 0.42. Meanwhile, these blocks are considered as one region only if the methylation dynamics within the region are similar enough (in terms of the MDL). Tissues with a high functional similarity were processed together.
Data access
[image:12.595.57.542.101.338.2]The data used in this study has been deposited in NCBI’s Gene Expression Omnibus repository and are accessible through GEO Series, accession number GSE50192. Also, the raw data and some extra figures are available on the website [33].
Table 4 Gene expression and methylation correlation in tDMRs
Gene region Neg PCCsa Pos PCCsb PCCs < -0.5c PCCs >0.5d Totale
Global 2,288 1,332 749 372 3,620
63.2% 36.8% 20.7% 10.3%
Promoter + CGI 489 134 76 37 623
78.5% 21.5% 12.2% 5.9%
5’UTR 264 279 57 77 543
48.6% 51.4% 10.5% 14.2%
1st exon 212 217 41 61 429
49.4% 50.6% 9.6% 14.2%
Body 1,148 737 377 224 1,885
60.9% 39.1% 20.0% 11.9%
3’UTR 190 209 51 62 399
47.6% 52.4% 12.8% 15.5%
Shores 1,275 745 423 202 2,020
63.1% 36.9% 20.9% 10.0%
Shelves 445 269 169 82 714
62.3% 37.7% 23.7% 11.5%
a
Negative Pearson Correlation coefficients (PCCs). b
Positive PCCs. c
Strong negative PCCs, smaller than -0.5. d
Strong positive PCCs, larger than 0.5. e
Additional files
Additional file 1:Methylation validation using Sanger sequencing.
For validation of the methylation data from BeadChip, 17 genes were chosen, including unmethylated sites (n= 1), fully methylated sites (n= 2), and genes with tDMRs (n= 14) representing 36 CpG sites altogether. The x-axis shows DNA methylation beta-values obtained from BeadChip, and the y-axis shows beta values from Sanger sequencing.
Additional file 2:Global distribution of methylation.The plot represents the methylation distribution of all specimens (70 samples) analyzed, as well as the controls of unmethylated (0%, negative control) and fully methylated (100%, positive control). The global distribution of methylated CpGs shows that most are either unmethylated or fully methylated in somatic tissues.
Additional file 3:Description of tDMRs found by the simple linear model method of best fit according to MDL.
Additional file 4:Variance in tissues explained by gene regions and CGI regions.(a) The figure is showing the distributions of the R squared statistic, which describes the variance explained by different gene regions and intergenic area. It is clear that gene body and intergenic areas are more variable than gene promoter areas. (b) Distribution of R squared statistic describes the variance explained by CpG island shores, shelves, and non-island regions. Figure shows, that CpG islands are the least variable among these groups.
Additional file 5:GO analysis of hypermethylated tDMRs in specific tissue types.
Additional file 6:Hierarchical clustering of all the samples studied.
Hierarchical clustering of all the samples studied shows that the similarity between different tissues was much higher than between individuals, as tissues are mostly clustering together.
Additional file 7:Gene expression datasets used for correlation analyses.
Additional file 8:Correlation analysis of tDMRs and gene expression for methylations in the CGI-promoter and gene body regions.(a) tDMR genes with low expression show high levels of methylation at CGI-promoter. (b) Gene body methylation in tDMRs is not correlated with gene expression. (a, b) The x-axis shows DNA methylation beta values, and the y-axis shows gene expression values. The different tissues studied are represented by the following symbols: aorta (•), coronary artery (●), bladder ( ), bone and joint cartilage ( ), bone marrow ( ), lymph node ( ), medulla oblongata (+), and tonsils (×).
Additional file 9:PCR primers used in the methylation validation analysis.
Additional file 10:Correlations between consecutive probes.Figure shows the correlation between methylation beta values of consecutive probes and how it depends on the distance between these probes.
Abbreviations
ANOVA:Analysis of variance; CGI: CpG island; GEO: Gene Expression Omnibus; GO: Gene ontology; MDL: Minimum description length; PCC: Pearson correlation coefficient; tDMRs: Tissue-specific differentially methylated regions; TSS: Transcription start site; TSS1500: -200 to -1,500 nt sequence upstream of TSS; TSS200: -200 nt sequence upstream of TSS.
Competing interests
The authors declare that they have no competing interests.
Authors’contributions
KL carried out the studies and drafted the manuscript. VM and BR performed the methylome profiling and gene expression correlation. RM and BR carried out the hierarchical clustering analysis. KM and RK performed the tDMR and inter-individual analysis. KL made the gene ontology analysis. MK carried out the DNA extraction and BeadChip validation analysis. TN, JV, AS, and NT conceived of the study, assisted in various aspects of data analysis, and provided critical commentary on the manuscript. All authors read and approved the final manuscript.
Acknowledgements
This study was supported by grants from the European Regional Development Fund (FP7 grants nos. 278913, 306031, and 313010 to NT), the Center of Excellence in Genomics (grant EXCEGEN to NT and KL), Estonian Ministry of Education and Research (grants nos. SF0180142s08 and SF0180044s09 to NT and AS, respectively), Estonian Research Council (grant IUT20-60 to NT) and University of Tartu (grant SP1GVARENG to NT), Enterprise Estonia (grant EU30020 to AS), EU-FP7 Eurostars program (grant EU41564 to AS), EU-FP7 IAPP project (grant EU324509 to AS), Estonian Center of Excellence in Computer Science (EXCS) and the Estonian Research Mobility Scheme (ERMOS, grants to BR) and Nyckelfonden, örebro, Sweden (grant to TKN). VM was funded by the Complexity-Net programme (Complexity of Independent Epigenetic Signals in Cancer Initiation (CIESCI) project) through Estonian Research Agency. JV and BR were financed through the target funding grant SF0180008s12, the ERDF through the EXCS and the Center of Translational Genomics (CTG, SP1GVARENG).
Author details
1
Institute of Molecular and Cell Biology, University of Tartu, Tartu, Estonia. 2Department of Genetics, United Laboratories, Tartu University Hospital,
Tartu, Estonia.3Estonian Biocentre, Tartu, Estonia.4Institute of Computer Science, University of Tartu, Tartu, Estonia.5Estonian Genome Center, University of Tartu, Tartu, Estonia.6Department of Medical Biosciences, Clinical Chemistry, Umeå University, Umeå, Sweden.7Competence Centre on Reproductive Medicine and Biology, Tartu, Estonia.8Department of Obstetrics and Gynecology, University of Tartu, Tartu, Estonia.9Institute of Bio- and Translational Medicine, University of Tartu, Tartu, Estonia.
Received: 22 May 2013 Accepted: 1 April 2014 Published: 1 April 2014
References
1. Bird AP:CpG-rich islands and the function of DNA methylation.Nature 1986,321:209–213.
2. Bird A:DNA methylation patterns and epigenetic memory.Genes Dev 2002,16:6–21.
3. Madrigano J, Baccarelli A, Mittleman MA, Sparrow D, Vokonas PS, Tarantini L, Schwartz J:Aging and epigenetics: longitudinal changes in gene-specific DNA methylation.Epigenetics2012,7:63–70.
4. Bind MA, Baccarelli A, Zanobetti A, Tarantini L, Suh H, Vokonas P, Schwartz J: Air pollution and markers of coagulation, inflammation, and endothelial function: associations and epigene-environment interactions in an elderly cohort.Epidemiology2012,23:332–340.
5. Liu L, Wylie RC, Andrews LG, Tollefsbol TO:Aging, cancer and nutrition: the DNA methylation connection.Mech Ageing Dev2003,124:989–998. 6. Leonard SM, Wei W, Collins SI, Pereira M, Diyaf A, Constandinou-Williams C,
Young LS, Roberts S, Woodman CB:Oncogenic human papillomavirus imposes an instructive pattern of DNA methylation changes which parallel the natural history of cervical HPV infection in young women. Carcinogenesis2012,33:1286–1293.
7. Slieker RC, Bos SD, Goeman JJ, Bovée JV, Talens RP, van der Breggen R, Suchiman HE, Lameijer EW, Putter H, van den Akker EB, Zhang Y, Jukema JW, Slagboom PE, Meulenbelt I, Heijmans BT:Identification and systematic annotation of tissue-specific differentially methylated regions using the Illumina 450 k array.Epigenetics Chromatin2013,6:26.
8. Nagae G, Isagawa T, Shiraki N, Fujita T, Yamamoto S, Tsutsumi S, Nonaka A, Yoshiba S, Matsusaka K, Midorikawa Y, Ishikawa S, Soejima H, Fukayama M, Suemori H, Nakatsuji N, Kume S, Aburatani H:Tissue-specific
demethylation in CpG-poor promoters during cellular differentiation. Hum Mol Genet2011,20:2710–2721.
9. Yuen RK, Neumann SM, Fok AK, Peñaherrera MS, McFadden DE, Robinson WP, Kobor MS:Extensive epigenetic reprogramming in human somatic tissues between fetus and adult.Epigenetics Chromatin2011,4:7. 10. Fernandez AF, Assenov Y, Martin-Subero JI, Balint B, Siebert R, Taniguchi H,
Yamamoto H, Hidalgo M, Tan AC, Galm O, Ferrer I, Sanchez-Cespedes M, Villanueva A, Carmona J, Sanchez-Mut JV, Berdasco M, Moreno V, Capella G, Monk D, Ballestar E, Ropero S, Martinez R, Sanchez-Carbayo M, Prosper F, Agirre X, Fraga MF, Graña O, Perez-Jurado L, Mora J, Puig S,et al:A DNA methylation fingerprint of 1628 human samples.Genome Res2012, 22:407–419.
specimens identifies tissue- and individual-specific DNA methylation patterns.Hum Mol Genet2009,18:4808–4817.
12. Rakyan VK, Down TA, Thorne NP, Flicek P, Kulesha E, Gräf S, Tomazou EM, Bäckdahl L, Johnson N, Herberth M, Howe KL, Jackson DK, Miretti MM, Fiegler H, Marioni JC, Birney E, Hubbard TJ, Carter NP, Tavaré S, Beck S: An integrated resource for genome-wide identification and analysis of human tissue-specific differentially methylated regions (tDMRs).Genome Res2008,18:1518–1529.
13. Fan S, Zhang X:CpG island methylation pattern in different human tissues and its correlation with gene expression.Biochem Biophys Res Commun2009,383:421–425.
14. Bibikova M, Barnes B, Tsan C, Ho V, Klotzle B, Le JM, Delano D, Zhang L, Schroth GP, Gunderson KL, Fan JB, Shen R:High density DNA methylation array with single CpG site resolution.Genomics2011,98:288–295. 15. Dennis G, Sherman BT, Hosack DA, Yang J, Gao W, Lane HC, Lempicki RA:
DAVID: database for annotation, visualization, and integrated discovery. Genome Biol2003,4:P3.
16. Chang CW, Cheng WC, Chen CR, Shu WY, Tsai ML, Huang CL, Hsu IC: Identification of human housekeeping genes and tissue-selective genes by microarray meta-analysis.PLoS One2011,6:e22859.
17. Davies MN, Volta M, Pidsley R, Lunnon K, Dixit A, Lovestone S, Coarfa C, Harris RA, Milosavljevic A, Troakes C, Al-Sarraj S, Dobson R, Schalkwyk LC, Mill J:Functional annotation of the human brain methylome identifies tissue-specific epigenetic variation across brain and blood.Genome Biol 2012,13:R43.
18. Eckhardt F, Lewin J, Cortese R, Rakyan V, Attwood J, Burger M, Burton J, Cox T, Davies R, Down T, Haefliger C, Horton R, Howe K, Jackson DK, Kunde J, Koenig C, Liddle J, Niblett D, Otto T, Pettett R, Seemann S, Thompson C, West T, Rogers J, Olek A, Berlin K, Beck S:DNA methylation profiling of human chromosomes 6, 20 and 22.Nat Genet2006,38:1378–1385. 19. Duncan BK, Miller JH:Mutagenic deamination of cytosine residues in
DNA.Nature1980,287:560–561.
20. Maunakea AK, Nagarajan RP, Bilenky M, Ballinger TJ, D’Souza C, Fouse SD, Johnson BE, Hong C, Nielsen C, Zhao Y, Turecki G, Delaney A, Varhol R, Thiessen N, Shchors K, Heine VM, Rowitch DH, Xing X, Fiore C, Schillebeeckx M, Jones SJ, Haussler D, Marra MA, Hirst M, Wang T, Costello JF:Conserved role of intragenic DNA methylation in regulating alternative promoters. Nature2010,466:253–257.
21. Ball MP, Li JB, Gao Y, Lee JH, LeProust EM, Park IH, Xie B, Daley GQ, Church GM:Targeted and genome-scale strategies reveal gene-body methyla-tion signatures in human cells.Nat Biotechnol2009,27:361–368. 22. Jjingo D, Conley AB, Yi SV, Lunyak VV, Jordan IK:On the presence and role
of human gene-body DNA methylation.Oncotarget2012,3:462–474. 23. Li LC, Dahiya R:MethPrimer: designing primers for methylation PCRs.
Bioinformatics2002,18:1427–1431.
24. R Core Team:R: A language and environment for statistical computing. Vienna, Austria: R Foundation for Statistical Computing; 2013 [http://www. r-project.org/]
25. Daniel HK, Martin A:Minfi: analyze Illumina’s 450k methylation arrays. 2012, [http://bioconductor.org/packages/release/bioc/html/minfi.html] 26. The Database for Annotation, Visualization and Integrated Discovery
(DAVID).[http://david.abcc.ncifcrf.gov/]
27. Edgar R, Domrachev M, Lash AE:Gene expression omnibus: NCBI gene expression and hybridization array data repository.Nucleic Acids Res2002, 30:207–210.
28. Rustici G, Kolesnikov N, Brandizi M, Burdett T, Dylag M, Emam I, Farne A, Hastings E, Ison J, Keays M, Kurbatova N, Malone J, Mani R, Mupo A, Pedro Pereira R, Pilicheva E, Rung J, Sharma A, Tang YA, Ternent T, Tikhonov A, Welter D, Williams E, Brazma A, Parkinson H, Sarkans U:ArrayExpress update-trends in database growth and links to data analysis tools. Nucleic Acids Res2013,41:D987–D990.
29. Irizarry RA, Hobbs B, Collin F, Beazer-Barclay YD, Antonellis KJ, Scherf U, Speed TP:Exploration, normalization, and summaries of high density oligonucleotide array probe level data.Biostatistics2003,4:249–264. 30. Koivisto M, Perola M, Varilo T, Hennah W, Ekelund J, Lukk M, Peltonen L,
Ukkonen E, Mannila H:An MDL method for finding haplotype blocks and
for estimating the strength of haplotype block boundaries.Pac Symp Biocomput2003, 502–513.
31. Lienert F, Wirbelauer C, Som I, Dean A, Mohn F, Schübeler D:Identification of genetic elements that autonomously determine DNA methylation states.Nat Genet2011,43:1091–1097.
32. Elango N, Yi SV:Functional relevance of CpG island length for regulation of gene expression.Genetics2011,187:1077–1083.
33. Additional data and figures.http://biit.cs.ut.ee/supplementary/17tissues
doi:10.1186/gb-2014-15-4-r54
Cite this article as:Lokket al.:DNA methylome profiling of human tissues
identifies global and tissue-specific methylation patterns.Genome Biology 201415:r54.
Submit your next manuscript to BioMed Central and take full advantage of:
• Convenient online submission
• Thorough peer review
• No space constraints or color figure charges
• Immediate publication on acceptance
• Inclusion in PubMed, CAS, Scopus and Google Scholar
• Research which is freely available for redistribution