M E T H O D
Open Access
Quartz-Seq2: a high-throughput single-cell
RNA-sequencing method that effectively
uses limited sequence reads
Yohei Sasagawa
1†, Hiroki Danno
1†, Hitomi Takada
2†, Masashi Ebisawa
1, Kaori Tanaka
1, Tetsutaro Hayashi
1,
Akira Kurisaki
2*and Itoshi Nikaido
1,3*Abstract
High-throughput single-cell RNA-seq methods assign limited unique molecular identifier (UMI) counts as gene expression values to single cells from shallow sequence reads and detect limited gene counts. We thus developed a high-throughput single-cell RNA-seq method, Quartz-Seq2, to overcome these issues. Our improvements in the
reaction steps make it possible to effectively convert initial reads to UMI counts, at a rate of 30–50%, and detect
more genes. To demonstrate the power of Quartz-Seq2, we analyzed approximately 10,000 transcriptomes from in vitro embryonic stem cells and an in vivo stromal vascular fraction with a limited number of reads.
Keywords:High-throughput single-cell RNA-seq, Flow cytometry, Cell sorter, Quartz-Seq, Poly(A) tagging, Stromal vascular fraction, Mesenchymal stem cell
Background
Single-cell transcriptome analysis is a powerful tool to iden-tify nongenetic cellular heterogeneity, which includes differ-ences in cell type due to differentiation and differdiffer-ences in cell state within a cell population. In previous studies, various methods for single-cell RNA-seq were developed [1–19]. Some of these that generate read coverage across all transcripts have been exploited to detect alternative tran-scription splicing isoforms [14, 17], and others using a unique molecular identifier (UMI) have been applied to quantify the number of transcripts expressed in a cell [1–3,
6,7,9,11–13,20]. To extract substantial information on a cell population, such as the composition of different cell types or the distribution of cell states, it is necessary to analyze hundreds or thousands of cells. Cell barcoding is a key technology for this, which enables us to deal with sam-ples from numerous cells in a single tube. Cell barcoding technology, which tags nucleotides unique to each cell to
target RNA molecules from that cell, is a key technology for increasing the throughput of single-cell RNA-seq [16, 18]. Mixing cDNA tagged with cell barcodes before whole-transcript amplification decreases the cost of reaction re-agents and the laboriousness of experimental steps. There are two types of cell barcoding technology according to the method of cell sampling used. One method involves single cells being selectively sorted to multi-well plates using flow cytometry, which allows us to remove dead or aggregated cells. Besides, transcriptome data can be linked to cellular information obtained by flow cytometry. The other method involves single cells and barcoded beads being captured in water-in-oil droplets using droplet-generation microfluidic devices [6, 7]. In this latter method, thousands of cells can probabilistically be captured in half an hour. However, the total number of sequence reads generated by a deep sequen-cer is still limited. To increase the number of analyzed cells, each cell is assigned a limited number of initial sequence reads. For example, approximately 400 million initial fastq reads were sequenced for 3000–4000 cells in several previ-ous studies [6,7]. In this case, the input data size for a single cell involves shallow initial reads (100,000 fastq reads; Fig.1b). UMI counts were converted from shallow initial se-quence reads for each cell, the conversion ratio of which was limited to approximately one-tenth [21]. Ideally, greater * Correspondence:[email protected];[email protected]
†Equal contributors
2Laboratory of Stem Cell Technology, Graduate School of Biological Sciences,
Nara Institute of Science and Technology, Takayama-cho 8916-5, Ikoma, Nara, Japan
1Bioinformatics Research Unit, Advanced Center for Computing and
Communication, RIKEN, Hirosawa 2-1, Wako, Saitama, Japan Full list of author information is available at the end of the article
b
a
c
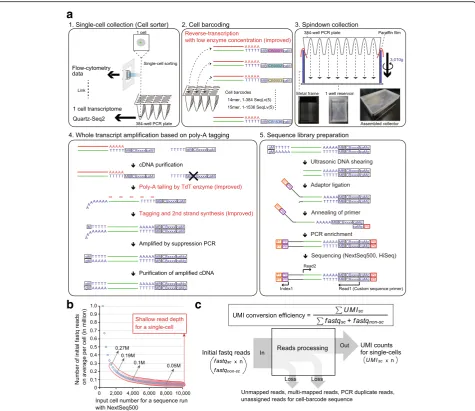
Fig. 1Overview of Quartz-Seq2 experimental processes.aQuartz-Seq2 consists of five steps. (1) Each single cell in a droplet is sorted into lysis buffer in each well of a 384-well PCR plate using flow cytometry analysis data. (2) Poly-adenylated RNA in each well is reverse-transcribed into first-strand cDNA with
reverse transcription primer, which has a unique cell barcode (CB). We prepare 384 or 1536 kinds of cell barcode with a unique sequence based on the
Sequence–Levenshtein distance (SeqLv). The edit distance of SeqLv is 5. The RT primer also has a UMI sequence for reduction of PCR bias (MB) and a poly
(dT) sequence for binding to poly(A) RNA. (3) Cell barcode-labeled cDNAs from all 384 wells are promptly collected by centrifugation using assembled col-lectors. (4) Collected first-strand cDNAs are purified and concentrated for subsequent whole-transcript amplification. In the poly(A) tailing step, purified cDNA
is extended with a poly(A) tail by terminal deoxynucleotidyl transferase (TdT). Subsequently, second-strand cDNA is synthesized with a tagging primer,
which has a poly(dT) sequence. The resulting second-strand cDNA has a PCR primer sequence (M) at both ends of it. The cDNA is amplifiable in a
subse-quent PCR amplification. (5) For conversion from amplified cDNA to sequence library DNA, we fragment the amplified cDNA using the ultrasonicator
Cov-aris. Such fragmented cDNA is ligated with a truncated Y-shaped sequence adaptor, which has an Illumina flow-cell binding sequence (P7) and a pool
barcode sequence (PB). The PB makes it possible to mix different sets of cell barcode-labeled cDNA. Ligated cDNA, which has CB and MB sequences, is
enriched by PCR amplification. The resulting sequence library DNA contains P7 and P5 flow-cell binding sequences at respective ends of the DNA. We
sequence the cell barcode site and the UMI site at Read1, the pool barcode site at Index1, and the transcript sequence at Read2.bThe relationship
between initial fastq reads and the number of single cells for sequence analysis in NextSeq500 runs. Typically, one sequence run with NextSeq 500/550
High Output v2 Kit reads out 400–450 M fastq reads. Thex-axisrepresents the input cell number for one sequence run. They-axisrepresents the initial data
size (fastq reads) on average per cell. Thered outlinerepresents the typical range of shallow input read depth for a single cell.cWe define the formula for
calculating the UMI conversion efficiency. Each parameter is defined as follows:UMIscis the number of UMI counts, assigned to a single-cell sample,fastqsc
is the number of fastq reads derived from each single-cell sample,fastqnon-scis the number of fastq reads derived from non-single-cell samples, which
[image:2.595.61.537.87.498.2]UMI counts should be generated from limited sequence reads because the increase in UMI count assigned to each cell leads to the detection of low-copy genes and the identi-fication of cell type-specific genes using statistical tests.
In this study, we developed a novel high-throughput single-cell RNA-seq method, Quartz-Seq2. As Quartz-Seq is a sensitive and reproducible single-cell RNA-seq method, Quartz-Seq2 was developed based on it [15]. Quartz-Seq is based on a poly(A) tagging strategy. By the com-bination of molecular biological improvements, includ-ing major improvement of poly(A) tagginclud-ing, Quartz-Seq2 resulted in an increase in the effectiveness with which the initial sequence reads were converted to the expres-sion UMI counts (UMI converexpres-sion efficiency 30–50%). To demonstrate the highly effective use of initial reads in Quartz-Seq2, we analyzed a population of approxi-mately 9000 mouse embryonic stem (ES) cells as in vitro cells and approximately 1000 cells from the stro-mal vascular fraction (SVF) as in vivo cells.
Results
Outline of Quartz-Seq2 experiment
To increase the UMI conversion efficiency (Fig.1), we im-proved several steps in the preparation of the single-cell RNA-seq library (Additional file1: Figure S1), resulting in the development of Quartz-Seq2. Below, we explain the five steps of the Quartz-Seq2 procedure (Fig.1).
(1)The first step is single-cell collection using a cell sorter. We selectively sort living single cells into lysis buffer in a 384-well PCR plate without dead cells. In cell sorting, various types of channel information, such as the intensity of fluorescence, are obtained for each cell. This enables us to link the transcriptome to cellu-lar information from a cell sorter for each cell. (2)The second step is cell barcoding. Each well contains
lysis buffer and reverse-transcription (RT) primer, which includes a cell barcode sequence (14- or 15-mer), a UMI sequence (8-15-mer), and an oligo-dT se-quence (24-mer). Using these RT primers, respective RNA from single cells is converted to cDNA with unique cell barcodes. Note that a long RT primer re-sulted in a severe problem regarding the synthesis of byproducts at the downstream reaction in our sys-tem (Additional file1: Figure S2 and Supplemental note). Therefore, we use a relatively short RT primer (73- or 74-mer), which allows us to skip the step of removing byproducts using exonuclease I. We design two types of RT primer set (v3.1, 384 barcodes; v3.2, 1536 barcodes). Within each primer set, barcode se-quences are designed such that the minimum Se-quence–Levenshtein distance between two sequences should be greater than 5, which leads to the correction of mutations of two nucleotides,
including substitution, insertion, or deletion in se-quence reads [22]. We also optimize the buffer and temperature in the RT reaction, leading to an im-provement of RT efficiency from that of the original Quartz-Seq (Additional file1: Figure S3 and Supple-mental note). We apply a low enzyme concentration in RT to Quartz-Seq2. These conditions reduce the cost and technical variability of Quartz-Seq2. We de-scribe the details of this in the“Reduction of enzyme concentration in RT decreased the experimental cost of Quartz-Seq2”section.
(3)The third step involves the pooling of cell-barcoded cDNA. By cell barcoding, Quartz-Seq2 can pool cDNA of up to 1536 individual cells into one mixture. We developed a rapid and high-throughput method for collecting small volumes of cDNA in multiwell plates. This method also achieves higher efficiency of collection than dispensing with pipettes and tips (Add-itional file1: Figure S4 and Supplemental note). As the efficiency of cDNA purification after pooling was 93.77%, we estimated that approximately 80% of cell-barcoded cDNA could be used for subsequent whole-transcript amplification in our system (Additional file1: Figure S3a and Supplemental note).
(4)The fourth step is whole-transcript amplification based on an improved poly(A) tagging strategy. Poly (A) tagging is one of the methods of converting first-strand cDNA to amplifiable cDNA. First-first-strand cDNA is extended with a poly(A) tail by the terminal transferase. Subsequently, second-strand cDNA is synthesized with tagging primers that contain a poly (dT) sequence, followed by PCR amplification. Here, we improve the efficiency of poly(A) tagging by 3.6-fold. This improvement is a crucial point in the de-velopment of Quartz-Seq2. We describe the details of this in the next subsection.
(5)The fifth step is library preparation for deep sequencing. Amplified cDNA is fragmented, ligated with the sequence adapter, and amplified by PCR. In sequencing using Illumina sequencers, a sequence for a cell barcode and a UMI is read in Read1, while a sequence for a region of a transcript (mRNA) is read in Read2.
Improvement of poly(A) tagging efficiency
modified with a poly(A) tail by terminal deoxynucleotidyl transferase; and (2) the poly(A)-tailed cDNA is annealed with a tagging primer, which has a poly(dT) sequence. Then, the second-strand cDNA is extended. The resulting second-strand cDNA is amplifiable cDNA, which has a PCR primer sequence at both ends of it.
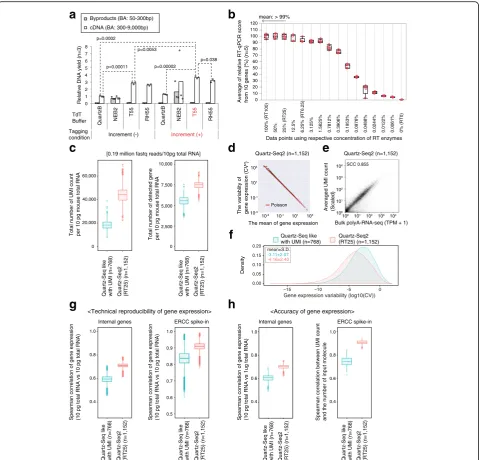
It is known that the DNA yield of amplified cDNA generally reflects the quantitative performance of single-cell RNA-seq methods [3, 13, 14]. Thus, we de-termined the effects of various buffers for the poly(A) tailing step on the amplified cDNA yield. We per-formed the poly(A) tailing reaction with various buffers using purified first-strand cDNA from 1 ng of total RNA (Fig. 2a; Additional file 1: Figure S5). Finally, we obtained amplified cDNA. We found that the use of T55 buffer in the poly(A) tailing reaction efficiently improved the cDNA yield (Fig. 2a). The amount of amplified cDNA increased 2.88-fold using T55 buffer compared with the level using Quartz-Seq buffer (Fig. 2a). In these buffer conditions, we did not observe any obvious byproducts derived from the RT primer (Fig. 2a; Additional file 1: Figures S2 and S5 and Supplemental note).
Next, we added an “Increment” temperature condition for the tagging and second-strand synthesis steps (see
“Methods”). In this condition, the reaction temperature of these steps was gradually increased. As a result, the amount of cDNA tended to increase, by approximately 1.2-fold (Fig. 2a). Moreover, upon combining T55 buffer and the Increment condition, the amount of cDNA in-creased approximately 3.6-fold. We also confirmed the reproducibility of this phenomenon of cDNA increment in additional experiments (Additional file 1: Figure S5). Moreover, we confirmed the amplified cDNA yield of various genes by qPCR analysis as another assay. Specific-ally, we determined the qPCR scores of eight genes from amplified cDNA and nonamplified cDNA (Additional file1: Figure S5c). Spearman’s rank correlation coefficients (SCCs) between amplification and nonamplification were approximately 0.79 in the T55 + Increment condition. The SCC was approximately 0.66 in Quartz-Seq-like conditions. We also observed clear increments of qPCR scores for almost all genes. These results show that the combination of T55 buffer and this temperature condi-tion improved the efficiency of the poly(A) tagging step. We also found that other conditions (NBF40 + Incre-ment) improved the cDNA yield. Under these condi-tions, however, byproducts were clearly synthesized (Additional file 1: Figures S2c and S5b). Moreover, the amount of cDNA with T55 buffer was slightly greater than that with RH55 (Fig. 2; Additional file 1: Figure S5a). Therefore, we used the combination of T55 buffer and the Increment temperature condition for the poly (A) tagging strategy for Quartz-Seq2.
Reduction of enzyme concentration in RT decreased the experimental cost of Quartz-Seq2
The cost of experiments for the single-cell RNA-seq method is one of the most important benchmarks regarding high-throughput performance. The cost of experimental preparation per cell was approximately ¥2600 ($23) for our previously reported Quartz-Seq, which does not use cell barcoding (Additional file 1: Figure S6a). To improve on this value, we first applied the“RT100”enzyme condition in RT to Quartz-Seq2. In this condition, we used approxi-mately 20 U reverse transcriptase in 2 μL of solution for RT. This enzyme concentration in the RT reaction is broadly used for various molecular biological applications, including single-cell RNA-seq methods [3,14,15]. By using the cell barcoding strategy, the cost of experimental prepar-ation for Quartz-Seq2 under the RT100 condition was re-duced (¥122 or $1.08 per cell; Additional file1: Figure S6a).
We found that 65% of the cost of experimental steps is derived from RT in Quartz-Seq2 under the RT100 condi-tion (Addicondi-tional file 1: Figure S7a). To further reduce the cost of experimental preparation of sequence libraries on a large scale, we investigated the effect of a low enzyme con-centration in RT in Quartz-Seq2. In the assessment assay, we noticed that a low enzyme concentration did not mark-edly affect the efficiency of RT in T100 buffer (Additional file1: Figure S7b). We performed a similar experiment with a broader range of concentrations of enzymes in RT under conditions with T100 buffer (Fig. 2b; Additional file 1: Figure S7c). We found that the RT25 condition maintained the efficiency of RT at the 99% level on average, which was comparable to that in the RT100 condition. Therefore, we prepared three technical replicates of a 384-well PCR plate with 10 pg of total RNA with the RT100 condition or the
“RT25” low-enzyme condition. In the RT25 condition, the cDNA yield showed a tendency for a slight increase of approximately 1.17-fold, which although not being a major improvement, did at least not involve a decrease (Additional file 1: Figure S7d). The cost of experimental preparation per cell was approximately ¥46–63 ($0.40– 0.56) in the RT25 condition (Additional file1: Figure S6a). We thus mainly used the RT25 condition for Quartz-Seq2.
Evaluation of the quantitative performance of Quartz-Seq2 using 10 pg of purified total RNA
RT enzyme concentration on the quantitative performance is specifically described in the last paragraph of this subsec-tion. We analyzed 10 pg of total RNA in all wells at
approximately 0.19 M fastq reads on average per well. In the case of the Quartz-Seq-like conditions, we detected 18,407 ± 4040 UMI counts and 5728 ± 604 gene counts
b
a
0 1 2 3 4 5 6 7 8
QuartzB NEB2
T55
RH55
QuartzB NEB2
T55
RH55
Byproducts (BA: 50-300bp)
cDNA (BA: 300-9,000bp)
Relative DNA yield (n=3)
TdT Buffer
p=0.00011 p=0.0053
p=0.038 p=0.00002
p=0.0002
Increment (-) Increment (+)
Tagging condition
20 120 110 100 90 80 70 60 50 40 30
0 10
100% (RT100) 50% 25% (RT25) 12.5% 6.25% (RT6.25) 3.125% 1.5625% 0.7812% 0.3906% 0.1953% 0.0976% 0.0488% 0.0244% 0.0122% 0.0061% 0% (RT0)
Average of relative RT-qPCR score from 10 genes (%) (n=5)
Data points using respective concentration of RT enzymes
c
mean: > 99%
Total number of UMI count per 10 pg mouse total RNA
Total number of detected gene per 10 pg mouse total RNA
Quartz-Seq like with UMI (n=768) Quartz-Seq2 (RT25) (n=1,152) Quartz-Seq like with UMI (n=768) Quartz-Seq2 (RT25) (n=1,152)
h
[0.19 million fastq reads/10pg total RNA]
d
0.00 0.05 0.10 0.15 0.20
−15 −10 -5 0
Gene expression variability (log10(CV))
Density
Quartz-Seq like with UMI (n=768)
Quartz-Seq2 (RT25) (n=1,152)
f
g
Spearman correlation of gene expression (10 pg total RNA vs 10 pg total RNA) Spearman correlation of gene expression (10 pg total RNA vs 10 pg total RNA) Spearman correlation between UMI count and the number of input molecule
Poisson 10-3
10-1
101
103
10-3 10-1 101 103 The variablity of gene expression (CV
2)
The mean of gene expression Quartz-Seq2 (n=1,152)
0 20,000 40,000 60,000
0 2,500 5,000 7,500 10,000
1.0
0.8
0.6
0.4
1.0
0.8
0.7 0.9
0.5 0.6
1.0
0.8
0.6
0.4
Quartz-Seq like with UMI (n=768) Quartz-Seq2 (RT25) (n=1,152) Quartz-Seq like with UMI (n=768) Quartz-Seq2 (RT25) (n=1,152)
<Technical reproducibility of gene expression> <Accuracy of gene expression>
Internal genes ERCC spike-in
Quartz-Seq like with UMI (n=768) Quartz-Seq2 (RT25) (n=1,152)
1.0
0.8
0.6
0.4
Quartz-Seq like with UMI (n=768) Quartz-Seq2 (RT25) (n=1,152) Spearman correlation of gene expression (10 pg total RNA vs 1ug total RNA)
ERCC spike-in Internal genes
e
101
100 102 103 104
100
101
102
103
104 SCC 0.855
Bulk polyA-RNA-seq (TPM + 1)
Averaged UMI count (Scaled)
Quartz-Seq2 (n=1,152)
-3.11±2.07 -4.16±2.40 mean±S.D.
Fig. 2Sequence performance of Quartz-Seq2 with molecular biological improvements.aImprovement of poly(A) tagging efficiency. The relative DNA yield in various poly(A) tagging conditions using purified first-strand cDNA from 1 ng of total RNA. T55 buffer as the terminal deoxynucleotidyl transferase (TdT)
buffer and the temperature condition“Increment”for the poly(A) tagging step improved the cDNA yield of whole-transcript amplification. Buffer
compositions are indicated in Additional file6: Table S5. QuartzB represents use of a Quartz-Seq-like buffer as a positive control, in accordance with the
approach described in the original Quartz-Seq paper. Finally, we quantified cDNA yield (300–9000 bp) and byproduct DNA yield (50–300 bp) using a
Bioanalyzer (Agilent). The presentedpvalue was obtained using two-tailed Welch’st-test.bReverse transcription efficiency with serially diluted RT enzymes.
Thex-axisrepresents the average relative RT qPCR score from ten genes. Detailed concentrations of RT enzymes are presented in Additional file1: Figure
S7.c,f–hComparison between Quartz-Seq2 in the RT25 condition and Quartz-Seq-like conditions regarding sequence performance.cWe analyzed 384
wells with 10 pg of total RNA and used approximately 0.19 M fastq reads on average per well. We show the UMI count and gene count in box plots.dA
scatter plot between the mean of gene expression and the variability of gene expression with 10 pg of total RNA in 384 wells.Red linesrepresent the
theoretical variability of gene expression in the form of a Poisson distribution.eGene expression reproducibility between bulk poly(A)-RNA-seq (1μg of total
RNA) and Quartz-Seq2 (10 pg of total RNA, averaged over 384 wells).fDispersion of gene expression. Thex-axisrepresents gene expression variability.g
[image:5.595.59.539.87.547.2](n= 768 wells from two 384-well plates). In the case of Quartz-Seq2, we achieved a UMI count of 44,100 ± 7521 and a gene count of 7442 ± 484 (n = 1152 wells from three 384-well plates; Fig. 2c). We observed simi-lar results at the level of individual 384-well plates (Additional file 1: Figure S8a). We also calculated the UMI conversion efficiency for the respective protocol at approximately 0.19 million initial fastq reads on average per well. We defined the formula for calculating the
“UMI conversion efficiency”, which indicates how ef-fectively initial fastq reads can be converted to UMI counts (Fig. 1c; Additional file1: Figure S9). The UMI conversion efficiency levels of Seq2 and Quartz-Seq-like were about 22.88% and 9.55%, respectively. The UMI conversion efficiency was reproducible among individual 384-well plates (Additional file1: Figure S8a). In addition, the UMI conversion efficiency depended on the Read2 length and the number of initial fastq reads (Additional file 1: Figure S8b). These results indicated that the combination of the molecular biological improve-ments for Quartz-Seq2 clearly improved the conversion ratio from target RNA to sequence library DNA.
We also validated the technical reproducibility of gene expression. In the mean-CV (coefficient of variation) plot, the technical gene expression variability of Quartz-Seq2 became fairly close to the theoretical variability of a Poisson distribution (Fig. 2d). The mean of gene expres-sion variability for Quartz-Seq2 was lower than that for the Quartz-Seq-like method (Fig. 2f). To quantify the technical reproducibility of internal gene expression and external gene (ERCC spike-in RNA) expression, we used a pairwise comparison of technical replicates for each protocol. Regarding the reproducibility of internal gene expression, the SCCs of Quartz-Seq2 and Quartz-Seq-like were 0.71 ± 0.01 and 0.59 ± 0.02, respectively. Re-garding the reproducibility of external gene expression, the SCCs of Quartz-Seq2 and Quartz-Seq-like were 0.90 ± 0.02 and 0.83 ± 0.04, respectively. Subsequently, we validated the accuracy of internal/external gene sion. We observed that the average internal gene expres-sion of Quartz-Seq2 highly correlated with the internal gene expression of conventional RNA-seq (Fig. 2e). We calculated all combinations of pairwise correlation be-tween the internal gene expression of Quartz-Seq2 with 10 pg of total RNA and that of conventional RNA-seq with 1 μg of total RNA. Moreover, we calculated the pairwise correlation between the external gene expres-sion of Quartz-Seq2 and the input molecule count of ex-ternal genes (ERCC spike-in RNA). Regarding the accuracy of internal gene expression, the SCCs of Quartz-Seq2 and Quartz-Seq-like were 0.70 ± 0.01 and 0.60 ± 0.02, respectively. Regarding the accuracy of ex-ternal gene expression, the SCCs of Quartz-Seq2 and Quartz-Seq-like were 0.90 ± 0.01 and 0.74 ± 0.03,
respectively. These results indicate that the combination of the molecular biological improvements for Quartz-Seq2 clearly improved the technical reproducibility and accuracy of gene expression.
We noted that a low enzyme concentration improved the quantitative performance of Quartz-Seq2. We validated the quantitative performance with 10 pg of total RNA in the RT100 and RT25 conditions at various input data sizes. Un-expectedly, we found that the RT25 condition improved the quantitative performance (Additional file1: Figure S8a). We compared RT25 with RT100 at approximately 0.096 M fastq reads on average per well. In the case of Quartz-Seq2 in the RT25 condition, we achieved a UMI count of 30,117 ± 789 and a gene count of 6320 ± 35 (three 384-well plates). In the case of Quartz-Seq2 in the RT100 condition, we achieved a UMI count of 25,671 ± 1020 and a gene count of 5889 ± 35 (three 384-well plates). We also observed that the well-to-well technical variability for the UMI count and gene count clearly decreased in the RT25 condition (Add-itional file 1: Figure S8a). These results showed that the RT25 low-enzyme condition clearly reduced the experimen-tal cost and improved the quantitative performance. We thus applied the RT25 condition in subsequent experiments using real single cells. Note that, in the RT1.5625-RT6.25 condition, RT efficiency was maintained at an average level of over 90% (Fig.2b). The average RT efficiency rapidly de-creased below the RT1.56 low enzyme concentration. In addition, in actual experiments (not serially diluted experi-ments) at conditions below RT3.12, it was not guaranteed that enzymes could be collected given the viscosity and low volume of the mixture. Therefore, we validated the RT6.25 condition for subsequent analysis. It seems that UMI counts, gene counts, and ERCC capture efficiency (also called “ERCC spike-in RNA detection efficiency”) slightly increased in the RT6.25 condition, which although not be-ing a major improvement, did at least not involve a decrease (Additional file 1: Figure S10). The cost of experimental preparation per cell was approximately ¥31–48 ($0.27– 0.43) in the RT6.25 condition (Additional file1: Figure S6a, Additional file2: Table S1). The RT6.25 low-enzyme condi-tion thus further reduced the experimental cost and slightly improved the quantitative performance.
Quartz-Seq2 shows higher efficiency of UMI conversion and detects more biological pathways than Drop-seq
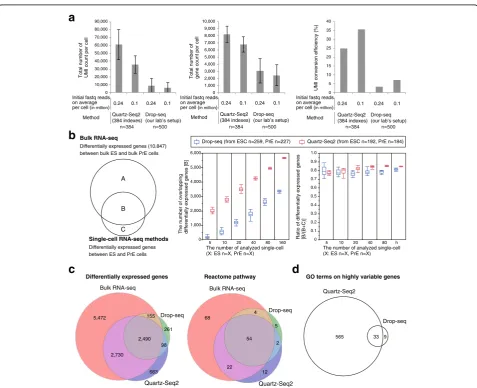
two distinct cell types, we cultured G6GR ES cells and Dex-treated G6GR cells because it has been reported that almost all G6GR ES cells differentiated into primi-tive endoderm-like cells upon dexamethasone treatment [15, 23]. Drop-seq is one of the high-throughput single-cell RNA-seq methods and can capture thousands of cells and barcoded beads in half an hour [6]. The Drop-seq experiments were validated by species-mixing ana-lysis (Additional file 1: Figure S11a, b). We performed Quartz-Seq2 and Drop-seq on a mixture of mouse ES cells and Dex-treated mouse ES cells (primitive endo-derm (PrE) cells) and calculated the UMI conversion effi-ciency (Fig. 3a and Additional file 1: Figure S11c). The
effectiveness of Quartz-Seq2 ranged from 25 to 35% de-pending on the initial fastq read depth (Fig. 3), which was higher than that of Drop-seq.
As Fig. 3a shows, Quartz-Seq2 detected more genes with high UMI conversion efficiency. To examine the power for identifying differentially expressed genes, we performed principal component analysis (PCA) and clus-tering. We randomly selected single cells from ES cluster cells and PrE cluster cells. The number of genes differen-tially expressed between two distinct cell types was cal-culated (ES and PrE cells; Additional file 1: Figure S11 h). We also identified differentially expressed genes (DEGs) between bulk ES cells and PrE cells by using
a
0 10,000 20,000 30,000 40,000 50,000 60,000 70,000 80,000 90,000
0 1,000 2,000 3,000 4,000 5,000 6,000 7,000 8,000 9,000 10,000
0 5 10 15 20 25 30 35 40
Total number of UMI count per cell Total number of gene count per cell
UMI conversion efficiency (%)
Quartz-Seq2 (384 indexes)
Drop-seq (our lab’s setup) Method
Initial fastq reads on average
per cell (in million) 0.24 0.1 0.24 0.1
Quartz-Seq2 (384 indexes)
Drop-seq (our lab’s setup) Method
Initial fastq reads on average
per cell (in million) 0.24 0.1 0.24 0.1
Quartz-Seq2 (384 indexes)
Drop-seq (our lab’s setup) Method
Initial fastq reads on average
per cell (in million) 0.24 0.1 0.24 0.1
c
Differentially expressed genes Reactome pathway
Drop-seq
Quartz-Seq2
Bulk RNA-seq
155
261 5,472
2,730 2,490
663 98
68
54 4
22
2
12 5 Drop-seq
Quartz-Seq2
Bulk RNA-seq
565 33 9
Drop-seq Quartz-Seq2
d
GO terms on highly variable genes
b
n=384 n=500
A
B
C
Bulk RNA-seq
Differentially expressed genes (10,847) between bulk ES and bulk PrE cells
Single-cell RNA-seq methods
Differentially expressed genes between ES and PrE cells
The number of overlapping differentially expressed genes [B]
The number of analyzed single-cell (X: ES n=X, PrE n=X)
Drop-seq (from ESC n=259, PrE n=227) Quartz-Seq2 (from ESC n=192, PrE n=184)
Ratio of differentially expressed genes [B/(B+C)]
The number of analyzed single-cell (X: ES n=X, PrE n=X)
n=384 n=500 n=384 n=500
0 1,000 2,000 3,000 4,000 5,000 6,000
5 10 20 40 80 160 0 0.1 0.2 0.3 0.4 0.5 0.6 0.7 0.8 0.9 1.0
5 10 20 40 80 h
Fig. 3Quartz-Seq2 with high UMI conversion efficiency identified more differentially expressed genes and biological pathways.aUMI counts, gene counts, and UMI conversion efficiency for Quartz-Seq2 and Drop-seq experiments. These values depended on the initial fastq reads on average per cell. Error bars
represent standard deviations.bWe calculated overlapping differentially expressed genes between bulk RNA-seq data and single-cell RNA-seq data. We
randomly picked up the indicated number of single cells and calculated differentially expressed genes 20 times.c,dWe randomly selected 100 ES cells
and 100 PrE cells for each method.cVenn diagram of genes that were differentially expressed between the ES cluster and the Dex-treated ES (PrE) cluster,
as identified by Quartz-Seq2, Drop-seq, and bulk RNA-seq (left). The number of genes that differed in expression level between ES and PrE cells by at least
twofold was determined (FDR < 0.05). We also present a Venn diagram of the Reactome pathway (right).dVenn diagram of Gene Ontology (GO) terms for
[image:7.595.59.537.256.644.2]conventional bulk RNA-seq. We then counted the num-ber of overlapping DEGs between single-cell RNA-seq methods and bulk RNA-seq. We observed that this num-ber linearly correlated with the cell numnum-ber (Fig. 3b). Quartz-Seq2 required fewer cells for the detection of overlapping DEGs. These results showd that more genes that were differentially expressed between the two cell types were identified with Quartz-Seq2 (Fig. 3b, c). In addition, more biological pathways particularly associ-ated with the differentially expressed genes were detected with Quartz-Seq2 (Fig. 3c). Furthermore, we calculated the highly variable expression of genes with Quartz-Seq2 and Drop-seq, which potentially include not only genes that are differentially expressed between cell types but also genes for which expression changes depending on the cell state in a cell type. Terms related to the cell cycle state were only enriched for the genes calculated with Quartz-Seq2 (Fig. 3d). Note that simulation-based power analysis also showed that Quartz-Seq2 detected more DEGs than Drop-seq (Additional file 1: Figure S12a; see “Methods”). These results suggest that high UMI conversion efficiency with limited initial reads leads to more biological information being revealed, such as functional terms and biological pathways.
Superiority of Quartz-Seq2 regarding quantitative performance in the same experimental design compared with other methods
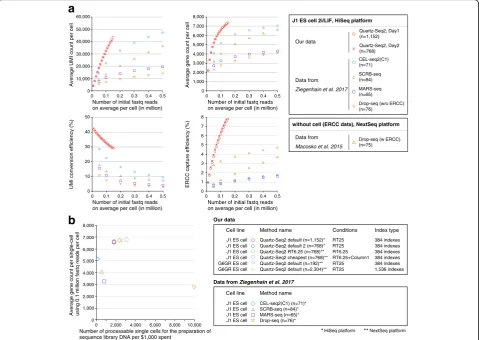
To obtain additional evidence for the superiority of Quartz-Seq2 in terms of the UMI conversion efficiency and gene count, we compared it to other methods. Using mouse J1 ES cells, Ziegenhain et al. systematically com-pared the quantitative performance of several single-cell RNA sequencing (RNA-seq) methods (CEL-seq2(C1), SCRB-seq, MARS-seq, and Drop-seq) that use the UMI technique [21]. Therefore, we cultured J1 ES cells under 2i/LIF conditions in accordance with the procedure de-scribed in this previous paper [21]. We sorted J1 ES cells into five 384-well plates. Subsequently, we prepared se-quence library DNA of Quartz-Seq2 (RT25) with 1152 wells (three 384-well plates) or 768 wells (two 384-well plates) on different days. To compare our data with those obtained in the previous study mentioned above, we used the same analytical conditions as previously applied, such as a HiSeq sequencer platform, Read2 length, the same genome file, and the same transcript annotation file.
First, we compared the quantitative performance be-tween Quartz-Seq2 and other methods at 0.1 million initial fastq reads on average per cell (Fig.4). The results indicate that the UMI conversion efficiency levels of Quartz-Seq2 were approximately 32.55% (day 1) and 32.25% (day 2); the UMI conversion efficiency of the other methods ranged from 7.11 to 22.45%. The average gene counts using Quartz-Seq2 were approximately 6636 (day 1) and 6584
(day 2), while the average gene counts for the other methods ranged from 2738 to 5164. We also validated the quantitative performance for external control RNA. The levels of ERCC capture efficiency for Quartz-Seq2 were approximately 6.12% (day 1) and 6.38% (day 2), while the ERCC capture efficiencies for the other methods ranged from 0.76 to 3.22% (Fig.4a; Additional file1: Figure S13d). We also calculated the copy number of ERCC spike-in RNA at 50% detection probability. The copy number of ERCC spike-in RNA at 50% detection probability for Quartz-Seq2 was approximately 6.82 (day 1) and 6.57 (day 2), while those for the other methods ranged from 13.26 to 710.24 (Additional file1: Figure S13d).
We also performed simulation-based power analysis to estimate the power for identifying differentially expressed genes (Additional file1: Figure S12b; see“Methods”). The true positive rate (TPR) at the data point of 128 cells ranged from 0.91 to 0.92, and the false discovery rate (FDR) at the data point of 128 cells ranged from 0.07 to 0.08. Therefore, the TPR and FDR for each method were comparable to each other. We found that Quartz-Seq2 de-tected more simulated DEGs than the different methods.
In particular, the UMI conversion efficiency and gene count of the Quartz-Seq2 method were significantly better than those of the other methods at approximately 0.1 mil-lion initial reads. We also estimated the UMI and gene counts and the UMI conversion efficiency at various num-bers of initial fastq reads (Fig.4a). We found that Quartz-Seq2 is greatly advantageous for detecting the UMI and gene counts from limited initial amounts of data (under 0.2 million fastq reads). These results showed that the quantitative performance of Quartz-Seq2 was almost al-ways better than that of other methods under conditions with a limited number of initial fastq reads.
Quartz-Seq2 achieves high UMI conversion efficiency at relatively low cost
($0.32) (Additional file1: Figure S6a). For comparison, the library preparation costs of other methods that use a cell sorter range from ¥146 ($1.30) to ¥372 ($3.29) (Additional file1: Figure S6a). Quartz-Seq2 is thus highly competitive with regard to cost with other single-cell RNA-seq methods that use a cell sorter.
To show the potential of Quartz-Seq2 for high-throughput performance, we additionally carried out Quartz-Seq2 (RT6.25 + column1) and Quartz-Seq2 (RT6.25) using J1 ES cells (Fig. 4b). We estimated that
the number of processable single cells per 1000 US dol-lars spent on Quartz-Seq2 ranges from 1785 to 3058 (Fig.4b). We also calculated the total cost, including the sequencing and library preparation costs, for each method. The total cost per cell is extremely low (ap-proximately ¥71–131, or $0.63–1.16) for Drop-seq. The total cost per cell is ¥97–183 ($0.85–1.62) for Quartz-Seq2. Thus, the total cost of Quartz-Seq2, a cell sorter-based method, approaches that typical of droplet-based methods (Additional file 1: Figure S6b).
Fig. 4Quantitative comparison among Quartz-Seq2 and previously reported methods using embryonic stem cells.aWe determined the UMI and
gene counts with Quartz-Seq2 in the RT25 condition using J1 ES cells. We performed Quartz-Seq2 (RT25) with three sets of 384-well plates and two sets of 384-well plates on different days. We also estimated the UMI conversion efficiency of other single-cell RNA-seq methods (CEL-seq2(C1), SCRB-seq,
MARS-seq, and Drop-seq) from a previous study that used mouse ES cells [21]. In our comparison, the Read2 length for transcript mapping was 45
nucleotides for all of the methods, including Quartz-Seq2. We estimated the average UMI and gene counts and the UMI conversion efficiency with various numbers of initial fastq reads for each method. The findings indicate that, compared with the other methods, Quartz-Seq2 has a superior ability
to detect UMI and gene counts from limited initial amounts of data (under 0.2 million fastq reads).bTo investigate the throughput capacity for
establishing sequence library DNA, we estimated the number of processable single cells per $1000 spent on each method: Quartz-Seq2 (384 indexes, RT25) yielded 1785 cells, Quartz-Seq2 (384 indexes, RT6.25) yielded 2325 cells, Quartz-Seq2 (384 indexes, RT6.25 + column1) yielded 3058 cells, Quartz-Seq2 (1536 indexes, RT25) yielded 2500 cells, CEL-seq2(C1) yielded 111 cells, SCRB-seq yielded 500 cells, MARS-seq yielded 769 cells, and
Drop-seq yielded 10,000 cells. The UMI conversion efficiency was approximately 32.55% (n= 1152), 32.25% (n= 768), and 32.12% (n= 192) for
Quartz-Seq2 (384 indexes, RT25), 35.48% (n= 2304) for Quartz-Seq2 (1536 indexes, RT25), 34.04% (n = 768) for Quartz-Seq2 (384 indexes, RT6.25),
35.51% (n= 768) for Quartz-Seq2 (384 indexes, RT6.25 + column1), 22.4% for CEL-seq2(C1), 13.3% for SCRB-seq, 10.6% for MARS-seq, and 7.1% for
Drop-seq. The average gene count was approximately 6636 (n= 1152), 6584 (n= 768), and 6529 (n= 192) for Quartz-Seq2 (384 indexes, RT25), 6712
(n= 2304) for Quartz-Seq2 (1536 indexes, RT25), 6753 (n= 768) for Quartz-Seq2 (384 indexes, RT6.25), 6794 (n= 768) for Quartz-Seq2 (384 indexes,
[image:9.595.59.539.89.429.2]In summary, the Quartz-Seq2 method achieves the highest UMI conversion efficiency and high-sensitivity detection of genes under conditions with limited numbers of initial reads, providing single-cell RNA-seq data in a high-throughput manner.
Demonstration of high-throughput Quartz-Seq2 analysis of 4484 mouse ES cells and differentiated conditions
To demonstrate the capability of Quartz-Seq2 for quanti-fying the transcriptome of a large number of cells and
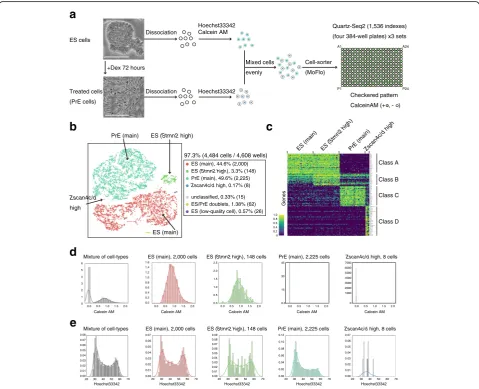
identifying rare cell populations, we analyzed approximately 4484 cells from a mixture of mouse ES cells and differentiation-induced cells. Cells were prestained with Hoechst 33,342 and/or Calcein-AM as an indicator of DNA content and culture condition (ES or PrE cells), respectively (Fig. 5a). Calcein-AM-positive and -negative cells were sorted to 12 384-well plates (4608 well in total) in a check-ered pattern (Fig.5a). These conditions maximize the likeli-hood of detecting the cell doublets caused by mis-sorting. In this analysis, as an average for cells, 0.1 M initial fastq
a
d
b
unclassified, 0.33% (15) ES (main), 44.6% (2,000)
ES/PrE doublets, 1.38% (62) ES (Stmn2 high), 3.3% (148) PrE (main), 49.6% (2,225)
Zscan4c/d high, 0.17% (8)
ES (low-quality cell), 0.57% (26) ES cells
+Dex 72 hours Dissociation
Quartz-Seq2 (1,536 indexes)
(four 384-well plates) x3 sets
Cell-sorter (MoFlo) Treated cells (PrE cells) Dissociation Hoechst33342 Calcein AM Hoechst33342 Mixed cells evenly A1 P24 P1 A24 Checkered pattern
CalceinAM (+ , - )
ES (main) PrE (main)
Zscan4c/d
high
ES (Stmn2 high)
c
ES (main) ES (
Stmn2 high
)
PrE (main)Zscan4c/d
high 1.0 0 0.6 0.4 0.2 0.8 97.3% (4,484 cells / 4,608 wells)
Class A
Class B
Class C
Class D
Mixture of cell-types ES (main), 2,000 cells ES (Stmn2 high), 148 cells PrE (main), 2,225 cells Zscan4c/d high, 8 cells
20 30 40 50 60 70 0.07 0.06 0.05 0.04 0.03 0.02 0.01 0.00 0.08
20 30 40 50 60 70
0.07 0.06 0.05 0.04 0.03 0.02 0.01 0.00
20 30 40 50 60 70
0.07 0.06 0.05 0.04 0.03 0.02 0.01 0.00 0.09 0.08
20 30 40 50 60 70
0.08 0.06 0.04 0.02 0.00 0.12 0.10
20 30 40 50 60 70
0.07 0.06 0.05 0.04 0.03 0.02 0.01 0.00
Hoechst33342 Hoechst33342 Hoechst33342 Hoechst33342 Hoechst33342
e
Calcein AM 1.6 1.4 1.2 1.0 0.8 0.6 0.4 0.2 0.00.0 0.5 1.0 1.5 2.0 0.0 0.5 1.0 1.5 2.0 0.0 0.5 1.0 1.5 2.0 0.0 0.5 1.0 1.5 2.0
Calcein AM Calcein AM Calcein AM
2.5 2.0 1.5 1.0 0.5 0.0 45 30 15 0.0 7000 6000 5000 4000 3000 2000 1000 0
ES (main), 2,000 cells ES (Stmn2 high), 148 cells PrE (main), 2,225 cells Zscan4c/d high, 8 cells
Calcein AM
0.0 0.5 1.0 1.5 2.0
6 5 4 3 2 1 0
Mixture of cell-types
Genes
Fig. 5High-throughput Quartz-Seq2 analysis of 4484 cells from mouse embryonic stem cells and differentiated cells.aWe successfully analyzed 97.3% of 4608 wells. The procedures for cell suspension as used in this assay are shown. Cells cultured under ES-maintenance and Dex-treatment conditions were separately dissociated into single cells, stained with Hoechst 33,342 and/or Calcein-AM, and mixed evenly. Calcein-AM-positive
and -negative cells were sorted to 384-well plates in a checkered pattern.White scale barsrepresent 100μm.bClustering of 4484 single cells
according to the transcriptome. Plotting of cells on t-SNE space with color labeling for each cluster. The percentage indicates the proportion of
cells for each cluster relative to all cells analyzed. Numbers in parentheses indicate the numbers of cells making up the cluster.cMarker genes for
each cluster identified by Quartz-Seq2. Cluster-specific or cluster-enriched genes were calculated for each cluster, and their expression is displayed
as a color in a heatmap. No more than 50 cells are shown for simplicity.dReconstructed distribution of Calcein-AM intensity for each cluster. The
x-axisrepresents the intensity of Calcein-AM dye staining.eReconstructed distribution of Hoechst 33,342 intensity for each cluster. They-axis
[image:10.595.58.538.237.626.2]reads were effectively converted to 35,915 ± 1188 UMI counts in a final gene expression matrix. The UMI conver-sion efficiency was 35.91 ± 1.18%.
Dimensionality reduction of the expression UMI matrix resulting from Quartz-Seq2 showed clear separation of six clusters, including the main populations of ES cells and PrE cells, as well as four small populations. We did not observe a clear batch effect among the 12 384-well plates (Additional file 1: Figure S15). One cluster contained a relatively high proportion of mitochondrial RNA (Additional file1: Figure S16), which was judged to reflect low-quality cells [24]. An-other cluster showed high values of detected UMI counts and gene counts, and expressed both ES and PrE marker genes, which were judged to represent doublets of an ES cell and a PrE cell (Additional file1: Figure S16). To characterize the identified populations, we determined the genes that were specific or enriched for each cluster using binomial tests (Fig. 5c). Although cells in cluster 3 shared gene ex-pression with the main population of ES cells (cluster 1), some genes, includingStmn2andRhox5, were additionally expressed, suggesting that cluster 1 and cluster 3 shared the same cell type but had different cell states. Cluster 5 was a small population (0.17%; Fig.6b) but was characterized by many specific marker genes (Fig.5c), includingZscan4cand
Zscan4d, which are known to be expressed in a
subpopula-tion of mouse ES cells [25]. However, among our culture conditions, these genes were more expressed in the Dex-treatment condition than in the ES-maintenance condition. Flow cytometry information on cells in cluster 5 also showed no fluorescence of Calcein-AM, indicating that these cells were from the suspension of Dex-treated cells (Fig.5d). These observations are consistent with a previous study demonstrating that Zscan4was more expressed in a differentiation condition induced by the withdrawal of leukemia inhibitory factor [7].
In the sampling of cells using a cell sorter, flow cytometry information, including the intensity of Hoechst 33,342 staining for each cell, was collected. Using this information, we reconstructed the distribution of Hoechst 33,342 stain-ing intensity for each cluster (Fig.5e). The main population of ES cells (cluster 1) showed an embryonic pattern of dis-tribution of DNA content, which is characterized by a high ratio of cells in G2 and M phases to cells in the G1phase. In contrast, the main population of PrE cells (cluster 4) showed a somatic pattern of distribution of DNA content. This was consistent with PrE cells being differentiated from ES cells. The cells in cluster 3, the gene expression of which was similar to that of the ES main population (cluster 1), showed an embryonic pattern rather than a somatic one. As the number of cells in cluster 5 that expressedZscan4c/ dwas small, it was difficult to classify the observed pattern as the embryonic or somatic type. These findings indicate the usefulness of single-cell RNA-seq using flow cytometry for the reconstruction of population information after
transcriptome-based clustering. For good interpretation of the distribution, a large number of cells for each cluster are required.
Quartz-Seq2 classified genes with variable expression within a cell type
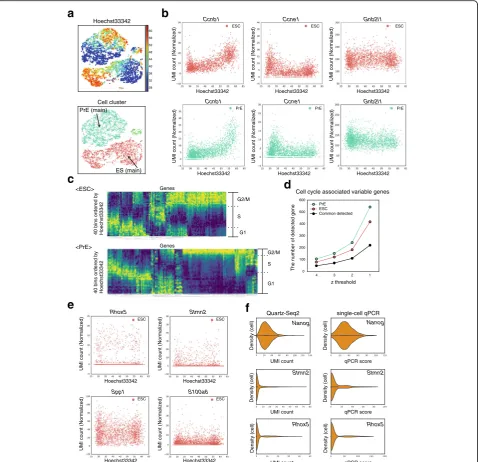
When cells were plotted on t-SNE (t-distributed stochastic neighbor embedding) space using transcriptome analysis and the intensity of Hoechst 33,342 staining was depicted using a color-based scale, the gradient pattern was easily observed for clusters 1, 3, and 4 (Fig.6a), suggesting that Quartz-Seq2 was highly sensitive for detection of the cell cycle state. To examine this, we plotted the gene expres-sion of several cell cycle markers against the intensity of Hoechst 33,342 staining. We observed a strong relation-ship between the gene expression of several cell cycle markers and DNA content (Fig.6b). Using the intensity of Hoechst 33,342 staining as reference for the cell cycle phase, we calculated the relationship between the cell cycle phase and all genes detected in Quartz-Seq2 experiments (see“Methods”). The results enabled us to identify numer-ous genes for which the expression level changed in rela-tion to the DNA content (Fig. 6c, d; Additional file 1: Figure S17). We call these genes“cell cycle associated vari-able genes”. These genes include cell cycle markers. Again, it was confirmed that the ratio of cells in G1and S phases to those in G2and M phases differed between ES and PrE cells (Fig. 6c). As we showed that the efficiency of UMI conversion was high in the Quartz-Seq2 method, we ex-amined whether 10,000 initial reads are sufficient for cell cycle analysis (Additional file 1: Figure S18). In this ana-lysis, the final UMI count was 4774 ± 62 and the UMI conversion efficiency was 47.74 ± 0.66% (n = 3, 1536 wells). Plotting cells on t-SNE space while using color to depict the intensity of Hoechst 33,342 staining revealed a gradient pattern, which was positively correlated with the expression of G2/M phase marker genes, includingCcnb1
and Top2a, and negatively correlated with the expression
of G1phase marker genes such asCcne1(Additional file1: Figure S18). These observations demonstrate that Quartz-Seq2 with few initial sequence reads could analyze the cell cycle due to the high UMI conversion efficiency.
population of ES cells (cluster 1), we identified tens of variable genes the expression of which is less as-sociated with the cell cycle phase. These genes
in-cluded Spp1, Rhox5, and S100a6, which were
previously identified as genes with highly variable ex-pression by scRNA-seq (Fig. 6) [7, 13, 15]. We also identified Stmn2, Dnmt3l, Tmsb4x, and several other
genes as novel variable genes the expression of which is less associated with the cell cycle phase. Single-cell RT-qPCR also showed high variability for Stmn2 and
Rhox5 compared with that for Nanog (Fig. 6f). In
previous studies, Sgk1 and Actb were identified as genes with variable expression by scRNA-seq, which analyzed cells only in the G1 phase or cells without
G1 S G2/M
G1 S G2/M <ESC>
<PrE>
c
d
a
600
500
400
300
200
100
0
1 2 3 4
z threshold
The number of detected gene
Common detected ESC PrE
UMI count (Normalized)
UMI count (Normalized)
UMI count (Normalized)
UMI count (Normalized)
Hoechst33342
Hoechst33342 Hoechst33342
Hoechst33342
Ccnb1 Ccne1
Ccnb1 Ccne1
ESC
PrE ESC
PrE
28 32 36 40 44 48 56
52 60
Hoechst33342
b
ES (main) PrE (main)
Cell cluster
e
Cell cycle associated variable genes
f
UMI count (Normalized)
UMI count (Normalized)
Hoechst33342 Hoechst33342 Gnb2l1
Gnb2l1
ESC
PrE
Rhox5 Stmn2
Nanog
qPCR score
Density (cell)
Nanog
Stmn2
Rhox5
single-cell qPCR Quartz-Seq2
Density (cell)
Density (cell)
qPCR score
qPCR score UMI count
UMI count
UMI count
Density (cell)
Density (cell)
Density (cell)
Genes
Genes
40 bins ordered by Hoechst33342
40 bins ordered by Hoechst33342
UMI count (Normalized)
Hoechst33342
UMI count (Normalized)
Hoechst33342
UMI count (Normalized)
Hoechst33342
UMI count (Normalized)
Hoechst33342
ESC ESC
ESC ESC
Rhox5 Stmn2
Spp1 S100a6
Fig. 6Quartz-Seq2 classified genes with variable expression within a cell type.aPlotting cells on t-SNE space with the colors representing the intensity
of Hoechst 33,342 staining.bDependence of expression of several genes on the intensity of Hoechst 33,342 staining (G2/M phase,Ccnb1; G1phase,
Ccne1; housekeeping gene,Gnb2l1).Upper panels: ES main population (cluster 1).Lower panels: PrE main population (cluster 4).cIdentification of cell cycle-associated genes. Average gene expression of cells in a bin is depicted by color in the heatmap. Bins are arranged in order of Hoechst 33,342
staining intensity.dThe number of cell cycle-associated genes identified for each z-threshold. CV values from which the z-score was calculated are as
follows. ES cells (z = 4, 1.17; z = 3, 0.91; z = 2, 0.68; z = 1, 0.4). PrE cells (z = 4, 1.1; z = 3, 0.88; z = 2, 0.64; z = 1, 0.39).eSeveral examples of genes whose
[image:12.595.60.539.88.550.2]measuring the intensity of Hoechst 33,342 [7, 15]. In this study, these were classified as cell cycle associ-ated variable genes (Additional file 1: Figure S17).
These results show that Quartz-Seq2 globally classified genes with variable expression within a cell type into cell cycle associated variable genes and variable genes the ex-pression of which is less associated with the cell cycle phase by using Hoechst 33,342 staining intensity data ob-tained by flow cytometry.
The global picture of cell-type composition in the stromal vascular fraction as revealed by Quartz-Seq2
Compared with cultured cells, fresh tissue samples tend to be composed of multiple cell types, whose sizes are highly variable. The use of fresh samples is one promising strat-egy to assess the robustness of high-throughput single-cell RNA-seq for various samples. Therefore, Quartz-Seq2 was applied to cells from the mouse stromal vascular fraction (SVF), which was taken from adipose tissue (Fig.7a). SVF is thought to be one of the most important sources of mesenchymal stem cells (MSCs) due to its potential for use in cell therapies and the stimulation of endogenous re-pair [26–29]. However, the global picture of cell-type com-position in SVF has not been clarified. To achieve this, we first observed the distribution of cell size in the SVF popu-lation and found it to be broad (5–13μm, average 6.43 ± 1.35μm;n= 200; Fig.7a). This was confirmed by flow cy-tometry data that were obtained using a cell sorter. It is known that the typical amount of total RNA in a mamma-lian cell is approximately 10 pg [15,17]. Thus, the average amount of total RNA in the SVF population of approxi-mately 1.7 pg is relatively small.
We collected cells in multiple 384-well PCR plates and analyzed their transcriptome using Quartz-Seq2. In this analysis, 38,450 ± 3513 initial fastq reads were converted to UMI counts in the final digital expression matrix. The UMI conversion efficiency was 26.85 ± 2.70% (n = 3). We ob-served broader distributions of UMI counts and gene counts in SVF than in ES and 10 pg of total RNA. The gene counts correlated well with side scatter (SSC) values, which were associated with cell size (Additional file1: Figure S19).
Dimensionality reduction and clustering of single-cell transcriptome data showed the clear separation of 11 clus-ters (Fig.7b). To annotate the cell type for each cluster, we identified differentially expressed genes and functional terms that were either specific or enriched for each cluster (Fig.7c, d; Additional file1: Figure S20). As Fig.7cshows, clusters 1, 2, 5, and 8–11 expressed cluster-specific genes, and clusters 3, 4, 6, 7, and 9 shared expressed genes (marker class C) as well as differentially expressed genes of classes D–G. Taking these markers and functional terms as well as previous knowledge together, each cluster was identified as follows: two types of Cd34-positive MSC (cluster 1, 7.8% of cells from SVF population; cluster 8,
6.4%), two types ofCd4-positive T cells (cluster 3, 45.0%; cluster 4, 1.0%),Cxcr6-positive T cells (cluster 9, 1.71%), B cells (cluster 5, 15.9%), killer T cells (cluster 6, 11.0%), nat-ural killer cells (cluster 7, 3.0%), macrophages (cluster 2, 5.5%), dendritic cells (cluster 10, 0.86%), and plasmacytoid dendritic cells (cluster 11, 0.57%). We noted that the sizes of the T cells and B cells from clusters 3–5, which were measured using a cell sorter, were smaller than those of MSCs and macrophages from clusters 1, 2, and 8 (Add-itional file1: Figure S19). Using immunofluorescence ob-servation, we confirmed that the sizes of CD4-positive T cells and CD79-positive B cells were smaller in SVF (Add-itional file1: Figure S19). These results show that Quartz-Seq2 with flow cytometry data are useful for defining re-spective cell clusters with cell size information.
Subsequently, we investigated the gene expression of ceptors and ligands in cells from the SVF. The variety of re-ceptors expressed in each cluster was similar (Additional file 1: Figure S21). However, we found a wide variety of li-gands expressed in clusters 1 and 8 (Additional file1: Figure S21). It is known that MSCs secrete many paracrine media-tors, which have a therapeutic effect [30, 31]. These results suggest that clusters 1 and 8 are MSCs, which secrete many paracrine mediators.
We focused on these two potential MSC clusters (1 and 8) because the heterogeneity of the MSC population has been discussed in many papers [32,33]. By using Quartz-Seq2, clusters 1 and 8 were shown to have the Cd31
−/Cd34+/Cd45−phenotype (Additional file1: Figure S22).
In a previous study, qPCR-based single-cell transcript ana-lysis of the Cd31−/Cd34+/Cd45− population of SVF was reported. By analyzing 140 genes, the authors identified the
Cd55+/Dpp4+/Cd31−/Cd34+/Cd45− cell population and
showed that the administration of this population was ef-fective for normalizing diabetic wound healing in mice [32]. They identified 13 marker genes for theCd55+/Dpp4
+/Cd31−/Cd34+/Cd45− population in mouse SVF. We
compared the expression of those 13 genes between clus-ters 1 and 8 (Additional file 1: Figure S23). The results showed that almost all of the genes were more highly expressed in cluster 1 than in cluster 8, suggesting that the cluster 1 population was similar to the Cd55+/Dpp4
+/Cd31−/Cd34+/Cd45−population. To further analyze the
relationship between our identified clusters and previously reported heterogeneity of the MSC population, we exam-ined the expression of typical MSC markers (CD90,
CD105, PDGFRa, and Sca-1) [32, 34] as well as
subpopulation-specific markers (Pou5f1, Nanog, Sox2,
Tnnt2, andMyog) [35,36].PDGFRa(Pdgfra) andSca1were
expressed in both clusters 1 and 8, whereas Cd90 was expressed at a higher level in cluster 8 than in cluster 1,
and Cd105 was not strongly expressed in either cluster.
Cd90andCd105were, however, not specific to these MSC
Sox2) nor skeletal and cardiomyogenic markers (Tnnt2and
Myog) were detected in either cluster (Additional file1: Fig-ure S22). Collectively, our transcriptome analysis showed
that the MSC population is divided into two clusters, sug-gesting that there is less heterogeneity of MSCs in the SVF than expected.
a
1 2 11 10 9 8 7 6 5 4 301: Cd34+/Efemp1+ mesenchymal stem cell, 7.79% (82) unclassified, 1.33% (14)
02: Macrophage, 5.51% (58)
03: Cd4+ T-cell, 44.96% (473)
08: Cd34+/Col15a1+ mesenchymal stem cell, 6.36% (67)
04: Cd4+ T-cell (proliferation), 0.95% (10)
05: B-cell, 15.87% (167)
06: Killer T-cell, 11.02% (116)
07: Natural killer cell, 3.04% (32)
09: Cxcr6+ T-cell, 1.71% (18) 10: Dendritic cell, 0.85% (9) 11: Plasmacytoide dendritic cell, 0.57% (6) 91.31% (1,052 cells / 1,152 wells)
b
Dim2 Dim1 1.0 0 0.6 0.4 0.2 0.8 Class A Class B Class C Class D 1 2 11 10 9 8 7 6 5 4 3 Class E Class F Class G Class K Class J Class I Class He
d
c
488-FSC1-Height 0 64 128 192 256 488 -SSC-H e ight0 64 128 192 256
S L
Density (Cell)
Diameter of cell (um)
1 2 11 10 9 8 7 6 5 4 3 1.6 0.8 0.0 -0.8 -1.6 EMT regulation 5 6 7 8 9 10 11 12 Organ formation Embryonic pattern specification Collagen trimer Osteoblast differentiation Cell-cell junction Angiogenesis
Mesenchymal cell differentiation Ribosome biogenesis T cell receptor signal. pathway MHC class I complex Response to IFN-gamma snoRNA binding Lamellipodium organization Dendritic cell differentiation Mast cell activation Chemokine production VEGF pathway
Antigen processing and presentation Mitochondrial repiratory chain Cell division
DNA replication
Genes GO terms
Cell-clusters Cell-clusters
0 4 6 8
Extracellular matrix organization Bmp2,Col14a1,Fbn1,Fgf2,Fn1,Itgb7,Mfap5,Ntn4,Pcolce2,Efemp1
-Log(P-value) Cluster 1: Cd34+/Efemp1+ Cluster 8: Cd34+/Col15a1+ [Reactome pathways] -Log(P-value) 2 10 0 30 20 10
Bmp2,Fbn1,Fn1,Mfap5,Efemp1 Bmp2,Fbn1,Fn1,Mfap5,Efemp1 Igfbp4,Igfbp5,Igfbp6 Fgf2,Fn1,Ntn4 Bgn,Serpinh1,Col15a1,Col3a1,Col4a1,Col4a2,Col4a4,Col5a1,Col5a2,Col6a1,Col6a2, Col1a1,Col1a2,Ctsk,Lama2,Lamb1,Lox,Lum,Mmp2,Nid2,Pcolce,Sparc,Jam2 Serpinh1,Col15a1,Col3a1,Col4a1,Col4a2,Col4a4,Col5a1,Col5a2,Col6a1,Col6a2, Col1a1,Col1a2,Lox,Pcolce Col15a1,Col3a1,Col4a1,Col4a2,Col4a4,Col5a1,Col5a2,Col6a1,Col6a2,Col1a1,Col1a2, Ctsk,Mmp2 Serpinh1,Col15a1,Col3a1,Col4a1,Col4a2,Col4a4,Col5a1,Col5a2,Col6a1,Col6a2,Col1a1, Col1a2,Pcolce Col15a1,Col3a1,Col4a1,Col4a2,Col4a4,Col5a1,Col5a2,Col6a1,Col6a2,Col1a1,Col1a2 Col3a1,Col4a1,Col4a2,Col4a4,Col5a1,Col5a2,Col6a1,Col6a2,Col1a1,Col1a2,Lox Col15a1,Col3a1,Col4a1,Col4a2,Col4a4,Col5a1,Col5a2,Col6a1,Col6a2,Col1a1,Col1a2, Ctsk,Lamb1,Mmp2 Col3a1,Col4a1,Col4a2,Col4a4,Col5a1,Col5a2,Col6a1,Col6a2,Col1a1,Col1a2,Lum,Jam2 Col3a1,Col4a1,Col4a2,Col4a4,Col5a1,Col5a2,Col1a1,Col1a2,Lama2,Lamb1 Bgn,Col3a1,Col5a1,Col5a2,Col6a1,Col6a2,Col1a1,Col1a2,Sparc
Molecules associated with elastic fibres Elastic fibre formation
IGF transport
Non-integrin membrane-ECM interactions
Extracellular matrix organization Collagen formation Collagen degradation Collagen biosynthesis and modifying enzymes Collagen chain trimerization Assembly of collagen fibrils and other multimeric structures Degradation of the extracellular matrix Integrin cell surface interactions Non-integrin membrane-ECM interactions ECM proteoglycans
[Reactome pathways]
[Differentially expressed genes]
[Differentially expressed genes]
Fig. 7Quartz-Seq2 analysis of stromal vascular fraction (SVF) from mouse adipose tissue. aMorphology of SVF cells. Adipose tissue
from a cell suspension of SVF was prepared.Upper panelspresent a photograph of adipose tissues and dissociated SVF samples.
Yellow scale barrepresents 1 cm.White scale barrepresents 10μm.Lower panelsrepresent the distribution of cell size information
with different platforms (left, diameter of cell size using photography;right, flow cytometry information using a cell sorter). The
diameter of cell size for SVF samples was 6.43 ± 1.35 μm (n = 200).b Clustering of cells included in SVF. The transcriptome of
approximately 1000 cells was quantified by Quartz-Seq2 and clustering on t-SNE space was performed. In accordance with the genes and functional terms enriched in each cluster, the cell type was annotated. The percentage indicates the proportion of cells for each
cluster relative to all cells analyzed. Numbers in parentheses indicate the numbers of cells constituting the cluster. cMarker genes for
each cluster were identified by Quartz-Seq2. Cluster-specific or cluster-enriched genes were calculated for each cluster, with their
expression being displayed as color in a heatmap. No more than 50 cells are shown for simplicity.dThe results of Gene Ontology
(GO)-PCA analysis. Functional terms enriched in the genes with high factor loadings of PCA were calculated and the enrichment is
displayed as color in the heatmap. No more than 50 cells are shown for simplicity.eReactome pathway with genes differentially
[image:14.595.59.537.86.542.2]Next, we investigated the difference between the two MSC clusters in SVF. We detected 182 differen-tially expressed genes between clusters 1 and 8 (Add-itional file 3: Table S2). Cluster 8 was characterized by the enriched expression of genes that encode extracellular matrix proteins, including collagens,
Hspg2, and Bgn. By contrast, cluster 1 was
character-ized by the expression of IGFBPs (Igfbp4, Igfbp5,
Igfbp6), prostaglandin endoperoxidase synthases
(Ptgs2), and secreted factors Fgf2 and Bmp2. Notably,
the expression of stem cell-characteristic genes
Aldh1a3, Fgf2, Bmp2, and Tgfbr2 were identified as
important modules in cluster 1, suggesting that this cluster included more stem-like phenotypes that se-crete medicinal factors.
To leverage the power of the entire transcriptome ana-lysis, we performed an enrichment analysis of biological pathways using the 182 genes differentially expressed be-tween the two clusters (Fig.7e; Additional file4: Table S3). Cluster 1 was characterized by elastic fiber pathways and IGF transport pathways. Elastic fibers are constituents of various connective tissues and are related to vascular func-tion [37]. Growth factors including FGF2, BMP2, IGFBPs, and PGE2 regulate growth and differentiation [38]. A tightly linked network of collagen metabolism pathways was found to be highly enriched in cluster 8. These results suggest that two MSC clusters of SVF have different functions. Cluster 1 could feature medicinal cells characterized by the expres-sion of growth and development-related genes. In contrast, cluster 8 may be characterized by the production of extra-cellular matrix.
Taking the obtained findings together, our transcrip-tome analysis by Quartz-Seq2 successfully identified cell populations that consisted of various types of both large and small cells, which were isolated from in vivo tissue, and demonstrated that fresh SVF contains two closely re-lated types of MSCs that have distinct characteristics.
Discussion
The rate of conversion from initial reads to UMI counts has been low, especially in high-throughput single-cell RNA-seq. Ideally, greater UMI counts should be generated from limited sequence reads because the increase in UMI count assigned to each cell leads to the detection of low-copy genes and the identification of cell type-specific genes using statistical tests. To overcome these issues, we devel-oped a novel high-throughput single-cell RNA-seq method, Quartz-Seq2. We calculated the UMI conversion efficiency, which indicated how effectively initial reads can be converted to UMI counts. The UMI conversion effi-ciency of Quartz-Seq2 was 1.44–4.55-fold higher than those of other single-cell RNA-seq methods (Fig. 4). Quartz-Seq2 could detect 1.28–2.41-fold more genes from limited fastq reads and at a lower cost (Fig.4). Moreover,
we decreased the cDNA preparation cost per cell of Quartz-Seq2 by 97.5–98.5% compared with that of Quartz-Seq (Additional file 1: Figure S6a). The total cost (cDNA preparation cost and sequence cost per cell) of Quartz-Seq2 as a cell sorter-based method approaches that of a droplet-based method (Additional file 1: Figure S6b). Furthermore, the use of evaporation-preventing oil might reduce the cDNA preparation cost of Quartz-Seq2 by 75% [2]. By cell barcoding, Quartz-Seq2 can pool cDNA of up to 1536 individual cells into one mixture. Streamlined and simplified experimental processes of Quartz-Seq2 allowed us to handle thousands of single cells within a few days. Quartz-Seq2 also showed high accuracy and high reprodu-cibility, leading to precise measurement of the transcrip-tome from single cells (Fig. 2d, e). We demonstrated Quartz-Seq2 analyses on a total of approximately 9000 mouse ES cells as an in vitro sample and approximately 1000 cells from mouse SVF samples, including MSCs, as an in vivo sample.
We proposed that UMI conversion efficiency could be a useful variable for evaluating performance for the further development of high-throughput single-cell RNA-seq methods with shallow reads. The increase of initial se-quence reads by additional sequencing does not cancel out the low efficiency of UMI conversion at an equal rate. For example, approximately 24,000 fastq reads were converted to approximately 11,000 UMI counts in Quartz-Seq2, while Drop-seq required approximately 169,000 fastq reads to generate the same UMI counts. Under these conditions, the difference in UMI conversion efficiency was 2.5-fold but the difference in required fastq reads to generate the same UMI count was sevenfold. This is because UMI counts do not in-crease linearly with an inin-crease in initial sequence reads due to UMI filtering. Unfortunately, the rate of increase of se-quence throughput was lower than that of the processing ability for single cells. It will thus continue to be important to utilize limited initial fastq reads for high-throughput single-cell RNA-seq methods.
results suggest that improved poly(A) tagging was the most important feature for the high UMI conversion effi-ciency of Quartz-Seq2.
Several improvements proposed in this study could con-tribute to the further development of other single-cell RNA-seq methods, as follows. (1) We showed that a crease of enzyme concentration in RT solution led to de-creases in technical error and cDNA preparation cost. (2) We applied the Sequence–Levenshtein distance for the de-sign of cell barcodes containing RT primer sets. The use of primer sets designed in this study allows the user to correct mutations of at most two nucleotides of a cell barcode, in-cluding substitution, insertion, or deletion; the correction capability of these primer sets is higher than that of barcode sets used in previous studies [1,3]. Such correction of the cell barcode increased the average UMI count by 3–5%. (3) We hope that the spin-down collection system developed in this study can be applied to other cell sorter-based single-cell RNA-seq methods [2,3,11,12]. (4) In Quartz-Seq2, we improved the efficiency of poly(A) tagging itself (Fig. 2). Several single-cell RNA-seq methods, including Quartz-Seq, are based on poly(A) tagging [4,5,10,15,19,40]. Such im-provement may directly contribute to these methods having increased quantitative performance.
We achieved a marked improvement in UMI conver-sion efficiency at a low cost from initial reads to UMI counts, allowing us to analyze three- to tenfold more sin-gle cells in limited sequence experiments. However, it is difficult to sort more than 20,000 single cells in a day when using one cell sorter. While there is greater scal-ability for cell sampling in droplet-based single-cell RNA-seq methods than in cell sorter-based methods, these latter methods can utilize additional information obtained in flow cytometry [41,42], which cannot be de-termined from transcriptome data alone. These two types of method provide complementary approaches for investigating complex biological phenomena. C1 Single-Cell Auto Prep System (Fluidigm) is another widely used platform for single-cell RNA-seq methods [43]. CEL-seq2 shows high UMI conversion efficiency, so it is a very convenient method for users of the C1 platform as a single-cell RNA-seq method based on UMI count [3]. Quartz-Seq2 cannot be performed with the C1 platform, but it can assimilate 1536 cell barcodes in a cell sorter in a high-throughput manner. We think that both methods can be effective as long as the most appropriate one is selected for each situation.
In this study, we showed that Quartz-Seq2 has advan-tages in gene detection and the identification of bio-logical pathways via high UMI conversion efficiency (Fig. 3). Moreover, we analyzed thousands of single cells from all cell cycle phases within a cell type (Fig. 6). These specifications with Quartz-Seq2 allow us to per-form the global classification of genes with variable
expression in a cell type into cell cycle associated vari-able genes and varivari-able genes the expression of which is less associated with the cell cycle phase.
While Hoechst 33,342 is used as an indicator of DNA content, FUCCI reporter systems monitor the ratio of activities for two different cell cycle-associated proteins. Therefore, the latter has an advantage in cell cycle analysis via providing more detailed resolution, although the introduction of re-porter constructs into the cells cannot be applied for all purposes, especially for the analysis of human samples. A previous study utilizing the FUCCI fluor-escent reporter system reported that competence to respond to specific differentiation signaling was limited to only an early or a late window of the G1 phase in human ES cells [44]. In the future,
combin-ing Quartz-Seq2 and FUCCI/FUCCI2 or other
fluorescent reporter systems should lead to an un-derstanding of the global picture of differentiation dynamics regarding competence, response, transition, and commitment because Quartz-Seq2 can analyze changes of cell state for thousands of cells.
In summary, Quartz-Seq2 can be used to obtain continuous data on cell states because of the large number of cells with which it deals and the high effi-ciency of use of initial sequence reads. Quartz-Seq2 can facilitate investigation of the cell state within a cell type, such as gradated or stochastic changes of the cell population in organism development and dis-ease progression.
Conclusions