M E T H O D
Open Access
QsRNA-seq: a method for high-throughput
profiling and quantifying small RNAs
Alla Fishman, Dean Light and Ayelet T. Lamm
*Abstract
The ability to profile and quantify small non-coding RNAs (sRNAs), specifically microRNAs (miRNAs), using high-throughput sequencing is challenging because of their small size. We developed QsRNA-seq, a method for preparation of sRNA libraries for high-throughput sequencing that overcomes this difficulty by enabling a gel-free separation of fragments shorter than 100 nt that differ only by 20 nt in length. The method allows the use of unique molecular identifiers for quantification and is more amenable to automation than gel-based
methods. We show that QsRNA-seq gives very accurate, comprehensive, and reproducible results by looking at miRNAs inCaenorhabditis elegansembryos and larvae.
Keywords:High-throughput sequencing, miRNA,C. elegans
Background
Small RNAs (sRNAs) are non-coding RNA molecules, 20–30 nucleotide (nt) long, that impact diverse biological events through the control of gene expression and gen-ome stability. During the last decade, sRNAs emerged as central players in the regulation of gene expression in all kingdoms of life [1], and they have been shown to regulate virtually all cellular processes. There are several classes of sRNA [2], with Dicer-generated microRNAs (miRNAs) being the most extensively studied [3].
High-throughput sequencing (HTS) is currently the method of choice for identifying and analyzing the cellu-lar repertoire of RNAs because it allows one to investi-gate the entire transcriptome in an unbiased way. While preparation of mRNA and DNA libraries for HTS has become a routine procedure, preparation of sRNA li-braries remains technically challenging. Most protocols for generation of sRNA libraries require the sRNA mole-cules to be ligated from both sides (5′and 3′) to oligo-nucleotide adapters that contain the sequencing primers, reverse transcribed for complementary DNA (cDNA) generation, and amplified by polymerase chain reaction (PCR) [4]. The first challenge that arises at the very be-ginning of library preparation is separation of the sRNAs from other RNA species close in size, in particular
transfer RNA (tRNA). Omission of this step results in sRNA libraries that are highly contaminated. In addition, the adapters readily ligate to each other instead of to the RNA, and this product (adapter dimer), if not removed, is preferably amplified by PCR, resulting in null se-quences in the HTS data. Because of the small size dif-ference between sRNAs and tRNA and between the sRNA-ligated product and adapter dimer, it is very diffi-cult to separate them, decreasing library quality. De-naturing polyacrylamide gel (PAGE), commonly used for size-based separation of small fragments, not only is time consuming and requires expertise, but also results in a significant loss of the product and eliminates the possibility of automating the pipeline. Solid-phase re-versible immobilization (SPRI) on magnetic beads [5, 6] is widely used for nucleic acid separation based on size; however, this method is not able to discriminate between fragments shorter than 100 nt and thus is not applicable for preparation of sRNA libraries.
The implementation of HTS for sRNA profiling is also hindered by the inability to reliably quantify the output data. Small RNA library construction for HTS involves a PCR amplification step that is prone to bias. Because PCR is not a linear process, it quickly reaches plateau, distorting differences in expression. Moreover, PCR efficiency de-pends on the length of the fragment and on its sequence; variations in base composition might lead to preferred template-specific amplifications [7]. Other biases can be
* Correspondence:[email protected]
Faculty of Biology, Technion - Israel Institute of Technology, Technion City, 32000 Haifa, Israel
introduced during library preparation including ligation bias during adapter ligation (reviewed in [8]). HTS-based miRNA expression data is thus not regarded as quantita-tive, and other techniques, mostly quantitative real-time PCR (qPCR) and miRNA microarrays, are used instead for quantification of individual miRNA and for large-scale studies, respectively. While these two assays are accurate and sensitive, both require prior knowledge and accurate annotation of the miRNA sequence tested and are not ap-plicable to discovering novel miRNAs.
PCR-derived artifacts can be corrected by counting ab-solute numbers of molecules using unique molecular identifiers (UMIs) [9] . This method allows distinguishing between original copies of the sRNA present in cells and their amplification products by marking, prior to the amp-lification step, each molecule in a population by attaching a UMI, a short random sequence. Following amplification, each one of the UMIs attached to an original copy of the molecule will be observed multiple times; however, the original copy number of a molecule can be determined simply by counting each UMI only once upon analysis of HTS sequencing data. Thus, UMIs in the library act as a molecular memory for the number of molecules in the starting sample. In addition, it was shown that using UMIs reduces ligation bias by randomizing the adapter se-quences at the ligation junction [8, 10]. Surprisingly, this method is rarely used in generation of sRNA libraries.
Here, we present QsRNA-seq, a novel method for prep-aration of sRNA libraries for HTS sequencing that over-comes the above-mentioned shortcomings. Our protocol comprises two innovations: (1) gel-less size-based separ-ation of fragments shorter than 100 nt, differing in length by 20 nt or more, and (2) use of UMIs to enable quantifi-cation of sRNA expression data.
Results
A novel method for separating nucleic acids shorter than 100 nucleotides
Most of the difficulties in sequencing and quantifying sRNAs derive from their small size. To separate them from tRNA and to separate ligation products from adapter di-mers, a technique is required that will allow simple and re-liable separation based on a fragment size ranging between 20 and 100 nt. To achieve this, we modified SPRI [5,6], a size-selection method based on a non-specific reversible binding of nucleic acid molecules to carboxyl groups-coated magnetic beads in the presence of a “crowding agent”such as polyethylene glycol (PEG). As the efficiency of binding is dependent on the length of the fragment and the concentration of the crowding agent, it is possible to separate two fragments of different lengths. It is well known that adding alcohol, another crowding agent, to PEG modi-fies the range of bound fragment sizes, allowing binding of molecules as short as 18 nt to the magnetic beads. Our
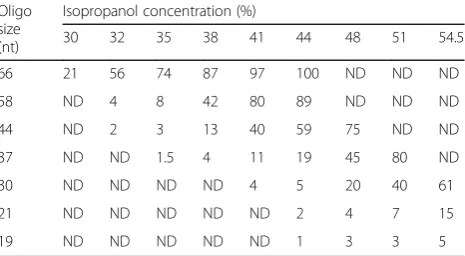
[image:2.595.306.539.527.655.2]hypothesis was that by adjusting the concentration of iso-propanol added to PEG, we would be able to achieve separ-ation of molecules shorter than the 100-nt threshold [11]. Therefore, we prepared a series of SPRI-based size-selection solutions, all having the same concentration of PEG (7.5%) but different concentrations of isopropanol, ranging from 32% to 54.5%, and tested their ability to promote binding of synthetic single-stranded DNA oligonucleotides of different lengths to the beads (see Methods). The oligonucleotides sizes, ranging from 19 to 66 nt, were chosen to cover the separation steps needed for sRNA library preparation, namely separation of sRNA from tRNA, separation of 3’ adapter-ligated sRNA from free 3’adapter, and separation of 3′,5′ adapter-ligated sRNA from adapter dimer. The binding efficiency was calculated by the ratio of oligo-nucleotide quantities in the eluent versus the input using a fluorometer. The results of the experiment are summarized in Table1. As hypothesized, increasing the concentration of isopropanol leads to an increase in binding efficiency. Moreover, for each oligo length tested, we determined a condition resulting in its significant binding (> 40%) to the beads, while oligos shorter by 20 nt bound poorly (< 5%). We next tested the feasibility of using these conditions to separate two oligonucleotides, 37 nt and 58 nt, differing in length by 21 nt. We used two-step size selection on the SPRI beads, by (1) binding the longer fragment to the beads and collecting the unbound material containing the shorter fragments and (2) adding a second batch of beads and iso-propanol, and adjusting the conditions (based on Table1) to allow complete binding of the shorter fragment. Eluting the first and second batch of beads isolated the longer and shorter fragments, respectively. For isolating the 58-nt oli-gos, we used three different concentrations of isopropanol
Table 1Binding efficiencies of single-stranded DNA (ssDNA) oligonucleotides to SPRI beads at varying isopropanol concentrations
Oligo size (nt)
Isopropanol concentration (%)
30 32 35 38 41 44 48 51 54.5
66 21 56 74 87 97 100 ND ND ND
58 ND 4 8 42 80 89 ND ND ND
44 ND 2 3 13 40 59 75 ND ND
37 ND ND 1.5 4 11 19 45 80 ND
30 ND ND ND ND 4 5 20 40 61
21 ND ND ND ND ND 2 4 7 15
19 ND ND ND ND ND 1 3 3 5
100 ng ssDNA oligonucleotides were brought to a total volume of 50μl with H2O, and appropriate amounts of SPRI beads (in 20% PEG, 2.5 M NaCl) and
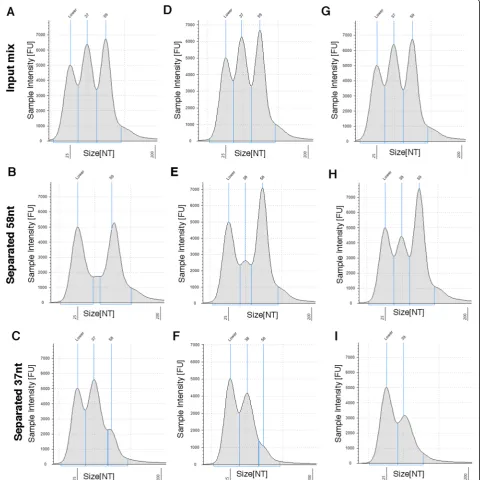
at the first step: 38%, 41%, and 44%. The supernatant, con-taining the unbound shorter oligonucleotide, was trans-ferred to a new tube, and the second step was performed at 54.5% isopropanol to allow maximal recovery of the 37-nt oligos. The input mixture and eluates from each size-selection step were analyzed using TapeStation (see Methods and Fig. 1). Binding efficiencies were consistent with those determined using a single oligo (Table1). Using 38% isopropanol at the first step of the size selection recov-ered around two thirds of the 58-nt input material with minor leftovers of the 37-nt oligos (Fig. 1a, b), while the second step size selection resulted in nearly complete re-covery of the 37-nt oligos but a third of the input material of the 58-nt oligos (Fig.1c). Using 44% isopropanol resulted in a mirror picture: a complete recovery of the 58-nt oligos with a noticeable fraction of 37-nt oligos (Fig.1g, h) by the first step, while the second step size selection yielded a third of the 37-nt input oligos with almost no 58-nt oligos (Fig. 1i). In-between results were observed when using 41% iso-propanol (Fig.1d,e,f). We conclude that by using the con-centrations of isopropanol presented in Table 1, it is possible to separate between two short nucleic acids differ-ing in length by 20 nt with high recovery.
QsRNA-seq: a method for preparation of small RNA libraries
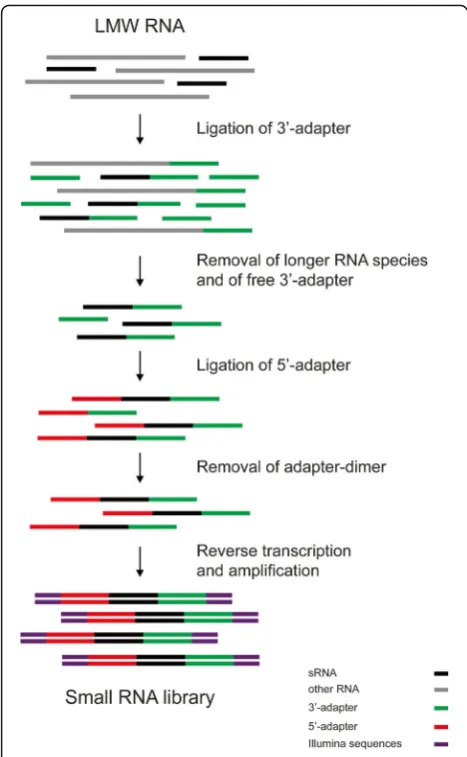
We next designed a new protocol for preparation of sRNA libraries for HTS, utilizing the separation method we devel-oped. The protocol, named QsRNA-seq, is presented in Fig.2(for the detailed protocol see Additional file1). The protocol, based on [12,13], implements two ligation steps: (1) ligation of pre-adenylated 3′adapter without ATP and (2) ligation of 5′adapter containing a 4-nt barcode to allow multiplexing. Three size-separation steps on SPRI paramag-netic beads are performed during the protocol to obtain only the required RNA molecules: (1) separation of 3′ adapter-ligated sRNA from longer RNAs (mainly tRNA), (2) separation of 3′ adapter-ligated sRNA from free 3′ adapter, and (3) separation of 3′,5′ adapter-ligated sRNA from adapter dimer and free 5′adapter (for sizes of frag-ments see Additional file2: Table S1).
The QsRNA-seq protocol is based on the classic sRNA sequencing PAGE-based method [12]. While the PAGE-based method is reliable and has been used in many studies, it is tedious and results in a very low yield. To estimate the efficiency of QsRNA-seq, we prepared libraries from 20 pmol of 22-nt-long synthetic RNA
oligo by both methods (QsRNA-seq and the
PAGE-based method, two replicas each) and directly quantified the obtained 3′,5′-ligated sRNA using Bioana-lyzer. The average yield from QsRNA-seq was about five times higher than that from the PAGE-based method (Additional file 2: Figure S1). Moreover, both replicas generated by QsRNA-seq in terms of quantities were
very similar, while the PAGE-generated replicas were dif-ferent and needed PCR optimization. In addition, redu-cing the starting material by 10-fold when generating libraries by QsRNA-seq yielded a similar outcome (see below). Therefore, we conclude that QsRNA-seq is much more efficient and robust than the standard PAGE-based method.
To further test the quality of QsRNA-seq-generated li-braries, we used RNA extracted from Caenorhabditis elegans embryos because the PAGE-based method was established in C. elegans and has been widely used to study sRNA in this organism. From the same RNA we generated three technical replicas using the classic PAGE-based method with three different barcodes and three technical replicas using QsRNA-seq with the same barcode set. In all six libraries, the fraction of tRNA, which is very close in size to the sRNAs, was minimal (Additional file 2: Table S2). The small nucleolar RNA (snoRNA) fraction was also very low, while the riboso-mal RNA (rRNA) fraction was relatively high, ranging from 20% to 54%. rRNAs are larger in size than tRNA and both are very abundant, suggesting that the high fraction of rRNA is a result of RNA degradation and the quality of the RNA. Indeed, earlier generated libraries (8N_AAGA and PAGE based, Additional file 2: Table S2) contain a lower fraction of rRNA. Comparing the two methods, we found a very significant correlation in miRNA expression (see below and Additional file2: Fig-ure S5) and very similar read length distribution (see below, Additional file2: Figure S11) and first nucleotide preference (Additional file2: Figure S9). Collectively, our results indicate that using QsRNA-seq generates sRNA libraries of equivalent quality and higher yield than those obtained using the classic PAGE-based method.
8Nvs8N). After collapsing the samples with the UMI, two thirds of the miRNAs had a reduction in library construction biases with a 30% average bias reduction (Additional file 2: Figure S2, 0Nvs0N compared to 8Ncolvs8Ncol). In addition, adding a UMI seems to im-prove miRNA quantification (see also the discussions in subsequent sections).
QsRNA-seq can evaluate miRNA abundance and expression changes accurately
To test the ability of QsRNA-seq to detect sRNAs, we used QsRNA-seq on RNA extracted from wild-type C. elegans synchronized to the embryo or the L4 larval stage and on total RNA obtained from human brain. Human brain total RNA was chosen because miRNAs Fig. 1Separation of 37-nt and 58-nt fragments. TapeStation traces of an input mix of two single-stranded DNA oligonucleotides, 37 nt and 58 nt, separated by double-sided size selection on SPRI beads. The first size-selection step was performed at three different isopropanol conditions, 38% (a,b,
[image:4.595.58.546.90.570.2]constitute most of the sRNAs in this sample; thus, we expected it to result in a very uniform library. In con-trast,C. eleganscontains many types of sRNA, including miRNAs, primary and secondary endogenous small interfering RNAs (siRNAs), and piwi-interacting RNAs (piRNAs). We generated three independent biological samples from eachC. elegans developmental stage, em-bryo and L4, as biological replicas. RNA extracted from one sample from each stage was also subjected to three independent library preparations, as technical replicas, and was also used to prepare three technical replica li-braries having no UMI in the 5′ adapter (0 N). All
library preparations resulted in very clean products ready for sequencing with a negligible ratio of adapter dimer containing no product (less than 2% of the total reads in each library; see the examples in Additional file 2: Figure S3 and the library information in Additional file2: Table S3).
To evaluate the quality of the QsRNA-seq output se-quences, we aligned the generated sequences to all annotated miRNAs (both miRNA and miRNA*) inC. elegans, miRBase WBcel235, or in human, miRBase GRCh38. In theC. elegans
sample, all the annotated miRNAs (100%) were present in our samples by at least one strand (3P or 5P), while 97% of all microRNAs had coverage for both strands. Even rare miRNAs such as lsy-6, which is expressed in only one pair of neurons in theC. eleganshead, were present [14] (Additional file3: Table S4). QsRNA-seq allows extensive multiplexing of the samples before amplification, which can reduce signifi-cantly the amount of starting material required. However, even without multiplexing, reducing the starting material by 10-fold, from 1μg to 100 ng, produced nearly identical re-sults (Additional file 2: Figure S4). In human brain, the coverage was somewhat lower, with alignment to 80% of an-notated miRNAs (Additional file4: Table S5). The difference probably derives from the large number of samples that we generated from whole worms at two developmental stages while we only generated one sample from human cells from a specific tissue. However, miRNAs known to be enriched in human brain, for example, let-7 family, mir-9, mir-26a, and others [15], were very abundant in our libraries.
We also compared miRNA expression in the libraries generated by the PAGE-based method and QsRNA-seq method from the same RNA without UMIs and found a very significant correlation (Pearson correlation R2= 0.88,pvalue < 2.2e-16, Additional file2: Figure S5).
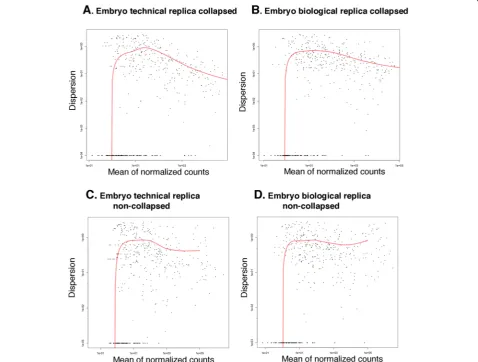
To further assess the consistency of the method, we evaluated the dispersion of miRNA expression between the replica samples, biological and technical, collapsed and non-collapsed. As expected and consistent with our observation that using collapsing reduces library preparation biases, the collapsed replica exhibited lower dispersion rates than the corresponding non-collapsed replica, for both biological and technical replica types (Fig.3, Additional file2: Figure S6). For example, com-paring the dispersion of the biological samples at em-bryo stage between collapsed reads and non-collapsed reads (Fig. 3b, d), we observed at high normalized counts (> e + 03) that the dispersion in the collapsed samples ranges between around e-0.5 and e-0.8, whereas the non-collapsed counts range between e-0.125 and e-0.22. Moreover, collapsed count dispersion decreases as the mean of the normalized counts in-creases, thus confirming our assumption that collapsing will tend to reduce statistical errors more significantly when dealing with larger counts.
[image:5.595.56.290.86.465.2]The increase in variation between samples, before and after collapsing, correlates with the abundance of miRNA in the initial samples, due to biased amplification of the abundant miRNA by PCR. While the ratio between the number of reads obtained for a single miRNA by collaps-ing and by non-collapscollaps-ing is not significant for a low abundance miRNA (Additional file 2: Figure S7A), it in-creases drastically in direct relation to miRNA abundance. Interestingly, the ratio becomes significant (above twofold) when the initial expression level of a miRNA rises above 100 copies (Additional file 2: Figure S7A). Despite this, the higher read number obtained by non-collapsing does not affect the global picture of differential expression be-tween the L4 and embryo stages, i.e., whether a miRNA is upregulated or downregulated (Additional file 2: Figure S8). However, non-collapsing augments the magnitude of
L4/embryo expressional fold change for a subset of miR-NAs (Additional file2: Figure S7B).
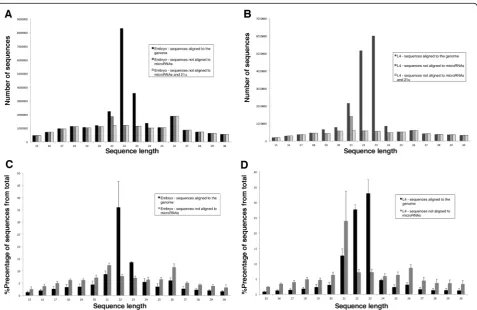
The 23-nt-long small RNAs are enriched in L4 larvae and not in embryos inC. elegans
Besides miRNAs, which are mostly 22 nt long,C. elegans
[image:6.595.59.538.90.452.2]and L4 larval stages (Fig.4). As the libraries were prepared in a way that captures mostly RNAs with 5′monophosphate and not 5′triphosphate by direct ligation, we did not expect to have many secondary siRNAs in these samples. Surpris-ingly, we observed a major difference in sequence length dis-tribution between samples generated from embryos and samples generated from L4 larvae. We found that in em-bryos the most prominent length of sRNAs is 22 nt, while in L4 larval samples the prominent length is 23 nt (Fig.4). By removing sequences that aligned to miRNAs and performing a new length distribution, we found that most of the 22-nt-and 23-nt-long sequences are miRNAs (Fig.4a, b, black bars versus dark gray bars). Similar analysis performed on the 21-nt-long sequences showed that these sequences, detected in all the samples in considerable quantities, are mostly 21 U (Fig. 4a, b). The 26-nt-long sequences predominantly start with a G both in libraries generated by QsRNA-seq and in li-braries generated by PAGE (Additional file 2: Figure S9). Thus, the 26-nt peaks are primary siRNAs, which have a preference to 5’G [17]. Sequences generated from technical replicas or from samples without UMI showed similar length
distribution (Additional file2: Figure S10). The length distri-bution of samples generated by the PAGE-based method was very similar to that of the samples generated by QsRNA-seq (Additional file 2: Figure S11). However, se-quences shorter than 20 nt were almost not present in the PAGE samples because the gel was cut around this length to eliminate non-ligated 3’adapter. As expected, length distri-bution performed on the human brain sample showed sig-nificant peaks at 21–23 nt, corresponding mainly to miRNAs (Additional file2: Figure S12).
To evaluate whether QsRNA-seq can also capture 5′ tri-phosphate secondary siRNAs, which are mainly 22 nt in size, we added a step to the QsRNA-seq protocol, in which RppH enzyme (New England Bioloabs (NEB)) was used to remove two 5′ phosphates to enable ligation to the 5′ adapter. Using the modified protocol, we generated three biological replicas from the embryo stage and three bio-logical replicas from the L4 stage. The length distribution of the sequences was as expected (Additional file2: Figure S13): in both the embryo and L4 developmental stages most of the sequences were 22 nt long. The portion of
[image:7.595.60.538.353.663.2]miRNAs from these sequences was very low compared to sequencing that captures mainly 5' monophosphate sRNA (Fig.4, Additional file2: Figure S13), suggesting that these are mainly secondary siRNAs. In addition, we observed the difference in length distribution of sequences between embryo and L4 in this sequencing method as well; the por-tion of 23-nt-long sequences is much higher in L4 compared to embryo, and these 23-nt-long sequences are mainly miR-NAs (Additional file2: Figure S13).
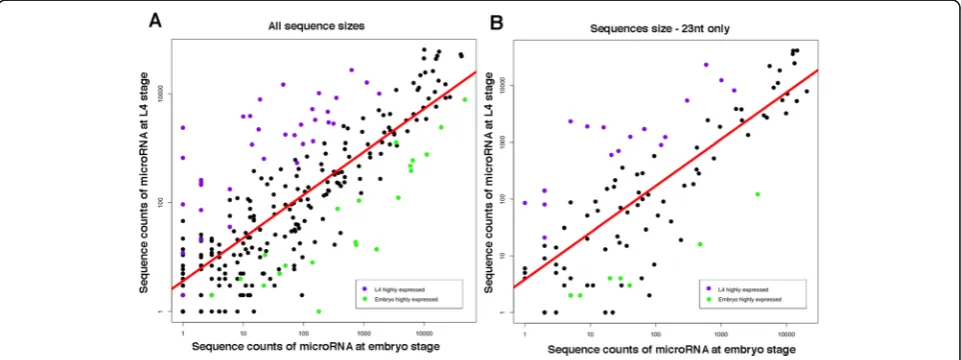
To further study the difference in length distribution of miRNAs between embryo and L4 samples, we evaluated the miRNA expression changes between embryo and L4 developmental stages and estimated the fold change differ-ence. Selecting miRNAs with at least a fivefold difference and an adjustedpvalue after Benjamini–Hochberg correc-tion < 0.01, we found 30 miRNAs that are predominantly expressed in embryo and 38 miRNAs that are predomin-antly expressed in L4 (Fig.5a, Additional file2: Table S3). Our expression analysis is comparable to published data. For example, our findings that lin-4 family and let-7 family members are predominantly expressed during larval de-velopment, and miR-35 family members are predomin-antly expressed in embryogenesis, are in full concordance with data obtained using northern blot analysis [18, 19]. Our analysis is also comparable with large-scale studies performed either by multiplexed qPCR [20] (82% of pre-dominantly expressed miRNAs in L4 and 100% in em-bryos were found by our analysis) or by HTS [21] (96% of predominantly expressed miRNAs in L4 and 55% in em-bryos were found by our analysis). Our analysis was very restrictive—three biological replicas, fivefold or more ex-pression changes, and padj < 0.01— as compared to the other two analyses, which can explain the discrepancies between the lists.
Interestingly, evaluating miRNA expression using only sequences that are 23 nt long (Fig.5b), we found a high fraction of 23-nt-long miRNAs that are predominantly expressed in L4 (45%) as compared to miRNA predom-inantly expressed in the embryo stage (23%) (pvalue < 0.05 by chi-square test). Evaluating miRNA expression using sequences that are 22 nt long, we did not observe a significant difference in the fraction of miRNAs pre-dominantly expressed in L4 versus embryo stage (Add-itional file 2: Figure S14). Evaluating the portion of highly expressed miRNAs in the L4 developmental stage that are 23 nt long compared to 22 nt long at the sam-ples enriched for secondary siRNAs (Additional file 2: Figure S13), we observed a very similar result with a sig-nificant portion of 23-nt-long miRNAs compared to 22-nt-long miRNAs (p value < 0.05 by chi-square test), which was not observed at the embryo stage. Thus, we conclude that inC. elegansthe expression of 23-nt-long miRNAs is developmental stage specific.
Discussion
Although sRNAs (20–30 nt) constitute a very small fraction of the total cellular RNA, they have a significant role in every aspect of cellular and organismal development and maintenance [1]. Thus, identification, characterization, and quantification of sRNAs are an important part of many studies. miRNAs are also promising clinical diagnostic and predictive biomarkers [22]; in particular, miRNAs circulat-ing in body fluids are attractive candidates to serve as markers in non-invasive “liquid biopsies” [23]. Unfortu-nately, because of the difficulty in isolating sRNAs from other nucleic acids very close in size, profiling sRNAs using HTS is often avoided. To overcome this problem, we deter-mined the best conditions to separate short nucleic acid
[image:8.595.58.539.505.685.2]fragments using SPRI beads. Our screen resulted in the de-velopment of a method to separate fragments shorter than 100 nt differing in length by as few as 20 nt. The method also allows flexibility based on the tradeoff between purity and quantity (e.g., better separation between the fragments but less recovery of the desired fragment). While we con-centrated on the binding efficiency of fragments between 19 and 66 nt, for needs of library preparation, binding con-ditions for fragments ranging between 60 and 100 nt can be easily determined in the same manner for any other purpose.
We developed a new protocol, QsRNA-seq, substituting PAGE size selection by SPRI beads, which resulted in a much quicker, technically easier protocol that enables par-allel processing of samples with higher yield. The protocol comprises all the separation steps required for preparing high-quality sRNA libraries for HTS. The 20-nt separation resolution that we gained is sufficient to significantly re-duce the two main contaminants of sRNA libraries: tRNAs and adapter dimers. To further avoid adapter dimer contamination, we also include in the protocol a common method of turning a free 3′ adapter into a double-stranded structure by hybridizing the 3′ adapter with a reverse complementary oligonucleotide [24]. Lack of contaminants resulted, as expected, in an impressive se-quencing depth. The sequences that were obtained aligned to 97% of the annotated C. elegans miRNAs. All other sRNA types known inC elegans, such as endogenous pri-mary and secondary siRNA and 21 U-RNA, were present in significant quantities. The presence of short (20–40 nt) degradation products of other RNA species, in particular long and abundant rRNA molecules, cannot be avoided by this method but can be minimized by using high-quality RNA.
While loss of material during QsRNA-seq is significantly reduced since no gel purification is required, an amplifica-tion step is still needed to produce enough material for HTS. PCR is usually used for amplification; however, it is not a linear process and is not free of biases [7]. In contrast to the heterogeneity in reads observed in mRNA-seq librar-ies, due to random fragmentation of the input mRNA, reads obtained from miRNA libraries are very uniform, making quantification methods used in mRNA-seq, such as collapsing reads or fragments per kilobase per million mapped fragments (FPKM), unsuitable for miRNA quanti-fication. To allow quantification of miRNAs, we use adapters containing random sequences (UMIs) to mark each molecule before the amplification step. Using UMIs, we can collapse the sequencing reads similarly to what is done for mRNA-seq [25], obtaining quantitative global sRNA expression data. Another benefit of using UMIs is that it allows an unlimited number of PCR amplification cycles, enabling library preparation from low amounts of starting material, which is especially beneficial for clinical
purposes. A UMI reliably reflects molecule counts only if the number of distinct labels is substantially larger than the copy number of the most abundant target molecule; a copy number/labels ratio greater than 0.2 results in an approxi-mate 10–25% undercounting of collapsed reads [26]. In our case, the use of 8-nt-long UMIs resulted in a random bar-code pool being saturated for a fraction of highly overex-pressed molecules (Additional file 2: Figure S7). Thus, when highly expressed miRNA quantification is needed or a low amount of starting material that requires many rounds of amplification is used, longer UMIs are preferable. Nevertheless, even with 8-nt-long UMIs, reducing the input material by 10-fold produced very similar results (Add-itional file2: Figure S4). QsRNA-seq can be adjusted easily to longer UMIs using Table1. In addition, the use of UMIs was shown to reduce ligation bias as well [10], which we also observed in our samples (Additional file2: Figure S2). It is also possible to further reduce the ligation bias by mix-ing several barcodes for a specific sample. Sequencmix-ing er-rors in the UMI sequences were shown to reflect on the accuracy of quantification when using UMIs; therefore, it is also possible to use UMI-tools for the analysis [27]. In this analysis we only aligned our sequences to existing miRNA datasets; however, with the sequencing depth our method provides, it is also possible to use the sequences to identify novel miRNAs by tools such as mirTools [28], ShortStack [29], and miRDeep [30].
The sequencing depth allowed by QsRNA-seq led to a surprising finding of an expressional bias of 23-nt-long miRNAs in the L4 larval stage inC. elegans, suggesting a possible connection between the length of miRNA and its role in the organism’s development. Interestingly, a study on endogenous siRNAs in C. elegansshowed that targets of 23-nt siRNAs are associated uniquely with post-embryonic development [31]. Generation of both endogenous siRNAs and miRNAs is dependent on the Dicer enzyme, and the competition among these pro-cesses on resources was suggested to affect development [32]. It is tempting to speculate that sRNA processing by Dicer changes as development progresses, which might be needed for normal development. Studies combining mRNA-seq and sRNA sequencing might be able to shed more light on the function of these 23-nt-long sRNAs.
Conclusions
miRNA in C. elegans using QsRNA-seq suggested that not just miRNA expression varies in different develop-mental stages but also miRNA sizes. We believe that QsRNA-seq can transform the preparation of sRNA li-braries into a routine procedure like the preparation of mRNA libraries.
Methods
C. elegansgrowth and synchronization
Wild-type C. elegans strain Bristol N2 was used in this study and was maintained on OP50-seeded enriched plates at 20 °C as described in [33]. Embryos were iso-lated from gravid N2 adults by treatment with sodium hypochlorite solution to dissolve animals of all stages but embryos. To obtain synchronized L4 worms, em-bryos were incubated in M9 media without food at 20 ° C for 24 h. Hutched synchronized L1 larvae were grown on OP50-seeded enriched plates at 20 °C until they reached the L4 larval stage.
RNA extraction
Synchronized embryos or L4 larval worms were washed several times with M9 to avoid contamination with bac-teria, and then snap-frozen in liquid nitrogen and ground to powder with a liquid nitrogen pre-chilled mortar and pestle. High molecular weight and low molecular weight RNA fractions were isolated using an miRVana miRNA isolation kit (Ambion). RNA quantity was measured with a Qubit® Fluorometer using a Qubit® RNA HS Assay Kit (Molecular Probes), and RNA quality was estimated using agarose gel electrophoresis and TapeStation (Agilent gen-omics). Human Brain RNA was obtained from (First-Choice Human Brain Total RNA, Life Technologies).
Determining SPRI binding conditions
Volumes of PEG solution and isopropanol were calcu-lated using the equation:
Xþ5PV
100þ QV 100¼V
whereV is the total volume,X is the volume of nucleic acid solution, Pis the desired concentration (%) of PEG, andQis the desired concentration (%) of isopropanol.
First, a total volume of binding solution (V) was calcu-lated by substituting P, Q, and Xin the equation for the desired concentrations of PEG and isopropanol and the volume of nucleic acid solution. Next, the volumes of 20% PEG and 100% isopropanol needed for the desired concentrations, equal to 5PV/100 and QV/100, respect-ively, were calculated.
To measure the binding efficiency, a solution of 2 ng/
μl of synthetic single-stranded DNA oligonucleotide was aliquoted at 50 μl per tube. SPRI beads in 20% PEG
(SPRIselect, Beckman-Coulter) and 100% isopropanol were added to each tube at volumes determined using the calculation method above. Size selection was per-formed according to the manufacturer’s protocol (Beck-man’s AMpureXP, left-side selection). Oligonucleotide concentrations in the input and eluted samples were measured with a Qubit® Fluorometer and a Qubit® ssDNA Assay Kit (Molecular Probes). The binding effi-ciency was calculated by the percentage of the output oligonucleotide obtained from the input quantity.
Small RNA library preparation
Small RNA libraries were prepared from at least three bio-logical replicas of N2 worms at the embryo or L4 stage. One RNA sample from each stage was selected for prepar-ing two additional libraries, resultprepar-ing in three technical rep-licas for each stage.
A step-by-step protocol developed in this study that in-cludes reagents and primers is described in Additional file 1. In short, low molecular weight RNA was ligated to a 5′-adenylated 3′adapter using T4 RNA Ligase 2, truncated (NEB) in an absence of ATP. For preparation of phosphate-independent libraries after the ligation, the sample was in-cubated with 5 U of RppH enzyme (NEB) for 30 min at 37 °C. The 3′ adapter-ligated sRNA was separated from free 3′adapters and longer RNA species and then ligated to a 5′adapter, containing multiplexing barcode and UMI, using T4 RNA Ligase 1 (NEB). sRNA ligated from both sides was then separated from the adapter dimer and free 5′ adapter to obtain an sRNA library. All the separation steps of the library preparation process were performed using the method described above involving modified SPRI-based size selection of short fragments. The sRNA li-brary was reverse transcribed using a qScript Flex cDNA Synthesis Kit (Quantabio) and amplified using Phusion High-Fidelity DNA Polymerase (NEB). The amplified li-brary was cleaned from primers and irrelevant products below 100 bp and above 200 bp by double-side size selec-tion on SPRI beads (Beckman’s AMpureXP) according to the size-selection conditions recommended by the manual, and its concentration and quality were determined by TapeStation analysis (Agilent Genomics). Libraries prepared by the PAGE-based method were prepared exactly as de-scribed in [34]. Libraries were sequenced using 50-bp single-read (SR) sequencing mode on a HiSeq 2500 plat-form (Illumina). All sequences generated in this study were submitted to the National Center for Biotechnology Infor-mation (NCBI) Gene Expression Omnibus (GEO) (http:// www.ncbi.nlm.nih.gov/geo/) [35] under accession number GSE96824.
Sequence processing and expression analysis
were trimmed off by scanning from the 3′end of the se-quence the first instance of the adapter sese-quence in incre-ments of 1 nt. We then either (1) removed the barcode and UMI (8-nucleotide) and considered these sequences as non-collapsed, or (2) merged identical sequences and then removed the barcode and UMI, and considered these se-quences as collapsed.
C. elegans sequences were either aligned to the WS220 (Wormbase, www.wormbase.org) genome [36] using Bow-tie [37] for size distribution analysis, allowing no mis-matches with no more than 10 alignments to the genome (the Bowtie parameters are bowtie -v 0 -e 120 -a --strata --best -m 10) or aligned to miRBase WBcel235 (www.mir-base.org) [38], allowing no mismatches and not more than one alignment (Bowtie parameters are -v 0 -e 120 -a --strata --best -m 1). Human brain sequences were aligned to miRBase GRCh38 [38] with the same Bowtie parameters. We used the full miRBase WBcel235 and not just high-confidence miRNAs to allow a large enough dataset for significant comparison. Size distribution analysis was done on processed sequences before and after alignment to the genome. The DESeq [39] package in R (http:// www.r-project.org) [40] was used to evaluate miRNA ex-pression, and the estimateDispersions function in DESeq was used to estimate the dispersion between biological rep-licas and technical reprep-licas.
Additional files
Additional file 1:Extended protocol. QsRNA-seq: preparation of sRNA libraries using size selection on SPRI beads. (PDF 196 kb)
Additional file 2:Table S1.Sizes of nucleic acid fragments used and generated during QsRNA-seq library preparation process.Figure S1.Comparing the yield of PAGE-based method versus QsRNA-seq small RNA library preparation methods.Table S2. Comparison between libraries prepared by PAGE-based method and libraries prepared by QsRNA-seq from the same RNA sample. Fig-ure S2.
Estimation of ligation and PCR derived biases when adding UMI.Figure S3.
Quantity and purity of QsRNA-seq generated libraries.Table S3.Summary of libraries generated in the study.Figure S4.Reducing starting RNA quantity by 10-fold produces similar results.Figure S5.There is a high correlation between samples generated from the same RNA by PAGE-based method and by QsRNA-seq.Figure S6.Variance between collapsed and non-collapsed biological and technical replica samples atC. elegansL4 stage is low.Figure S7. Col-lapsing sequences using UMI reduces PCR biases.Figure S8.Collapsing se-quences using UMI does not change differential expression results of miRNAs.Figure S9.The 26-nt-long sequences primarily start with 5’G. Fig-ure S10.Size
[image:11.595.301.539.471.738.2]distribution ofC. eleganssRNA library sequences with and without UMI.
Figure S11.Size distribution ofC. eleganssRNA library sequences generated by the PAGE-based method or by QsRNA-seq.Figure S12.Size distribution of sequences from human brain sRNA library generated by QsRNA-seq. Fig-ure S13.Size distribution ofC. eleganssRNA library sequences generated by QsRNA-seq after phosphatase treatment.Figure S14.The 22-nt-long microRNAs are expressed similarly inC. elegansembryo and L4 stages. (PDF 3458 kb) Additional file 3:Table S4.miRNA expression inC. elegansembryo and L4 (biological and technical replicas). (XLSX 125 kb)
Additional file 4:Table S5.microRNA expression in human brain sample. (XLSX 89 kb)
Acknowledgements
We thank Professor Emeritus Vladimir Lin, from the Technion Faculty of Mathematics, for his help in developing the equation for calculating the volumes of PEG and isopropanol. We also thank Orna Ben-Naim Zgayer, Nabeel Ganem, and Noa Ben-Asher for critical reading of the manuscript and discussions.
Funding
This work was funded by the Israeli Centers of Research Excellence (I-CORE) program, (Center No. 1796/12 to ATL), the Israel Science Foundation (grant No. 644/13 to ATL), and the Israel Cancer Research Fund (ICRF).
Availability of data and materials
All data generated in this study can be accessed from NCBI/Genbank short read archive (GEO) [41] accession number [GEO:GSE96824]:https:// www.ncbi.nlm.nih.gov/geo/query/acc.cgi?acc=GSE96824[42].
A detailed protocol of QsRNA-seq is given in Additional file1. The processed data is provided in Additional files3and4.
Authors’contributions
AF and ATL designed the experiments and protocol. AF performed the experiments. DL and ATL performed the bioinformatics analysis. AF and ATL wrote the manuscript. All authors read and approved the final manuscript.
Competing interests
PCT Patent Application No. PCT/IL2017/050761, entitled“Methods for Isolation and Quantification of Short Nucleic Acid Molecules,”authored by AF and ATL, was filed by Technion Research and Developmental Foundation on 6 July 2017. The application claims priority from US Provisional Application No. 62/359,245. The patent does not restrict the use of the method for the purpose of academic research. Author DL decares that he has no competing interests.
Publisher’s Note
Springer Nature remains neutral with regard to jurisdictional claims in published maps and institutional affiliations.
Received: 6 May 2018 Accepted: 30 July 2018
References
1. Jost D, Nowojewski A, Levine E. Small RNA biology is systems biology. BMB Rep. 2011;44:11–21.
2. Youngman EM, Claycomb JM. From early lessons to new frontiers: the worm as a treasure trove of small RNA biology. Front Genet. 2014;5:416. 3. Bartel DP. MicroRNAs: target recognition and regulatory functions. Cell.
2009;136:215–33.
4. Lu C, Meyers BC, Green PJ. Construction of small RNA cDNA libraries for deep sequencing. Methods. 2007;43:110–7.
5. Borgstrom E, Lundin S, Lundeberg J. Large scale library generation for high throughput sequencing. PLoS One. 2011;6:e19119.
6. Lundin S, Stranneheim H, Pettersson E, Klevebring D, Lundeberg J. Increased throughput by parallelization of library preparation for massive sequencing. PLoS One. 2010;5:e10029.
7. Dabney J, Meyer M. Length and GC-biases during sequencing library amplification: a comparison of various polymerase-buffer systems with ancient and modern DNA sequencing libraries. Biotechniques. 2012; 52:87–94.
8. Raabe CA, Tang T-H, Brosius J, Rozhdestvensky TS. Biases in small RNA deep sequencing data. Nucleic Acids Res. 2014;42:1414–26.
9. Kivioja T, Vaharautio A, Karlsson K, Bonke M, Enge M, Linnarsson S, Taipale J. Counting absolute numbers of molecules using unique molecular identifiers. Nat Methods. 2012;9:72–4.
10. Fuchs RT, Sun Z, Zhuang F, Robb GB. Bias in ligation-based small RNA sequencing library construction is determined by adaptor and RNA structure. PLoS One. 2015;10:e0126049.
11. Paithankar KR, Prasad KSN. Precipitation of DNA by polyethylene glycol and ethanol. Nucleic Acids Res. 1991;19:1346.
13. Lui W-O, Pourmand N, Patterson BK, Fire A. Patterns of known and novel small RNAs in human cervical cancer. Cancer Res. 2007;67:6031–43. 14. Johnston RJ, Hobert O. A microRNA controlling left/right neuronal
asymmetry in Caenorhabditis elegans. Nature. 2003;426:845–9.
15. Skalsky RL, Cullen BR. Reduced expression of brain-enriched microRNAs in glioblastomas permits targeted regulation of a cell death gene. PLoS One. 2011;6:e24248.
16. Grishok A. Biology and mechanisms of short RNAs inCaenorhabditis elegans. Chap. 1. In: Theodore Friedmann TJCD, Stephen FG, editors. Advances in Genetics, vol. 83. Amsterdam: Academic Press; 2013. p. 1–69.
17. Ruby JG, Jan C, Player C, Axtell MJ, Lee W, Nusbaum C, Ge H, Bartel DP. Large-scale sequencing reveals 21U-RNAs and additional MicroRNAs and endogenous siRNAs in C. Elegans. Cell. 2006;127:1193–207.
18. Abbott AL, Alvarez-Saavedra E, Miska EA, Lau NC, Bartel DP, Horvitz HR, Ambros V. The let-7 MicroRNA family members mir-48, mir-84, and mir-241 function together to regulate developmental timing in Caenorhabditis elegans. Dev Cell. 2005;9:403–14.
19. Esquela-Kerscher A, Johnson SM, Bai L, Saito K, Partridge J, Reinert KL, Slack FJ. Post-embryonic expression of C. Elegans microRNAs belonging to the lin-4 and let-7 families in the hypodermis and the reproductive system. Developmental Dynamics. 2005;234:868–77.
20. Karp X, Hammell M, Ow MC, Ambros V. Effect of life history on microRNA expression during C. Elegans development. RNA. 2011;17:639–51. 21. Kato M, de Lencastre A, Pincus Z, Slack FJ. Dynamic expression of small
non-coding RNAs, including novel microRNAs and piRNAs/21U-RNAs, during Caenorhabditis elegans development. Genome Biol. 2009;10:R54. 22. Faruq O, Vecchione A. microRNA: diagnostic perspective. Frontiers Medicine.
2015;2:51.
23. Zen K, Zhang C-Y. Circulating MicroRNAs: a novel class of biomarkers to diagnose and monitor human cancers. Med Res Rev. 2012;32:326–48. 24. Vigneault F, Ter-Ovanesyan D, Alon S, Eminaga S, C Christodoulou D, Seidman
JG, Eisenberg E, M Church G: High-throughput multiplex sequencing of miRNA. Curr Protoc Hum Genet 2012, Chapter 11:Unit 11.12.11–10. 25. Lamm AT, Stadler MR, Zhang H, Gent JI, Fire AZ. Multimodal RNA-seq using
single-strand, double-strand, and CircLigase-based capture yields a refined and extended description of the C. elegans transcriptome. Genome Res. 2011;21:265–75.
26. Fu GK, Hu J, Wang P-H, Fodor SPA. Counting individual DNA molecules by the stochastic attachment of diverse labels. Proc Natl Acad Sci. 2011;108: 9026–31.
27. Smith T, Heger A, Sudbery I. UMI-tools: modeling sequencing errors in unique molecular identifiers to improve quantification accuracy. Genome Res. 2017;27:491–9.
28. Wu J, Liu Q, Wang X, Zheng J, Wang T, You M, Sheng Sun Z, Shi Q. mirTools 2.0 for non-coding RNA discovery, profiling, and functional annotation based on high-throughput sequencing. RNA Biol. 2013;10: 1087–92.
29. Axtell MJ. ShortStack: comprehensive annotation and quantification of small RNA genes. RNA. 2013;19:740–51.
30. An J, Lai J, Lehman ML, Nelson CC. miRDeep*: an integrated application tool for miRNA identification from RNA sequencing data. Nucleic Acids Res. 2013;41:727–37.
31. Asikainen S, Heikkinen L, Wong G, Storvik M. Functional characterization of endogenous siRNA target genes in Caenorhabditis elegans. BMC Genomics. 2008;9:270.
32. Zhuang JJ, Hunter CP. The influence of competition among C. Elegans small RNA pathways on development. Genes. 2012;3:671–85.
33. Brenner S. The genetics of Caenorhabditis elegans. Genetics. 1974;77:71–94. 34. Gent JI, Lamm AT, Pavelec DM, Maniar JM, Parameswaran P, Tao L, Kennedy
S, Fire AZ. Distinct phases of siRNA synthesis in an endogenous RNAi pathway in C. Elegans soma. Mol Cell. 2010;37:679–89.
35. Barrett T, Wilhite SE, Ledoux P, Evangelista C, Kim IF, Tomashevsky M, Marshall KA, Phillippy KH, Sherman PM, Holko M, et al. NCBI GEO: archive for functional genomics data sets—update. Nucleic Acids Res. 2013;41:D991–5. 36. Chen N, Harris TW, Antoshechkin I, Bastiani C, Bieri T, Blasiar D, Bradnam K,
Canaran P, Chan J, Chen C-K, et al. WormBase: a comprehensive data resource for Caenorhabditis biology and genomics. Nucleic Acids Res. 2005; 33:D383–9.
37. Langmead B, Trapnell C, Pop M, Salzberg SL. Ultrafast and memory-efficient alignment of short DNA sequences to the human genome. Genome Biol. 2009;10:R25.
38. Kozomara A, Griffiths-Jones S. miRBase: annotating high confidence microRNAs using deep sequencing data. Nucleic Acids Res. 2014;42:D68–73. 39. Anders S, Huber W. Differential expression analysis for sequence count data.
Genome Biol. 2010;11:R106.
40. R Core Team. R: a language and environment for statistical computing. Vienna, Austria: R Foundation for Statistical Computing; 2013. http://www.R-project.org/.
41. Edgar R, Domrachev M, Lash AE. Gene Expression Omnibus: NCBI gene expression and hybridization array data repository. Nucleic Acids Res. 2002; 30:207–10.